SlideShare ist ein Scribd-Unternehmen logo
1 von 16
Downloaden Sie, um offline zu lesen
11 February 2015
3QFY15 Results Update | Sector: Agri
Jain Irrigation
Atul Mehra (Atul.Mehra@MotilalOswal.com); +91 22 3982 5417
Niket Shah (Niket.Shah@MotilalOswal.com); +91 22 3982 5426
BSE SENSEX S&P CNX
CMP: INR66 TP: INR100 (+51%) Buy28,534 8,627
Bloomberg JI IN
Equity Shares (m) 443.1
M.Cap. (INR b) / (USD b) 29.3/0.5
52-Week Range (INR) 133/56
1, 6, 12 Rel. Per (%) -4/-44/-35
Avg Val,INRm/Vol ‘000 409/4,526
Free float (%) 71.3
Financials & Valuation (INR b)
Y/E MAR 2015E 2016E 2017E
Net Sales 59.8 70.7 83.8
EBITDA 7.7 9.3 11.1
Adj PAT 0.5 2.0 3.7
EPS (INR) 1.0 4.3 8.1
Gr (%) -29.5 325.0 87.0
BV/Sh.INR 46.5 49.9 56.8
RoE (%) 2.2 9.0 15.2
RoCE (%) 8.6 11.4 14.2
P/E (x) 64.9 15.3 8.2
P/BV (x) 1.4 1.3 1.2
Estimate change
29%
TP change
17%
Rating change
Worst is behind; expect recovery in FY16
n Results below estimates led by weak farm incomes, polymer price decline: JI
reported a revenue of INR12.9b (est. INR14.4b), YoY de-growth of 6%. While
growth in Micro Irrigation (MIS) (-10.5% YoY) was weak due to lower farm
incomes (impacted by untimely rains and drought in Maharashtra and lower agri
commodity prices), PVC Pipes (-11.1% YoY) and PE Pipes’ (-29.4% YoY) demand
was impacted due to weak offtake in a deflationary polymer price environment as
buyers postponed purchases. On the positive side, Food processing business
reported robust growth, with Onion dehydration growing 58.3% YoY and Fruit
Processing growing 24.6% YoY.
n Margins impacted by inventory write-down, PAT lower due to forex loss:
EBITDA stood at INR1.49b (est. INR1.73b) in 3QFY15, with EBITDA margin at
11.5% (est. 12%). Margin was impacted due to an inventory loss of INR180m
(1.4% of revenue) due to lower PVC prices, adjusted for which margin expanded
50bp YoY. Reported PAT for the quarter stood at -INR396m (est.
-INR198m), against INR259m in 3QFY14, impacted by forex loss (INR458m) due to
MTM impact of INR depreciation on forex loans.
n MIS working capital improvement on track: Gross receivable days in MIS
business declined by 14 days QoQ (from 211 in 2QFY15 to 197 days in 3QFY15).
Management maintained its guidance of 180 receivable days for FY15 and 120 for
FY16 along with a debt reduction of INR3b for 4QFY15.
n Valuation and view: We expect strong free cash generation over FY15-17E led by
domestic MIS business, which should aid to reduce the debt-equity from 1.8x in
FY15 to 1.3x in FY17E. We cut the earnings estimates for FY16E/17E by 43%/29%
respectively to reflect the lower-than-expected growth and margins. We expect
growth and margins to recover in FY16 on the back of a normal monsoon and
lower polymer prices. We maintain Buy, with a TP of INR100 (12x FY17E EPS).
Investors are advised to refer through disclosures made at the end of the Research Report.
Motilal Oswal research is available on www.motilaloswal.com/Institutional-Equities, Bloomberg, Thomson Reuters, Factset and S&P Capital.
11 February 2015 2
Jain Irrigation
Results below estimates
n JI reported overall revenue of INR12.9b (est INR14.4b) as against INR13.8b in
3QFY14 marking a YoY de-growth of 6%.
n Growth was lower than expected due to lower growth in MIS business in
Maharashtra, impacted by untimely rains and drought.
n Similarly, deflationary polymer price environment impacted growth in PVC and
PE Pipes business as buyers postponed purchases.
n EBITDA stood at INR1.49b (Est INR1.73b) in 3QFY15 with EBITDA margins at
11.5% (Est 12.0%).
n Interest costs increased by 2.6% YoY and stood at INR1,205m in 3QFY15 as
against INR1,174m in 3QFY14.
n Forex loss for the quarter stood at INR458m.
n Consequently, PAT for the quarter stood at INR-396m (Est INR-198m) as against
INR259m in 3QFY14.
n Management expects FY16 to be a better year on expectation of a normal
monsoon and lower probability of El Nino affecting rains.
n Similarly, margins are expected to improve in FY16 due to lower polymer prices.
Exhibit 1: Consolidated revenue trend (INR m)
Source: Company, MOSL
Exhibit 2: EBITDA trend (INR m)
Source: Company, MOSL
Exhibit 3: PAT trend (INR m)
Source: Company, MOSL
14,094 12,171 13,746 18,333 15,534 12,702
12,919
11.5
22.3
26.6
9.0 10.2
4.4
-6.0
1QFY14
2QFY14
3QFY14
4QFY14
1QFY15
2QFY15
3QFY15
Consolidated Revenue (INR m) Growth (YoY) %
2,086 1,523 1,710 2,562 2,006 1,572 1,492
14.8
12.5 12.4
14.0 12.9 12.4 11.5
1QFY14
2QFY14
3QFY14
4QFY14
1QFY15
2QFY15
3QFY15
EBITDA Margins (%)
-603 -807
259
753
203
-235
-396
0.0
-93.7
1.5
-1.5 NM NM NM
1QFY14
2QFY14
3QFY14
4QFY14
1QFY15
2QFY15
3QFY15
PAT Growth (%)
11 February 2015 3
Jain Irrigation
MIS growth negative due to weak farm incomes
n MIS business de-grew by 10.5% to INR3.6b. While export business de-grew 26%
YoY, domestic business reported weak growth of -8%.
n Domestic MIS business was impacted due to muted demand on account of
untimely rains in Maharashtra and pressure on agri commodity prices.
n States like Gujarat, Karnataka, Andhra Pradesh and North & North East posted
positive growth during the quarter.
n Management highlighted that despite extremely weak rural sentiments,
domestic MIS growth for 3QFY15 was steady due to better marketing efforts.
n Maharashtra government is expected to announce time-bound schedules for
mandatory sugarcane drip irrigation implementation. Management expects
sugarcane to be INR80-90b opportunity which can drive long term growth.
n MIS volume declined by ~3-4%.
n JI has an outstanding order book of INR1.2b in MIS export business.
Exhibit 4: MIS business growth by segment MIS business contribution by segment
Segment 3QFY14 3QFY15 YoY Segment 3QFY14 3QFY15 YoY
Retail 2,621 2,527 -4% Retail 64% 69% 5%
Project 894 707 -21% Project 22% 19% -3%
Export 559 414 -26% Export 14% 11% -3%
Total 4,074 3,648 -10% Total 100% 100% 0%
Source: Company, MOSL
Most of government subsidy receivables have been recovered
n Government subsidy receivables have been reduced from INR9.7b in FY12 to
INR2.7b in 2QFY15. This has been led shift in favor of business to more
progressive states like Maharashtra, Gujarat and Rajasthan.
n Management believes government subsidy receivables will further decline to
less than INR2.0b in FY15. This is despite higher growth for the MIS business.
Exhibit 5: Break-up of MIS receivables (INR b)
MIS -Receivables FY12 FY13 FY14 1QFY15 2QFY15 3QFY15
Dealer 2.5 1.7 2.2 2.1 1.7 1.5
Institutional 1.8 1.1 1.3 1.2 1.2 1.3
Project 3.1 2.4 3.4 4.0 4.4 3.4
Govt. Subsidy 9.7 7.1 3.9 3.4 2.6 2.7
Export 0.6 0.4 1.0 0.8 0.6 0.7
Total 17.7 12.7 11.9 11.5 10.5 9.6
Source: Company, MOSL
11 February 2015 4
Jain Irrigation
MIS working capital improvement on right trajectory
n MIS net working capital improved by 61 days YoY from 306 days in 3QFY14 to
245 days in 3QFY15.
n MIS Debtors days showed a significant improvement of 68 days from 265 days in
3QFY14 to 197 days in 3QFY15.
n Inventory days improved by 12 days YoY to 101 days in 3QFY15.
Exhibit 6: MIS revenue trend
Source: Company, MOSL
Exhibit 7: MIS networking capital reducing
Source: Company, MOSL
Exhibit 8: MIS debtors decreased by 68 days YoY
Source: Company, MOSL
Exhibit 9: MIS inventory days reduced by 12 days YoY
Source: Company, MOSL
Polymer price deflation drives de-growth in PVC and PE piping businesses
n PVC piping business de-grew by 11.1% YoY from INR1.97b in 3QFY14 to
INR1.75b in 3QFY15.
n PE piping business de-grew by 29.4% to INR1b in 3QFY15.
n Demand was impacted as deflationary polymer price environment resulted in
buyers to postpone purchases.
n Inventory days in piping business improved by 14 days YoY to 40 days.
n Debtor days in piping business increased by 22 days YoY to days.
n Consequently Net working capital days in piping business reduced by 24 days to
-31 days.
n De-growth in PE piping business in 3QFY15 is expected to recover led by major
infrastructure related orders expected in 4Q.
n Similarly, as crude oil and polymer prices have now stabilized, demand revival is
expected in the PVC pipes business as well.
3,855 2,933 4,074 6,225 4,248 3,801
3,647
16.5 17.2
25.7 24.8
10.2
29.6
-10.5
1QFY14
2QFY14
3QFY14
4QFY14
1QFY15
2QFY15
3QFY15
MIS revenue (INR M) Growth (YoY %)
296
317 306
255
235
255 245
1QFY14 2QFY14 3QFY14 4QFY14 1QFY15 2QFY15 3QFY15
Net Working Capital
308
279 265 257 243
211 197
1QFY14 2QFY14 3QFY14 4QFY14 1QFY15 2QFY15 3QFY15
Debtor days (Gross) 116
113 113
98
103 102 101
1QFY14 2QFY14 3QFY14 4QFY14 1QFY15 2QFY15 3QFY15
Inventory days
11 February 2015 5
Jain Irrigation
Exhibit 10: PVC Piping revenue trend
Source: Company, MOSL
Exhibit 11: Piping net working capital days negative
Source: Company, MOSL
Exhibit 12: Piping inventory days down 14 days YoY
Source: Company, MOSL
Exhibit 13: Piping receivable days up by 22 days YoY
Source: Company, MOSL
Exhibit 14: PE piping revenues trend (INR m)
Source: Company, MOSL
Exhibit 15: PVC Sheets revenues trend (INR m)
Source: Company, MOSL
3,247 1,089 1,976 2,440
2,578
1,323 1,757
36.5
1.6 3.0
-8.3
-20.6
21.5
-11.1
1QFY14
2QFY14
3QFY14
4QFY14
1QFY15
2QFY15
3QFY15
PVC Pipes Revenue (INR m) Growth (YoY %)
-11
-16
-7 -8
-20
-11
-31
1QFY14 2QFY14 3QFY14 4QFY14 1QFY15 2QFY15 3QFY15
Net Working Capital
58 60
54
35 37 37 40
1QFY14 2QFY14 3QFY14 4QFY14 1QFY15 2QFY15 3QFY15
Inventory days
67
58
39
51
44
49
61
1QFY14 2QFY14 3QFY14 4QFY14 1QFY15 2QFY15 3QFY15
Debtor days (Gross)
752 1,688 1,479 1,259 696
753
1,044
-3.3
197.7
95.9
22.8
-7.5 -55.4
-29.4
1QFY14
2QFY14
3QFY14
4QFY14
1QFY15
2QFY15
3QFY15
PE Piping Revenue Growth (YoY %)
342 539 604 676 407
377
367
-17
65
22
117
19.1
-30.0
-39.2
1QFY14
2QFY14
3QFY14
4QFY14
1QFY15
2QFY15
3QFY15
PVC Sheets revenue Rev. YoY
11 February 2015 6
Jain Irrigation
Food processing business delivered strong growth
n Food processing business delivered strong performance with onion dehydration
revenue growing by 58.3% YoY to INR272m; while fruit processing business
growing by 24.6% YoY to INR1.2b.
n Food processing inventory days declined by 40 days YoY to 246 days. However
Debtor days were up by 50 days to 98 days, which as per management is a
temporary phenomenon.
n Net working capital saw a slippage of 91 days YoY to 226 days.
Exhibit 16: Dehydrated Onions growth trend
Source: Company, MOSL
Exhibit 17: Fruit processing growth trend
Source: Company, MOSL
Exhibit 18: FP inventory days down 40 days YoY
Source: Company, MOSL
Exhibit 19: FP receivable days up 50 days YoY
Source: Company, MOSL
Exhibit 20: FP net working capital days increased by 91 days YoY
Source: Company, MOSL
495 439
172
920 652 616 272
74.9
8.9
-29.5
19.3
31.7 40.4
58.3
1QFY14
2QFY14
3QFY14
4QFY14
1QFY15
2QFY15
3QFY15
Onion Dehydration revenue (INR m) Rev. YoY
881 913 963 1,946 1300
802
1,200
-16.3
50.7 49.1
39.6 47.6
-12.2
24.6
1QFY14
2QFY14
3QFY14
4QFY14
1QFY15
2QFY15
3QFY15
Fruit Processing revenue (INR m) Rev. YoY
345
315
286
190
264 276
246
1QFY14 2QFY14 3QFY14 4QFY14 1QFY15 2QFY15 3QFY15
Inventory days
66 66
48
88 87
102 98
1QFY14 2QFY14 3QFY14 4QFY14 1QFY15 2QFY15 3QFY15
Debtor days (Gross)
162 155
135
78
176
195
226
1QFY14 2QFY14 3QFY14 4QFY14 1QFY15 2QFY15 3QFY15
Net Working Capital
11 February 2015 7
Jain Irrigation
Net working capital on consolidated basis improved by 7 days
n On a consolidated (C/L) basis net working capital reduced from 161 days to 154
days in 3QFY15 (158 days in 2QFY15).
Exhibit 21: C/L inventory days declined by 2 days YoY
Source: Company, MOSL
Exhibit 22: C/L receivable days declined by 23 days YoY
Source: Company, MOSL
Exhibit 23: C/L net working capital days declined by 7 days YoY
Source: Company, MOSL
137 135
126
104
119 121 124
1QFY14 2QFY14 3QFY14 4QFY14 1QFY15 2QFY15 3QFY15
Inventory days
137 141
123 129 122 115
106
1QFY14 2QFY14 3QFY14 4QFY14 1QFY15 2QFY15 3QFY15
Debtor days (Gross)
162
174
161
142 145
158 154
1QFY14 2QFY14 3QFY14 4QFY14 1QFY15 2QFY15 3QFY15
Net Working Capital
11 February 2015 8
Jain Irrigation
Consolidated debt to reduce by INR3b annually
n Consolidated Net debt for 3QFY15 stood at INR42.9b as against INR42.4b in
2QFY15, marking an increase of INR0.5b on a QoQ basis.
n On a YoY basis debt increased by INR0.9b from INR42b to INR42.9.
n Management is targeting to reduce debt by atleast INR3b annually over FY15-
17. Annual capex is expected to be contained at INR2b.
n SAFL has an outstanding loan book of INR1.35b and NPAs are expected to be
less than 1%. However, growth in new disbursements during the quarter was
not strong due to weak sentiments.
Exhibit 24: Standalone net debt
Source: Company, MOSL
Exhibit 25: Consolidated net debt
Source: Company, MOSL
Exhibit 26: Debt Equity to decline from 1.8x in FY15 to 1.3x in FY17
Source: Company, MOSL
29.9
30.8
31.1
28.2
29.4
31.6 31.7
1QFY14 2QFY14 3QFY14 4QFY14 1QFY15 2QFY15 3QFY15
Standalone Net Debt (INR b)
40.1
41.9 42
38.9
39.8
42.4
42.9
1QFY14 2QFY14 3QFY14 4QFY14 1QFY15 2QFY15 3QFY15
Consolidated Net Debt (INR b)
34,442
35,654
38,601 38,442
35,420
32,865
2.0
1.6
1.8 1.8 1.5
1.3
FY12 FY13 FY14 FY15E FY16E FY17E
Net Debt (INR m) Net DER (x)
11 February 2015 9
Jain Irrigation
Valuation and view
We value JI at a multiple of 12x FY17E EPS, (discount to long term average multiple
of 20x), which we believe is justified considering:
n India’s largest MIS player with a dominant market share of 55%
JI is the largest player in India's organized micro irrigation sector, with a dominant
market share of 55% and much higher than the second largest player Netafim (20%
market share). There remains immense potential for micro irrigation in India as out
of total irrigation potential of ~140 Mha and MIS potential of ~69.5 Mha, only 5 Mha
(~3.5% of the total irrigation potential) is covered under MIS currently, implying
significant growth potential over the long term. JI with its dominant market
leadership is best placed to capture this growth potential.
n Change in business model to drive de-leveraging
JI has changed its business model to ensure that the company is not exposed to
payment delays associated with subsidy receivables. Management is targeting to
reduce gross receivable days to 180 in FY15 and 120 in FY16 which should ensure
annual debt reduction of INR3b purely due to better working capital management.
Additionally, the company is looking to raise INR5b in FY16 from 25% stake sale in its
food processing business, proceeds of which would go towards further debt
retirement. We have not factored this scenario in our forecasts, which can
potentially reduce debt by another INR5b in FY16. We expect strong free cash
generation, which should reduce debt-equity from 1.8x to 1.3x over FY15-17E.
n Strong leadership in the high-growth food processing business
JI is India’s largest player in the food processing sector, with a market share of ~30%
and is the third largest in the world. Only 2% of India’s total produce is processed,
compared to ~60-80% in some developed countries (80% US and Malaysia). Also,
India's share in the global food trade is a miniscule 1.5%. Given the growing demand
for processed food, due to lifestyle changes and storage advantages, the segment is
expected to be a strong growth driver for the company.
Exhibit 27: 15-year PE band
Source: Company, MOSL
Exhibit 28: 15-year PB band
Source: Company, MOSL
We value the stock at 12x FY17E EPS and arrive at a target price of INR100 – 51%
upside. Maintain Buy rating.
11 February 2015 10
Jain Irrigation
Story in charts
Exhibit 29: JI is the market leader in MIS business in India
Source: Company, MOSL
Exhibit 30: MIS penetration in India is lowest in world
Source: Company, MOSL
Exhibit 31: Gross debtors set to decline
Source: Company, MOSL
Exhibit 32: Hence, debt to equity to decline from 1.8x to 1.3x
Source: Company, MOSL
Exhibit 33: Food processing is another key opportunity for JI
Source: Company, MOSL
Exhibit 34: RoE to improve
Source: Company, MOSL
55%
20%
25%
Jain Irrigation Netafim Others
Market share of key players in micro irrigation systems in India 90%
78%
65%
55% 52%
10%
3%
Israel Russia Spain US Brazil China India
MIS penetration across countries (%)
255
316
369
343 329
257
180
150 130
FY09 FY10 FY11 FY12 FY13 FY14 FY15E FY16E FY17E
Gross Sundry Debtors
34,442
35,654
38,601 38,442
35,420
32,865
2.0
1.6
1.8 1.8 1.5
1.3
FY12 FY13 FY14 FY15E FY16E FY17E
Net Debt (INR m) Net DER (x)
80% 80%
70%
30%
2%
USA Malaysia France Thailand India
% of food processing
13.5
2.4 3.1
2.2
9.0
15.2
FY12 FY13 FY14 FY15E FY16E FY17E
RoE (%)
11 February 2015 11
Jain Irrigation
Key assumptions
Exhibit 35: Key assumptions
FY12 FY13 FY14 FY15E FY16E FY17E
1. Micro Irrigation Systems 18,848 14,248 17,354 18,551 22,455 27,422
% growth (YoY) 11% -24% 22% 7% 21% 22%
% of net sales 38% 28% 30% 31% 32% 33%
EBITDA Margin % 30% 27% 22% 20% 21% 21%
2. Plastic Piping Systems 9,856 11,269 13,928 11,170 12,886 14,865
% growth (YoY) 4% 14% 24% -20% 15% 15%
% of net sales 20% 22% 24% 19% 18% 18%
EBITDA Margin % 7% 7% 5% 4% 6% 6%
3. PVC sheets 1,826 1,543 2,160 1,721 2,039 2,415
% growth (YoY) 30% -15% 40% -20% 18% 18%
% of net sales 4% 3% 4% 3% 3% 3%
EBITDA Margin % 7% 5% 5% 6% 6% 6%
4. Agro Processing 5,441 5,736 6,884 8,677 11,171 14,383
% growth (YoY) 23% 5% 20% 26% 29% 29%
% of net sales 11% 11% 12% 15% 16% 17%
EBITDA Margin % 20% 19% 17% 17% 18% 18%
5. Solar Systems 1,804 2,259 1,591 1,044 1,079 1,117
% growth (YoY) 130% 25% -30% -34% 3% 4%
% of net sales 4% 4% 3% 2% 2% 1%
EBIDTA margin 22% 18% 18% 18% 18% 18%
6. Tissue Culture Plants 457 699 874 898 1035 1193
% growth (YoY) 64% 53% 25% 3% 15% 15%
% of net sales 1% 1% 1% 2% 1% 1%
EBIDTA margin 22% 18% 18% 18% 18% 18%
7. Net Subsidiary Sales 11,351 15,058 16,950 17,628 20,096 22,508
% growth (YoY) 39% 33% 13% 4% 14% 12%
% of net sales 23% 30% 29% 30% 28% 27%
EBIDTA margin 7% 7% 7% 10% 10% 10%
Total Sales 49,206 50,217 58,344 59,761 70,678 83,820
Source: Company, MOSL
11 February 2015 12
Jain Irrigation
Financials and valuations
Consolidated - Income Statement (INR Million)
Y/E March FY10 FY11 FY12 FY13 FY14 FY15E FY16E FY17E
Net Sales 34,200 41,528 49,206 50,217 58,281 59,756 70,676 83,818
Change (%) 19.6 21.4 18.5 2.1 16.1 2.5 18.3 18.6
EBITDA 6,698 7,480 8,155 7,253 7,700 7,652 9,344 11,081
Margin (%) 19.6 18.0 16.6 14.4 13.2 12.8 13.2 13.2
Depreciation 1,020 1,222 1,441 1,696 2,045 2,455 2,563 2,692
EBIT 5,679 6,258 6,714 5,558 5,654 5,197 6,780 8,389
Int. and Finance Charges 2,194 3,270 4,768 4,855 4,676 4,789 4,495 3,969
Other Income - Rec. 197 1,106 345 668 463 179 212 251
PBT bef. EO Exp. 3,682 4,094 2,290 1,370 1,441 588 2,498 4,671
EO Expense/(Income) 0 0 0 1,245 2,300 712 0 0
PBT after EO Exp. 3,682 4,094 2,290 125 -860 -124 2,498 4,671
Current Tax 979 1,177 -419 175 233 -180 500 934
Deferred Tax 224 37 422 -95 -695 0 0 0
Tax Rate (%) 32.7 29.6 0.2 63.9 53.7 NM 20.0 20.0
Reported PAT 2,478 2,881 2,286 45 -398 56 1,998 3,737
PAT Adj for EO items 2,478 2,881 2,286 495 667 470 1,998 3,737
Change (%) 85.6 16.2 -20.6 -78.4 34.9 -29.5 325.0 87.0
Margin (%) 7.2 6.9 4.6 1.0 1.1 0.8 2.8 4.5
Consolidated - Balance Sheet (INR Million)
Y/E March (Rs mn) FY10 FY11 FY12 FY13 FY14 FY15E FY16E FY17E
Equity Share Capital 760 772 810 910 925 925 925 925
Equity Share Warrants 0 348 348 162 0 0 0 0
Total Reserves 11,384 14,439 16,378 20,608 20,831 20,562 22,127 25,322
Net Worth 12,167 15,558 17,537 21,680 21,755 21,486 23,052 26,247
Minority Interest 571 524 498 0 205 205 205 205
Deferred Liabilities 1,024 1,239 1,755 1,841 1,412 1,412 1,412 1,412
Total Loans 24,448 29,842 37,986 38,051 40,583 40,583 37,583 34,583
Capital Employed 38,210 47,164 57,775 61,572 63,955 63,686 62,251 62,447
Gross Block 23,266 28,467 33,528 37,726 41,514 44,621 46,921 49,221
Less: Accum. Deprn. 6,667 8,050 9,793 11,640 13,742 16,197 18,760 21,452
Net Fixed Assets 16,599 20,417 23,735 26,086 27,771 28,423 28,160 27,768
Capital WIP 1,324 956 1,980 749 807 0 0 0
Total Investments 211 211 236 38 14 14 14 14
Curr. Assets, Loans&Adv. 29,672 41,396 48,180 50,405 52,258 51,855 55,089 60,895
Inventory 10,638 14,864 14,614 17,231 18,364 18,742 21,872 25,985
Account Receivables 10,099 16,924 22,712 19,547 17,994 16,742 17,514 19,427
Cash and Bank Balance 5,053 4,144 3,308 2,359 1,968 2,127 2,149 1,704
Loans and Advances 3,883 5,463 7,546 11,269 13,932 14,243 13,554 13,778
Curr. Liability & Prov. 10,011 16,394 17,073 16,636 18,089 17,800 22,206 27,425
Account Payables 7,045 12,696 13,692 13,379 13,433 13,906 16,959 20,705
Other Current Liabilities 2,279 2,977 2,673 2,716 4,040 3,274 4,454 5,741
Provisions 687 720 708 541 617 620 794 978
Net Current Assets 19,662 25,002 31,107 33,770 34,169 34,054 32,883 33,470
Deferred Tax Assets 414 577 718 929 1,194 1,194 1,194 1,194
Appl. of Funds 38,210 47,164 57,775 61,572 63,955 63,686 62,251 62,447
E: MOSL Estimates
11 February 2015 13
Jain Irrigation
Financials and valuations
Ratios
Y/E March FY10 FY11 FY12 FY13 FY14 FY15E FY16E FY17E
Basic (INR)
EPS 6.5 7.5 5.6 1.1 1.4 1.0 4.3 8.1
Cash EPS 9.2 10.6 9.2 4.8 5.9 6.3 9.9 13.9
BV/Share 32.0 40.3 43.3 47.7 47.0 46.5 49.9 56.8
DPS 0.8 1.0 1.0 0.6 0.6 0.7 0.9 1.1
Payout (%) 16.3 15.6 20.6 588.3 -68.0 582.1 21.7 14.5
Valuation (x)
P/E 10.1 8.8 11.7 60.7 45.8 64.9 15.3 8.2
Cash P/E 7.2 6.2 7.2 13.7 11.3 10.4 6.7 4.7
P/BV 2.1 1.6 1.5 1.4 1.4 1.4 1.3 1.2
EV/Sales 1.5 1.4 1.3 1.3 1.2 1.2 0.9 0.8
EV/EBITDA 7.5 7.5 8.0 9.1 9.0 9.0 7.1 5.7
Dividend Yield (%) 1.3 1.4 1.5 0.9 0.9 1.0 1.4 1.7
Return Ratios (%)
RoE 23.3 20.2 13.5 2.4 3.1 2.2 9.0 15.2
RoCE 18.4 18.0 14.0 10.8 10.0 8.6 11.4 14.2
Working Capital Ratios
Inventory (Days) 113.5 130.6 108.4 125.2 115.0 114.5 113.0 113.2
Debtor (Days) 106 146 165 139 110 100 88 82
Leverage Ratio (x)
Current Ratio 3.0 2.5 2.8 3.0 2.9 2.9 2.5 2.2
Debt/Equity 2.0 1.9 2.2 1.8 1.9 1.9 1.6 1.3
Consolidated - Cash Flow Statement (INR Million)
Y/E March (Rs mn) FY10 FY11 FY12 FY13 FY14 FY15E FY16E FY17E
Net Profit / (Loss) Before Tax 3,682 4,094 2,286 125 -860 588 2,498 4,671
Depreciation 1,020 1,222 1,441 1,696 2,045 2,455 2,563 2,692
Interest & Finance Charges 2,194 2,717 4,157 4,855 4,676 4,610 4,283 3,718
Direct Taxes Paid 706 1,047 938 295 41 -180 500 934
(Inc)/Dec in WC -2,408 -6,069 -6,166 -3,127 -1,551 273 1,193 -1,032
CF from Operations 3,781 916 781 3,254 4,270 8,105 10,037 9,114
Others 151 143 69 1,021 1,461 -712 0 0
CF from Operating incl EO 3,932 1,059 850 4,275 5,731 7,393 10,037 9,114
(inc)/dec in FA -4,646 -4,930 -5,270 -2,943 -2,615 -2,300 -2,300 -2,300
Free Cash Flow -714 -3,871 -4,420 1,333 3,116 5,093 7,737 6,814
(Pur)/Sale of Investments -10 -142 -114 -459 -407 0 0 0
Others 87 64 55 20 138 179 212 251
CF from Investments -4,569 -5,007 -5,330 -3,383 -2,885 -2,121 -2,088 -2,049
Issue of Shares 435 780 14 3,903 0 0 0 0
(Inc)/Dec in Debt 6,693 5,507 8,143 -586 1,216 0 -3,000 -3,000
Interest Paid -2,232 -2,717 -4,051 -4,843 -4,638 -4,789 -4,495 -3,969
Dividend Paid -219 -355 -448 -469 -265 -325 -433 -541
Others -39 -62 16 162 485 0 0 0
CF from Fin. Activity 4,637 3,153 3,674 -1,832 -3,202 -5,114 -7,928 -7,510
Inc/Dec of Cash 4,000 -796 -805 -939 -356 159 22 -444
Add: Beginning Balance 1,053 4,940 4,114 3,298 2,324 1,968 2,127 2,149
Closing Balance 5,053 4,144 3,308 2,359 1,968 2,127 2,149 1,704
11 February 2015 14
Jain Irrigation
Corporate profile: Jain Irrigation
Exhibit 37: Shareholding pattern (%)
Dec-14 Sep-14 Dec-13
Promoter 28.7 28.7 27.5
DII 2.7 3.3 1.6
FII 44.9 48.0 53.0
Others 23.7 20.1 18.0
Note: FII Includes depository receipts
Exhibit 38: Top holders
Holder Name % Holding
MKCP Institutional Investor (Mauritius) II Ltd 7.9
International Finance Corporation 3.0
Templeton Funds -Templeton Foreign Fund 2.5
Macquarie Bank Ltd 2.3
Shivanand Shankar Mankekar 1.9
Exhibit 39: Top management
Name Designation
Bhavarlal H Jain Chairman
Ashok B Jain Vice Chairman
Anil B Jain Managing Director
Ajit B jain Joint Managing Director
Atul Bhavarlal Jain Joint Managing Director
Exhibit 40: Directors
Name Name
Bhavarlal H Jain Vasant V Warty*
Ashok B Jain Ghanshyam Dass*
Anil B Jain Arun Kumar Jain*
Ajit B jain Radhika C Pereira*
Atul Bhavarlal Jain R Swaminathan
D R Mehta* H P Singh
*Independent
Exhibit 41: Auditors
Name Type
Haribhakti & Co Statutory
Ernst & Young Internal
Exhibit 42: MOSL forecast v/s consensus
EPS
(INR)
MOSL
forecast
Consensus
forecast
Variation
(%)
FY15 1.0 3.0 -65.6
FY16 4.3 8.3 -48.1
FY17 8.1 9.6 -15.5
Company description
Established in 1986, JI is a transnational
organization headquartered at Jalgaon,
Maharashtra, India. JI employs over 5,000
associates and manufactures a number of
products, including drip and sprinkler irrigation
systems, PVC & PE piping systems, plastic sheets,
green houses, bio-fertilizers, solar products
including water-heating systems, photovoltaic
appliances and solar pumps. JI processes fruits and
vegetables into aseptic concentrates, frozen fruits
and dehydrated vegetables, respectively. It has 21
manufacturing plants spread over 5 continents and
its products are supplied to 110 countries through
3,000 dealers and distributors worldwide.
Exhibit 36: Sensex rebased
11 February 2015 15
Jain Irrigation
N O T E S
11 February 2015 16
Jain Irrigation
Disclosures
This document has been prepared by Motilal Oswal Securities Limited (hereinafter referred to as Most) to provide information about the company(ies) and/sector(s), if any, covered in the report and may be
distributed by it and/or its affiliated company(ies). This report is for personal information of the selected recipient/s and does not construe to be any investment, legal or taxation advice to you. This research report does
not constitute an offer, invitation or inducement to invest in securities or other investments and Motilal Oswal Securities Limited (hereinafter referred as MOSt) is not soliciting any action based upon it. This report is not
for public distribution and has been furnished to you solely for your general information and should not be reproduced or redistributed to any other person in any form. This report does not constitute a personal
recommendation or take into account the particular investment objectives, financial situations, or needs of individual clients. Before acting on any advice or recommendation in this material, investors should consider
whether it is suitable for their particular circumstances and, if necessary, seek professional advice. The price and value of the investments referred to in this material and the income from them may go down as well as
up, and investors may realize losses on any investments. Past performance is not a guide for future performance, future returns are not guaranteed and a loss of original capital may occur.
MOSt and its affiliates are a full-service, integrated investment banking, investment management, brokerage and financing group. We and our affiliates have investment banking and other business relationships with a
some companies covered by our Research Department. Our research professionals may provide input into our investment banking and other business selection processes. Investors should assume that MOSt and/or
its affiliates are seeking or will seek investment banking or other business from the company or companies that are the subject of this material and that the research professionals who were involved in preparing this
material may educate investors on investments in such business. The research professionals responsible for the preparation of this document may interact with trading desk personnel, sales personnel and other
parties for the purpose of gathering, applying and interpreting information. Our research professionals are paid on the profitability of MOSt which may include earnings from investment banking and other business.
MOSt generally prohibits its analysts, persons reporting to analysts, and members of their households from maintaining a financial interest in the securities or derivatives of any companies that the analysts cover.
Additionally, MOSt generally prohibits its analysts and persons reporting to analysts from serving as an officer, director, or advisory board member of any companies that the analysts cover. Our salespeople, traders,
and other professionals or affiliates may provide oral or written market commentary or trading strategies to our clients that reflect opinions that are contrary to the opinions expressed herein, and our proprietary
trading and investing businesses may make investment decisions that are inconsistent with the recommendations expressed herein. In reviewing these materials, you should be aware that any or all of the foregoing
among other things, may give rise to real or potential conflicts of interest. MOSt and its affiliated company(ies), their directors and employees and their relatives may; (a) from time to time, have a long or short position
in, act as principal in, and buy or sell the securities or derivatives thereof of companies mentioned herein. (b) be engaged in any other transaction involving such securities and earn brokerage or other compensation
or act as a market maker in the financial instruments of the company(ies) discussed herein or act as an advisor or lender/borrower to such company(ies) or may have any other potential conflict of interests with
respect to any recommendation and other related information and opinions.; however the same shall have no bearing whatsoever on the specific recommendations made by the analyst(s), as the recommendations
made by the analyst(s) are completely independent of the views of the affiliates of MOSt even though there might exist an inherent conflict of interest in some of the stocks mentioned in the research report
Reports based on technical and derivative analysis center on studying charts company's price movement, outstanding positions and trading volume, as opposed to focusing on a company's fundamentals and, as
such, may not match with a report on a company's fundamental analysis. In addition MOST has different business segments / Divisions with independent research separated by Chinese walls catering to different set
of customers having various objectives, risk profiles, investment horizon, etc, and therefore may at times have different contrary views on stocks sectors and markets.
Unauthorized disclosure, use, dissemination or copying (either whole or partial) of this information, is prohibited. The person accessing this information specifically agrees to exempt MOSt or any of its affiliates or
employees from, any and all responsibility/liability arising from such misuse and agrees not to hold MOSt or any of its affiliates or employees responsible for any such misuse and further agrees to hold MOSt or any of
its affiliates or employees free and harmless from all losses, costs, damages, expenses that may be suffered by the person accessing this information due to any errors and delays. The information contained herein is
based on publicly available data or other sources believed to be reliable. Any statements contained in this report attributed to a third party represent MOSt’s interpretation of the data, information and/or opinions
provided by that third party either publicly or through a subscription service, and such use and interpretation have not been reviewed by the third party. This Report is not intended to be a complete statement or
summary of the securities, markets or developments referred to in the document. While we would endeavor to update the information herein on reasonable basis, MOSt and/or its affiliates are under no obligation to
update the information. Also there may be regulatory, compliance, or other reasons that may prevent MOSt and/or its affiliates from doing so. MOSt or any of its affiliates or employees shall not be in any way
responsible and liable for any loss or damage that may arise to any person from any inadvertent error in the information contained in this report. MOSt or any of its affiliates or employees do not provide, at any time,
any express or implied warranty of any kind, regarding any matter pertaining to this report, including without limitation the implied warranties of merchantability, fitness for a particular purpose, and non-infringement.
The recipients of this report should rely on their own investigations.
This report is intended for distribution to institutional investors. Recipients who are not institutional investors should seek advice of their independent financial advisor prior to taking any investment decision based on
this report or for any necessary explanation of its contents.
Most and it’s associates may have managed or co-managed public offering of securities, may have received compensation for investment banking or merchant banking or brokerage services, may have received any
compensation for products or services other than investment banking or merchant banking or brokerage services from the subject company in the past 12 months.
Most and it’s associates have not received any compensation or other benefits from the subject company or third party in connection with the research report.
Subject Company may have been a client of Most or its associates during twelve months preceding the date of distribution of the research report
MOSt and/or its affiliates and/or employees may have interests/positions, financial or otherwise of over 1 % at the end of the month immediately preceding the date of publication of the research in the securities
mentioned in this report. To enhance transparency, MOSt has incorporated a Disclosure of Interest Statement in this document. This should, however, not be treated as endorsement of the views expressed in the
report.
Motilal Oswal Securities Limited is under the process of seeking registration under SEBI (Research Analyst) Regulations, 2014.
There are no material disciplinary action that been taken by any regulatory authority impacting equity research analysis activities
Analyst Certification
The views expressed in this research report accurately reflect the personal views of the analyst(s) about the subject securities or issues, and no part of the compensation of the research analyst(s) was, is, or will be
directly or indirectly related to the specific recommendations and views expressed by research analyst(s) in this report. The research analysts, strategists, or research associates principally responsible for preparation
of MOSt research receive compensation based upon various factors, including quality of research, investor client feedback, stock picking, competitive factors and firm revenues
Disclosure of Interest Statement JAIN IRRIGATION
§ Analyst ownership of the stock No
§ Served as an officer, director or employee No
Regional Disclosures (outside India)
This report is not directed or intended for distribution to or use by any person or entity resident in a state, country or any jurisdiction, where such distribution, publication, availability or use would be contrary to law,
regulation or which would subject MOSt & its group companies to registration or licensing requirements within such jurisdictions.
For U.S.
Motilal Oswal Securities Limited (MOSL) is not a registered broker - dealer under the U.S. Securities Exchange Act of 1934, as amended (the"1934 act") and under applicable state laws in the United States. In
addition MOSL is not a registered investment adviser under the U.S. Investment Advisers Act of 1940, as amended (the "Advisers Act" and together with the 1934 Act, the "Acts), and under applicable state laws in the
United States. Accordingly, in the absence of specific exemption under the Acts, any brokerage and investment services provided by MOSL, including the products and services described herein are not available to or
intended for U.S. persons.
This report is intended for distribution only to "Major Institutional Investors" as defined by Rule 15a-6(b)(4) of the Exchange Act and interpretations thereof by SEC (henceforth referred to as "major institutional
investors"). This document must not be acted on or relied on by persons who are not major institutional investors. Any investment or investment activity to which this document relates is only available to major
institutional investors and will be engaged in only with major institutional investors. In reliance on the exemption from registration provided by Rule 15a-6 of the U.S. Securities Exchange Act of 1934, as amended (the
"Exchange Act") and interpretations thereof by the U.S. Securities and Exchange Commission ("SEC") in order to conduct business with Institutional Investors based in the U.S., MOSL has entered into a chaperoning
agreement with a U.S. registered broker-dealer, Motilal Oswal Securities International Private Limited. ("MOSIPL"). Any business interaction pursuant to this report will have to be executed within the provisions of this
chaperoning agreement.
The Research Analysts contributing to the report may not be registered /qualified as research analyst with FINRA. Such research analyst may not be associated persons of the U.S. registered broker-dealer, MOSIPL,
and therefore, may not be subject to NASD rule 2711 and NYSE Rule 472 restrictions on communication with a subject company, public appearances and trading securities held by a research analyst account.
For Singapore
Motilal Oswal Capital Markets Singapore Pte Limited is acting as an exempt financial advisor under section 23(1)(f) of the Financial Advisers Act(FAA) read with regulation 17(1)(d) of the Financial Advisors
Regulations and is a subsidiary of Motilal Oswal Securities Limited in India. This research is distributed in Singapore by Motilal Oswal Capital Markets Singapore Pte Limited and it is only directed in Singapore to
accredited investors, as defined in the Financial Advisers Regulations and the Securities and Futures Act (Chapter 289), as amended from time to time.
In respect of any matter arising from or in connection with the research you could contact the following representatives of Motilal Oswal Capital Markets Singapore Pte Limited:
Anosh Koppikar Kadambari Balachandran
Email : anosh.Koppikar@motilaloswal.com Email : kadambari.balachandran@motilaloswal.com
Contact : (+65)68189232 Contact : (+65) 68189233 / 65249115
Office Address : 21 (Suite 31),16 Collyer Quay,Singapore 04931
Motilal Oswal Securities Ltd
Motilal Oswal Tower, Level 9, Sayani Road, Prabhadevi, Mumbai 400 025
Phone: +91 22 3982 5500 E-mail: reports@motilaloswal.com

Weitere ähnliche Inhalte

Was ist angesagt?

India Equity Analytics | Buy Stock of Sobha Developers Ltd and Suprajit Engin...
India Equity Analytics | Buy Stock of Sobha Developers Ltd and Suprajit Engin...India Equity Analytics | Buy Stock of Sobha Developers Ltd and Suprajit Engin...
India Equity Analytics | Buy Stock of Sobha Developers Ltd and Suprajit Engin...NARNOLIA SECURITIES LIMITED
 
Buy DB Corp at a target of Rs410
Buy DB Corp at a target of Rs410Buy DB Corp at a target of Rs410
Buy DB Corp at a target of Rs410IndiaNotes.com
 
IndiaNivesh maintain 'buy' on this textile scrip with upgraded target after Q...
IndiaNivesh maintain 'buy' on this textile scrip with upgraded target after Q...IndiaNivesh maintain 'buy' on this textile scrip with upgraded target after Q...
IndiaNivesh maintain 'buy' on this textile scrip with upgraded target after Q...IndiaNotes.com
 
IndusInd Bank delivers strong set of numbers in Q4; Accumulate
IndusInd Bank delivers strong set of numbers in Q4; AccumulateIndusInd Bank delivers strong set of numbers in Q4; Accumulate
IndusInd Bank delivers strong set of numbers in Q4; AccumulateIndiaNotes.com
 
Intellect 1QFY18
Intellect 1QFY18Intellect 1QFY18
Intellect 1QFY18Mohit Jn
 
SMS CO., LTD. FY03-16 3Q Presentation material for IR
SMS CO., LTD. FY03-16 3Q Presentation material for IR SMS CO., LTD. FY03-16 3Q Presentation material for IR
SMS CO., LTD. FY03-16 3Q Presentation material for IR smsir
 
Dabur India Q1FY15: Maintain neutral
 Dabur India Q1FY15: Maintain neutral Dabur India Q1FY15: Maintain neutral
Dabur India Q1FY15: Maintain neutralIndiaNotes.com
 
Torrent i sec (1)
Torrent i sec (1)Torrent i sec (1)
Torrent i sec (1)Jigar Savla
 
Sobha Developers Q4FY14: Buy for an upgraded target price of Rs540 - Motilal ...
Sobha Developers Q4FY14: Buy for an upgraded target price of Rs540 - Motilal ...Sobha Developers Q4FY14: Buy for an upgraded target price of Rs540 - Motilal ...
Sobha Developers Q4FY14: Buy for an upgraded target price of Rs540 - Motilal ...IndiaNotes.com
 
Market Outlook Post Union Budget 2017-18
Market Outlook Post Union Budget 2017-18Market Outlook Post Union Budget 2017-18
Market Outlook Post Union Budget 2017-18SBI Mutual Fund
 
ICICI Prudential Growth Fund - Series 1 (Presentation)
ICICI Prudential Growth Fund - Series 1 (Presentation)ICICI Prudential Growth Fund - Series 1 (Presentation)
ICICI Prudential Growth Fund - Series 1 (Presentation)iciciprumf
 
Entertainment Network Ltd: Stock Price & Q4 Results Of Entertainment Network ...
Entertainment Network Ltd: Stock Price & Q4 Results Of Entertainment Network ...Entertainment Network Ltd: Stock Price & Q4 Results Of Entertainment Network ...
Entertainment Network Ltd: Stock Price & Q4 Results Of Entertainment Network ...hdfcsecurities1
 
Market outlook 28 10 10
Market outlook 28 10 10Market outlook 28 10 10
Market outlook 28 10 10Angel Broking
 
Weekly media update 22.06.2015
Weekly media update 22.06.2015Weekly media update 22.06.2015
Weekly media update 22.06.2015BalmerLawrie
 
AxisBank‬ Ltd.Q2 FY16 Result Analysis
AxisBank‬ Ltd.Q2 FY16 Result AnalysisAxisBank‬ Ltd.Q2 FY16 Result Analysis
AxisBank‬ Ltd.Q2 FY16 Result Analysischoice broking
 
IT Sector Preview - Q2FY15 - HDFC Sec
IT Sector Preview - Q2FY15 - HDFC SecIT Sector Preview - Q2FY15 - HDFC Sec
IT Sector Preview - Q2FY15 - HDFC SecIndiaNotes.com
 
Special report-25-october-2018-epic-research
Special report-25-october-2018-epic-researchSpecial report-25-october-2018-epic-research
Special report-25-october-2018-epic-researchEpic Research Limited
 
Weekly media update 11 11_2019
Weekly media update 11 11_2019Weekly media update 11 11_2019
Weekly media update 11 11_2019BalmerLawrie
 

Was ist angesagt? (20)

Bata india
Bata indiaBata india
Bata india
 
India Equity Analytics | Buy Stock of Sobha Developers Ltd and Suprajit Engin...
India Equity Analytics | Buy Stock of Sobha Developers Ltd and Suprajit Engin...India Equity Analytics | Buy Stock of Sobha Developers Ltd and Suprajit Engin...
India Equity Analytics | Buy Stock of Sobha Developers Ltd and Suprajit Engin...
 
Buy DB Corp at a target of Rs410
Buy DB Corp at a target of Rs410Buy DB Corp at a target of Rs410
Buy DB Corp at a target of Rs410
 
IndiaNivesh maintain 'buy' on this textile scrip with upgraded target after Q...
IndiaNivesh maintain 'buy' on this textile scrip with upgraded target after Q...IndiaNivesh maintain 'buy' on this textile scrip with upgraded target after Q...
IndiaNivesh maintain 'buy' on this textile scrip with upgraded target after Q...
 
IndusInd Bank delivers strong set of numbers in Q4; Accumulate
IndusInd Bank delivers strong set of numbers in Q4; AccumulateIndusInd Bank delivers strong set of numbers in Q4; Accumulate
IndusInd Bank delivers strong set of numbers in Q4; Accumulate
 
Intellect 1QFY18
Intellect 1QFY18Intellect 1QFY18
Intellect 1QFY18
 
SMS CO., LTD. FY03-16 3Q Presentation material for IR
SMS CO., LTD. FY03-16 3Q Presentation material for IR SMS CO., LTD. FY03-16 3Q Presentation material for IR
SMS CO., LTD. FY03-16 3Q Presentation material for IR
 
Dabur India Q1FY15: Maintain neutral
 Dabur India Q1FY15: Maintain neutral Dabur India Q1FY15: Maintain neutral
Dabur India Q1FY15: Maintain neutral
 
Torrent i sec (1)
Torrent i sec (1)Torrent i sec (1)
Torrent i sec (1)
 
Sobha Developers Q4FY14: Buy for an upgraded target price of Rs540 - Motilal ...
Sobha Developers Q4FY14: Buy for an upgraded target price of Rs540 - Motilal ...Sobha Developers Q4FY14: Buy for an upgraded target price of Rs540 - Motilal ...
Sobha Developers Q4FY14: Buy for an upgraded target price of Rs540 - Motilal ...
 
Market Outlook Post Union Budget 2017-18
Market Outlook Post Union Budget 2017-18Market Outlook Post Union Budget 2017-18
Market Outlook Post Union Budget 2017-18
 
ICICI Prudential Growth Fund - Series 1 (Presentation)
ICICI Prudential Growth Fund - Series 1 (Presentation)ICICI Prudential Growth Fund - Series 1 (Presentation)
ICICI Prudential Growth Fund - Series 1 (Presentation)
 
Entertainment Network Ltd: Stock Price & Q4 Results Of Entertainment Network ...
Entertainment Network Ltd: Stock Price & Q4 Results Of Entertainment Network ...Entertainment Network Ltd: Stock Price & Q4 Results Of Entertainment Network ...
Entertainment Network Ltd: Stock Price & Q4 Results Of Entertainment Network ...
 
Stocks
StocksStocks
Stocks
 
Market outlook 28 10 10
Market outlook 28 10 10Market outlook 28 10 10
Market outlook 28 10 10
 
Weekly media update 22.06.2015
Weekly media update 22.06.2015Weekly media update 22.06.2015
Weekly media update 22.06.2015
 
AxisBank‬ Ltd.Q2 FY16 Result Analysis
AxisBank‬ Ltd.Q2 FY16 Result AnalysisAxisBank‬ Ltd.Q2 FY16 Result Analysis
AxisBank‬ Ltd.Q2 FY16 Result Analysis
 
IT Sector Preview - Q2FY15 - HDFC Sec
IT Sector Preview - Q2FY15 - HDFC SecIT Sector Preview - Q2FY15 - HDFC Sec
IT Sector Preview - Q2FY15 - HDFC Sec
 
Special report-25-october-2018-epic-research
Special report-25-october-2018-epic-researchSpecial report-25-october-2018-epic-research
Special report-25-october-2018-epic-research
 
Weekly media update 11 11_2019
Weekly media update 11 11_2019Weekly media update 11 11_2019
Weekly media update 11 11_2019
 

Ähnlich wie Jain Irrigation 3QFY15 Results Update: Weak Agri Sector Impacts Revenue; Recovery Expected in FY16

Arvnd 20150205-mosl-ru-pg014
Arvnd 20150205-mosl-ru-pg014Arvnd 20150205-mosl-ru-pg014
Arvnd 20150205-mosl-ru-pg014Jigar Savla
 
Q3FY15: Buy PTC India for upside 22%, target price 109
Q3FY15: Buy PTC India for upside 22%, target price 109Q3FY15: Buy PTC India for upside 22%, target price 109
Q3FY15: Buy PTC India for upside 22%, target price 109IndiaNotes.com
 
Dabur Q3FY15: Mixed quarter; maintain neutral
 Dabur Q3FY15: Mixed quarter; maintain neutral Dabur Q3FY15: Mixed quarter; maintain neutral
Dabur Q3FY15: Mixed quarter; maintain neutralIndiaNotes.com
 
Crompton Greaves 3QFY15 performance remains a mixed bag; buy
Crompton Greaves 3QFY15 performance remains a mixed bag; buyCrompton Greaves 3QFY15 performance remains a mixed bag; buy
Crompton Greaves 3QFY15 performance remains a mixed bag; buyIndiaNotes.com
 
IndiaNivesh maintains positive stance on this ceramic stock; Hold
IndiaNivesh maintains positive stance on this ceramic stock; HoldIndiaNivesh maintains positive stance on this ceramic stock; Hold
IndiaNivesh maintains positive stance on this ceramic stock; HoldIndiaNotes.com
 
Bharti Airtel 1QFY15 revenue above estimates; buy
 Bharti Airtel 1QFY15 revenue above estimates; buy Bharti Airtel 1QFY15 revenue above estimates; buy
Bharti Airtel 1QFY15 revenue above estimates; buyIndiaNotes.com
 
JK Cement Q1FY15: Buy for a target of Rs520
 JK Cement Q1FY15: Buy for a target of Rs520 JK Cement Q1FY15: Buy for a target of Rs520
JK Cement Q1FY15: Buy for a target of Rs520IndiaNotes.com
 
Mahindra Financial result update: 4QFY15 PAT up 7% YoY and 144% QoQ
Mahindra Financial result update: 4QFY15 PAT up 7% YoY and 144% QoQMahindra Financial result update: 4QFY15 PAT up 7% YoY and 144% QoQ
Mahindra Financial result update: 4QFY15 PAT up 7% YoY and 144% QoQIndiaNotes.com
 
ING Vyasa Bank Q2FY14 Result: Maintain neutral
ING Vyasa Bank Q2FY14 Result: Maintain neutralING Vyasa Bank Q2FY14 Result: Maintain neutral
ING Vyasa Bank Q2FY14 Result: Maintain neutralIndiaNotes.com
 
Q2FY15: Hold Mahindra & Mahindra Financial Services - Nirmal Bang
Q2FY15: Hold Mahindra & Mahindra Financial Services - Nirmal BangQ2FY15: Hold Mahindra & Mahindra Financial Services - Nirmal Bang
Q2FY15: Hold Mahindra & Mahindra Financial Services - Nirmal BangIndiaNotes.com
 
Choice Broking Research-UltraTech Cement.
 Choice Broking Research-UltraTech Cement. Choice Broking Research-UltraTech Cement.
Choice Broking Research-UltraTech Cement.choice broking
 
Bajaj Finance Q1FY15: AUM growth remained strong at Rs269.4 bn, buy
Bajaj Finance Q1FY15: AUM growth remained strong at Rs269.4 bn, buyBajaj Finance Q1FY15: AUM growth remained strong at Rs269.4 bn, buy
Bajaj Finance Q1FY15: AUM growth remained strong at Rs269.4 bn, buyIndiaNotes.com
 
Indian Bank Q1FY15: Buy for a target of Rs230
 Indian Bank Q1FY15: Buy for a target of Rs230 Indian Bank Q1FY15: Buy for a target of Rs230
Indian Bank Q1FY15: Buy for a target of Rs230IndiaNotes.com
 
Bajaj Finance: Strong growth momentum; hold
Bajaj Finance: Strong growth momentum; holdBajaj Finance: Strong growth momentum; hold
Bajaj Finance: Strong growth momentum; holdIndiaNotes.com
 
Shriram Transport Finance Company Q1FY15: Buy for a target of Rs1130
 Shriram Transport Finance Company Q1FY15: Buy for a target of Rs1130 Shriram Transport Finance Company Q1FY15: Buy for a target of Rs1130
Shriram Transport Finance Company Q1FY15: Buy for a target of Rs1130IndiaNotes.com
 
Macro Economic and Banking
Macro Economic and BankingMacro Economic and Banking
Macro Economic and BankingBFSICM
 
Bajaj Electricals Q1Y15: Growth in line; margins below expectation
 Bajaj Electricals Q1Y15: Growth in line; margins below expectation Bajaj Electricals Q1Y15: Growth in line; margins below expectation
Bajaj Electricals Q1Y15: Growth in line; margins below expectationIndiaNotes.com
 
Stock Advisory for Today - Natural View on the Stock JSW Steel LTD, Marico a...
Stock Advisory for Today -  Natural View on the Stock JSW Steel LTD, Marico a...Stock Advisory for Today -  Natural View on the Stock JSW Steel LTD, Marico a...
Stock Advisory for Today - Natural View on the Stock JSW Steel LTD, Marico a...NARNOLIA SECURITIES LIMITED
 

Ähnlich wie Jain Irrigation 3QFY15 Results Update: Weak Agri Sector Impacts Revenue; Recovery Expected in FY16 (20)

Arvnd 20150205-mosl-ru-pg014
Arvnd 20150205-mosl-ru-pg014Arvnd 20150205-mosl-ru-pg014
Arvnd 20150205-mosl-ru-pg014
 
Q3FY15: Buy PTC India for upside 22%, target price 109
Q3FY15: Buy PTC India for upside 22%, target price 109Q3FY15: Buy PTC India for upside 22%, target price 109
Q3FY15: Buy PTC India for upside 22%, target price 109
 
Dabur Q3FY15: Mixed quarter; maintain neutral
 Dabur Q3FY15: Mixed quarter; maintain neutral Dabur Q3FY15: Mixed quarter; maintain neutral
Dabur Q3FY15: Mixed quarter; maintain neutral
 
Crompton Greaves 3QFY15 performance remains a mixed bag; buy
Crompton Greaves 3QFY15 performance remains a mixed bag; buyCrompton Greaves 3QFY15 performance remains a mixed bag; buy
Crompton Greaves 3QFY15 performance remains a mixed bag; buy
 
BHAFIN 1QFY18
BHAFIN 1QFY18BHAFIN 1QFY18
BHAFIN 1QFY18
 
IndiaNivesh maintains positive stance on this ceramic stock; Hold
IndiaNivesh maintains positive stance on this ceramic stock; HoldIndiaNivesh maintains positive stance on this ceramic stock; Hold
IndiaNivesh maintains positive stance on this ceramic stock; Hold
 
Bharti Airtel 1QFY15 revenue above estimates; buy
 Bharti Airtel 1QFY15 revenue above estimates; buy Bharti Airtel 1QFY15 revenue above estimates; buy
Bharti Airtel 1QFY15 revenue above estimates; buy
 
JK Cement Q1FY15: Buy for a target of Rs520
 JK Cement Q1FY15: Buy for a target of Rs520 JK Cement Q1FY15: Buy for a target of Rs520
JK Cement Q1FY15: Buy for a target of Rs520
 
Mahindra Financial result update: 4QFY15 PAT up 7% YoY and 144% QoQ
Mahindra Financial result update: 4QFY15 PAT up 7% YoY and 144% QoQMahindra Financial result update: 4QFY15 PAT up 7% YoY and 144% QoQ
Mahindra Financial result update: 4QFY15 PAT up 7% YoY and 144% QoQ
 
ING Vyasa Bank Q2FY14 Result: Maintain neutral
ING Vyasa Bank Q2FY14 Result: Maintain neutralING Vyasa Bank Q2FY14 Result: Maintain neutral
ING Vyasa Bank Q2FY14 Result: Maintain neutral
 
Q2FY15: Hold Mahindra & Mahindra Financial Services - Nirmal Bang
Q2FY15: Hold Mahindra & Mahindra Financial Services - Nirmal BangQ2FY15: Hold Mahindra & Mahindra Financial Services - Nirmal Bang
Q2FY15: Hold Mahindra & Mahindra Financial Services - Nirmal Bang
 
Choice Broking Research-UltraTech Cement.
 Choice Broking Research-UltraTech Cement. Choice Broking Research-UltraTech Cement.
Choice Broking Research-UltraTech Cement.
 
Bajaj Finance Q1FY15: AUM growth remained strong at Rs269.4 bn, buy
Bajaj Finance Q1FY15: AUM growth remained strong at Rs269.4 bn, buyBajaj Finance Q1FY15: AUM growth remained strong at Rs269.4 bn, buy
Bajaj Finance Q1FY15: AUM growth remained strong at Rs269.4 bn, buy
 
Indian Bank Q1FY15: Buy for a target of Rs230
 Indian Bank Q1FY15: Buy for a target of Rs230 Indian Bank Q1FY15: Buy for a target of Rs230
Indian Bank Q1FY15: Buy for a target of Rs230
 
Bajaj Finance: Strong growth momentum; hold
Bajaj Finance: Strong growth momentum; holdBajaj Finance: Strong growth momentum; hold
Bajaj Finance: Strong growth momentum; hold
 
TCS: Maintain neutral
TCS: Maintain neutralTCS: Maintain neutral
TCS: Maintain neutral
 
Shriram Transport Finance Company Q1FY15: Buy for a target of Rs1130
 Shriram Transport Finance Company Q1FY15: Buy for a target of Rs1130 Shriram Transport Finance Company Q1FY15: Buy for a target of Rs1130
Shriram Transport Finance Company Q1FY15: Buy for a target of Rs1130
 
Macro Economic and Banking
Macro Economic and BankingMacro Economic and Banking
Macro Economic and Banking
 
Bajaj Electricals Q1Y15: Growth in line; margins below expectation
 Bajaj Electricals Q1Y15: Growth in line; margins below expectation Bajaj Electricals Q1Y15: Growth in line; margins below expectation
Bajaj Electricals Q1Y15: Growth in line; margins below expectation
 
Stock Advisory for Today - Natural View on the Stock JSW Steel LTD, Marico a...
Stock Advisory for Today -  Natural View on the Stock JSW Steel LTD, Marico a...Stock Advisory for Today -  Natural View on the Stock JSW Steel LTD, Marico a...
Stock Advisory for Today - Natural View on the Stock JSW Steel LTD, Marico a...
 

Mehr von IndiaNotes.com

Fce glaxo smithkline_12aug15
Fce glaxo smithkline_12aug15Fce glaxo smithkline_12aug15
Fce glaxo smithkline_12aug15IndiaNotes.com
 
GSK Consumer: Horlicks strengthens its position as No.1 brand across India
GSK Consumer: Horlicks strengthens its position as No.1 brand across IndiaGSK Consumer: Horlicks strengthens its position as No.1 brand across India
GSK Consumer: Horlicks strengthens its position as No.1 brand across IndiaIndiaNotes.com
 
Hester Biosciences gets manufacturing licence for 2 additional poultry vaccines
Hester Biosciences gets manufacturing licence for 2 additional poultry vaccinesHester Biosciences gets manufacturing licence for 2 additional poultry vaccines
Hester Biosciences gets manufacturing licence for 2 additional poultry vaccinesIndiaNotes.com
 
Vidhi Dyestuffs: To keep its growth story in the coming quarters also
Vidhi Dyestuffs: To keep its growth story in the coming quarters alsoVidhi Dyestuffs: To keep its growth story in the coming quarters also
Vidhi Dyestuffs: To keep its growth story in the coming quarters alsoIndiaNotes.com
 
Apollo Tyres approves further expansion of the Truck & Bus radial tyre capacity
Apollo Tyres approves further expansion of the Truck & Bus radial tyre capacityApollo Tyres approves further expansion of the Truck & Bus radial tyre capacity
Apollo Tyres approves further expansion of the Truck & Bus radial tyre capacityIndiaNotes.com
 
Grasim Industries reports improved performance in Q1FY16
Grasim Industries reports improved performance in Q1FY16Grasim Industries reports improved performance in Q1FY16
Grasim Industries reports improved performance in Q1FY16IndiaNotes.com
 
Cummins India: No interest burden being free from long-term or short-term debt
Cummins India: No interest burden being free from long-term or short-term debtCummins India: No interest burden being free from long-term or short-term debt
Cummins India: No interest burden being free from long-term or short-term debtIndiaNotes.com
 
Buy Makers Laboratories, company growing rapidly with strong thrust on brande...
Buy Makers Laboratories, company growing rapidly with strong thrust on brande...Buy Makers Laboratories, company growing rapidly with strong thrust on brande...
Buy Makers Laboratories, company growing rapidly with strong thrust on brande...IndiaNotes.com
 
Buy Multibase India, globalisation of the auto component sector to benefit th...
Buy Multibase India, globalisation of the auto component sector to benefit th...Buy Multibase India, globalisation of the auto component sector to benefit th...
Buy Multibase India, globalisation of the auto component sector to benefit th...IndiaNotes.com
 
Capital First: Long-term credit rating is rated highly at AA+ by CARE
Capital First: Long-term credit rating is rated highly at AA+ by CARECapital First: Long-term credit rating is rated highly at AA+ by CARE
Capital First: Long-term credit rating is rated highly at AA+ by CAREIndiaNotes.com
 
Orient Cement: Best placed to benefit from demand revival in AP & Telengana r...
Orient Cement: Best placed to benefit from demand revival in AP & Telengana r...Orient Cement: Best placed to benefit from demand revival in AP & Telengana r...
Orient Cement: Best placed to benefit from demand revival in AP & Telengana r...IndiaNotes.com
 
Canara Bank's operating performance to improve in remaining 9MFY16E
Canara Bank's operating performance to improve in remaining 9MFY16ECanara Bank's operating performance to improve in remaining 9MFY16E
Canara Bank's operating performance to improve in remaining 9MFY16EIndiaNotes.com
 
Buy Jenburkt Pharmaceuticals; government's amended FDI policy to cover medica...
Buy Jenburkt Pharmaceuticals; government's amended FDI policy to cover medica...Buy Jenburkt Pharmaceuticals; government's amended FDI policy to cover medica...
Buy Jenburkt Pharmaceuticals; government's amended FDI policy to cover medica...IndiaNotes.com
 
Hexaware Technologies adds 9 clients in Q2CY15, Buy
Hexaware Technologies adds 9 clients in Q2CY15, BuyHexaware Technologies adds 9 clients in Q2CY15, Buy
Hexaware Technologies adds 9 clients in Q2CY15, BuyIndiaNotes.com
 
Nirmal pi industries_03_aug15
Nirmal pi industries_03_aug15Nirmal pi industries_03_aug15
Nirmal pi industries_03_aug15IndiaNotes.com
 
Indoco Remedies: Weak domestic growth offsets export revenues in Q1FY16; Hold
Indoco Remedies: Weak domestic growth offsets export revenues in Q1FY16; HoldIndoco Remedies: Weak domestic growth offsets export revenues in Q1FY16; Hold
Indoco Remedies: Weak domestic growth offsets export revenues in Q1FY16; HoldIndiaNotes.com
 
PI Industries: Custom synthesis exports deliver growth of ~26% in Q1FY16; Buy
PI Industries: Custom synthesis exports deliver growth of ~26% in Q1FY16; BuyPI Industries: Custom synthesis exports deliver growth of ~26% in Q1FY16; Buy
PI Industries: Custom synthesis exports deliver growth of ~26% in Q1FY16; BuyIndiaNotes.com
 

Mehr von IndiaNotes.com (20)

Fce glaxo smithkline_12aug15
Fce glaxo smithkline_12aug15Fce glaxo smithkline_12aug15
Fce glaxo smithkline_12aug15
 
GSK Consumer: Horlicks strengthens its position as No.1 brand across India
GSK Consumer: Horlicks strengthens its position as No.1 brand across IndiaGSK Consumer: Horlicks strengthens its position as No.1 brand across India
GSK Consumer: Horlicks strengthens its position as No.1 brand across India
 
GSK Consumer: Horlicks strengthens its position as No.1 brand across India
GSK Consumer: Horlicks strengthens its position as No.1 brand across IndiaGSK Consumer: Horlicks strengthens its position as No.1 brand across India
GSK Consumer: Horlicks strengthens its position as No.1 brand across India
 
Hester Biosciences gets manufacturing licence for 2 additional poultry vaccines
Hester Biosciences gets manufacturing licence for 2 additional poultry vaccinesHester Biosciences gets manufacturing licence for 2 additional poultry vaccines
Hester Biosciences gets manufacturing licence for 2 additional poultry vaccines
 
Vidhi Dyestuffs: To keep its growth story in the coming quarters also
Vidhi Dyestuffs: To keep its growth story in the coming quarters alsoVidhi Dyestuffs: To keep its growth story in the coming quarters also
Vidhi Dyestuffs: To keep its growth story in the coming quarters also
 
Apollo Tyres approves further expansion of the Truck & Bus radial tyre capacity
Apollo Tyres approves further expansion of the Truck & Bus radial tyre capacityApollo Tyres approves further expansion of the Truck & Bus radial tyre capacity
Apollo Tyres approves further expansion of the Truck & Bus radial tyre capacity
 
Grasim Industries reports improved performance in Q1FY16
Grasim Industries reports improved performance in Q1FY16Grasim Industries reports improved performance in Q1FY16
Grasim Industries reports improved performance in Q1FY16
 
Cummins India: No interest burden being free from long-term or short-term debt
Cummins India: No interest burden being free from long-term or short-term debtCummins India: No interest burden being free from long-term or short-term debt
Cummins India: No interest burden being free from long-term or short-term debt
 
Buy Makers Laboratories, company growing rapidly with strong thrust on brande...
Buy Makers Laboratories, company growing rapidly with strong thrust on brande...Buy Makers Laboratories, company growing rapidly with strong thrust on brande...
Buy Makers Laboratories, company growing rapidly with strong thrust on brande...
 
Buy Multibase India, globalisation of the auto component sector to benefit th...
Buy Multibase India, globalisation of the auto component sector to benefit th...Buy Multibase India, globalisation of the auto component sector to benefit th...
Buy Multibase India, globalisation of the auto component sector to benefit th...
 
Capital First: Long-term credit rating is rated highly at AA+ by CARE
Capital First: Long-term credit rating is rated highly at AA+ by CARECapital First: Long-term credit rating is rated highly at AA+ by CARE
Capital First: Long-term credit rating is rated highly at AA+ by CARE
 
Orient Cement: Best placed to benefit from demand revival in AP & Telengana r...
Orient Cement: Best placed to benefit from demand revival in AP & Telengana r...Orient Cement: Best placed to benefit from demand revival in AP & Telengana r...
Orient Cement: Best placed to benefit from demand revival in AP & Telengana r...
 
Canara Bank's operating performance to improve in remaining 9MFY16E
Canara Bank's operating performance to improve in remaining 9MFY16ECanara Bank's operating performance to improve in remaining 9MFY16E
Canara Bank's operating performance to improve in remaining 9MFY16E
 
Nirmal lupin 06_aug15
Nirmal lupin 06_aug15Nirmal lupin 06_aug15
Nirmal lupin 06_aug15
 
Buy Jenburkt Pharmaceuticals; government's amended FDI policy to cover medica...
Buy Jenburkt Pharmaceuticals; government's amended FDI policy to cover medica...Buy Jenburkt Pharmaceuticals; government's amended FDI policy to cover medica...
Buy Jenburkt Pharmaceuticals; government's amended FDI policy to cover medica...
 
Hexaware Technologies adds 9 clients in Q2CY15, Buy
Hexaware Technologies adds 9 clients in Q2CY15, BuyHexaware Technologies adds 9 clients in Q2CY15, Buy
Hexaware Technologies adds 9 clients in Q2CY15, Buy
 
Nirmal pi industries_03_aug15
Nirmal pi industries_03_aug15Nirmal pi industries_03_aug15
Nirmal pi industries_03_aug15
 
Indoco Remedies: Weak domestic growth offsets export revenues in Q1FY16; Hold
Indoco Remedies: Weak domestic growth offsets export revenues in Q1FY16; HoldIndoco Remedies: Weak domestic growth offsets export revenues in Q1FY16; Hold
Indoco Remedies: Weak domestic growth offsets export revenues in Q1FY16; Hold
 
Fce thermax 31_jul15
Fce thermax 31_jul15Fce thermax 31_jul15
Fce thermax 31_jul15
 
PI Industries: Custom synthesis exports deliver growth of ~26% in Q1FY16; Buy
PI Industries: Custom synthesis exports deliver growth of ~26% in Q1FY16; BuyPI Industries: Custom synthesis exports deliver growth of ~26% in Q1FY16; Buy
PI Industries: Custom synthesis exports deliver growth of ~26% in Q1FY16; Buy
 

Kürzlich hochgeladen

The Economic History of the U.S. Lecture 21.pdf
The Economic History of the U.S. Lecture 21.pdfThe Economic History of the U.S. Lecture 21.pdf
The Economic History of the U.S. Lecture 21.pdfGale Pooley
 
Call Girls Koregaon Park Call Me 7737669865 Budget Friendly No Advance Booking
Call Girls Koregaon Park Call Me 7737669865 Budget Friendly No Advance BookingCall Girls Koregaon Park Call Me 7737669865 Budget Friendly No Advance Booking
Call Girls Koregaon Park Call Me 7737669865 Budget Friendly No Advance Bookingroncy bisnoi
 
The Economic History of the U.S. Lecture 30.pdf
The Economic History of the U.S. Lecture 30.pdfThe Economic History of the U.S. Lecture 30.pdf
The Economic History of the U.S. Lecture 30.pdfGale Pooley
 
The Economic History of the U.S. Lecture 19.pdf
The Economic History of the U.S. Lecture 19.pdfThe Economic History of the U.S. Lecture 19.pdf
The Economic History of the U.S. Lecture 19.pdfGale Pooley
 
03_Emmanuel Ndiaye_Degroof Petercam.pptx
03_Emmanuel Ndiaye_Degroof Petercam.pptx03_Emmanuel Ndiaye_Degroof Petercam.pptx
03_Emmanuel Ndiaye_Degroof Petercam.pptxFinTech Belgium
 
High Class Call Girls Nagpur Grishma Call 7001035870 Meet With Nagpur Escorts
High Class Call Girls Nagpur Grishma Call 7001035870 Meet With Nagpur EscortsHigh Class Call Girls Nagpur Grishma Call 7001035870 Meet With Nagpur Escorts
High Class Call Girls Nagpur Grishma Call 7001035870 Meet With Nagpur Escortsranjana rawat
 
Vip Call US 📞 7738631006 ✅Call Girls In Sakinaka ( Mumbai )
Vip Call US 📞 7738631006 ✅Call Girls In Sakinaka ( Mumbai )Vip Call US 📞 7738631006 ✅Call Girls In Sakinaka ( Mumbai )
Vip Call US 📞 7738631006 ✅Call Girls In Sakinaka ( Mumbai )Pooja Nehwal
 
Independent Call Girl Number in Kurla Mumbai📲 Pooja Nehwal 9892124323 💞 Full ...
Independent Call Girl Number in Kurla Mumbai📲 Pooja Nehwal 9892124323 💞 Full ...Independent Call Girl Number in Kurla Mumbai📲 Pooja Nehwal 9892124323 💞 Full ...
Independent Call Girl Number in Kurla Mumbai📲 Pooja Nehwal 9892124323 💞 Full ...Pooja Nehwal
 
Dividend Policy and Dividend Decision Theories.pptx
Dividend Policy and Dividend Decision Theories.pptxDividend Policy and Dividend Decision Theories.pptx
Dividend Policy and Dividend Decision Theories.pptxanshikagoel52
 
Call US 📞 9892124323 ✅ Kurla Call Girls In Kurla ( Mumbai ) secure service
Call US 📞 9892124323 ✅ Kurla Call Girls In Kurla ( Mumbai ) secure serviceCall US 📞 9892124323 ✅ Kurla Call Girls In Kurla ( Mumbai ) secure service
Call US 📞 9892124323 ✅ Kurla Call Girls In Kurla ( Mumbai ) secure servicePooja Nehwal
 
02_Fabio Colombo_Accenture_MeetupDora&Cybersecurity.pptx
02_Fabio Colombo_Accenture_MeetupDora&Cybersecurity.pptx02_Fabio Colombo_Accenture_MeetupDora&Cybersecurity.pptx
02_Fabio Colombo_Accenture_MeetupDora&Cybersecurity.pptxFinTech Belgium
 
VIP Call Girls Service Dilsukhnagar Hyderabad Call +91-8250192130
VIP Call Girls Service Dilsukhnagar Hyderabad Call +91-8250192130VIP Call Girls Service Dilsukhnagar Hyderabad Call +91-8250192130
VIP Call Girls Service Dilsukhnagar Hyderabad Call +91-8250192130Suhani Kapoor
 
Booking open Available Pune Call Girls Shivane 6297143586 Call Hot Indian Gi...
Booking open Available Pune Call Girls Shivane  6297143586 Call Hot Indian Gi...Booking open Available Pune Call Girls Shivane  6297143586 Call Hot Indian Gi...
Booking open Available Pune Call Girls Shivane 6297143586 Call Hot Indian Gi...Call Girls in Nagpur High Profile
 
Booking open Available Pune Call Girls Wadgaon Sheri 6297143586 Call Hot Ind...
Booking open Available Pune Call Girls Wadgaon Sheri  6297143586 Call Hot Ind...Booking open Available Pune Call Girls Wadgaon Sheri  6297143586 Call Hot Ind...
Booking open Available Pune Call Girls Wadgaon Sheri 6297143586 Call Hot Ind...Call Girls in Nagpur High Profile
 
The Economic History of the U.S. Lecture 22.pdf
The Economic History of the U.S. Lecture 22.pdfThe Economic History of the U.S. Lecture 22.pdf
The Economic History of the U.S. Lecture 22.pdfGale Pooley
 
Top Rated Pune Call Girls Viman Nagar ⟟ 6297143586 ⟟ Call Me For Genuine Sex...
Top Rated  Pune Call Girls Viman Nagar ⟟ 6297143586 ⟟ Call Me For Genuine Sex...Top Rated  Pune Call Girls Viman Nagar ⟟ 6297143586 ⟟ Call Me For Genuine Sex...
Top Rated Pune Call Girls Viman Nagar ⟟ 6297143586 ⟟ Call Me For Genuine Sex...Call Girls in Nagpur High Profile
 
Solution Manual for Principles of Corporate Finance 14th Edition by Richard B...
Solution Manual for Principles of Corporate Finance 14th Edition by Richard B...Solution Manual for Principles of Corporate Finance 14th Edition by Richard B...
Solution Manual for Principles of Corporate Finance 14th Edition by Richard B...ssifa0344
 
VVIP Pune Call Girls Katraj (7001035870) Pune Escorts Nearby with Complete Sa...
VVIP Pune Call Girls Katraj (7001035870) Pune Escorts Nearby with Complete Sa...VVIP Pune Call Girls Katraj (7001035870) Pune Escorts Nearby with Complete Sa...
VVIP Pune Call Girls Katraj (7001035870) Pune Escorts Nearby with Complete Sa...Call Girls in Nagpur High Profile
 
Best VIP Call Girls Noida Sector 18 Call Me: 8448380779
Best VIP Call Girls Noida Sector 18 Call Me: 8448380779Best VIP Call Girls Noida Sector 18 Call Me: 8448380779
Best VIP Call Girls Noida Sector 18 Call Me: 8448380779Delhi Call girls
 
06_Joeri Van Speybroek_Dell_MeetupDora&Cybersecurity.pdf
06_Joeri Van Speybroek_Dell_MeetupDora&Cybersecurity.pdf06_Joeri Van Speybroek_Dell_MeetupDora&Cybersecurity.pdf
06_Joeri Van Speybroek_Dell_MeetupDora&Cybersecurity.pdfFinTech Belgium
 

Kürzlich hochgeladen (20)

The Economic History of the U.S. Lecture 21.pdf
The Economic History of the U.S. Lecture 21.pdfThe Economic History of the U.S. Lecture 21.pdf
The Economic History of the U.S. Lecture 21.pdf
 
Call Girls Koregaon Park Call Me 7737669865 Budget Friendly No Advance Booking
Call Girls Koregaon Park Call Me 7737669865 Budget Friendly No Advance BookingCall Girls Koregaon Park Call Me 7737669865 Budget Friendly No Advance Booking
Call Girls Koregaon Park Call Me 7737669865 Budget Friendly No Advance Booking
 
The Economic History of the U.S. Lecture 30.pdf
The Economic History of the U.S. Lecture 30.pdfThe Economic History of the U.S. Lecture 30.pdf
The Economic History of the U.S. Lecture 30.pdf
 
The Economic History of the U.S. Lecture 19.pdf
The Economic History of the U.S. Lecture 19.pdfThe Economic History of the U.S. Lecture 19.pdf
The Economic History of the U.S. Lecture 19.pdf
 
03_Emmanuel Ndiaye_Degroof Petercam.pptx
03_Emmanuel Ndiaye_Degroof Petercam.pptx03_Emmanuel Ndiaye_Degroof Petercam.pptx
03_Emmanuel Ndiaye_Degroof Petercam.pptx
 
High Class Call Girls Nagpur Grishma Call 7001035870 Meet With Nagpur Escorts
High Class Call Girls Nagpur Grishma Call 7001035870 Meet With Nagpur EscortsHigh Class Call Girls Nagpur Grishma Call 7001035870 Meet With Nagpur Escorts
High Class Call Girls Nagpur Grishma Call 7001035870 Meet With Nagpur Escorts
 
Vip Call US 📞 7738631006 ✅Call Girls In Sakinaka ( Mumbai )
Vip Call US 📞 7738631006 ✅Call Girls In Sakinaka ( Mumbai )Vip Call US 📞 7738631006 ✅Call Girls In Sakinaka ( Mumbai )
Vip Call US 📞 7738631006 ✅Call Girls In Sakinaka ( Mumbai )
 
Independent Call Girl Number in Kurla Mumbai📲 Pooja Nehwal 9892124323 💞 Full ...
Independent Call Girl Number in Kurla Mumbai📲 Pooja Nehwal 9892124323 💞 Full ...Independent Call Girl Number in Kurla Mumbai📲 Pooja Nehwal 9892124323 💞 Full ...
Independent Call Girl Number in Kurla Mumbai📲 Pooja Nehwal 9892124323 💞 Full ...
 
Dividend Policy and Dividend Decision Theories.pptx
Dividend Policy and Dividend Decision Theories.pptxDividend Policy and Dividend Decision Theories.pptx
Dividend Policy and Dividend Decision Theories.pptx
 
Call US 📞 9892124323 ✅ Kurla Call Girls In Kurla ( Mumbai ) secure service
Call US 📞 9892124323 ✅ Kurla Call Girls In Kurla ( Mumbai ) secure serviceCall US 📞 9892124323 ✅ Kurla Call Girls In Kurla ( Mumbai ) secure service
Call US 📞 9892124323 ✅ Kurla Call Girls In Kurla ( Mumbai ) secure service
 
02_Fabio Colombo_Accenture_MeetupDora&Cybersecurity.pptx
02_Fabio Colombo_Accenture_MeetupDora&Cybersecurity.pptx02_Fabio Colombo_Accenture_MeetupDora&Cybersecurity.pptx
02_Fabio Colombo_Accenture_MeetupDora&Cybersecurity.pptx
 
VIP Call Girls Service Dilsukhnagar Hyderabad Call +91-8250192130
VIP Call Girls Service Dilsukhnagar Hyderabad Call +91-8250192130VIP Call Girls Service Dilsukhnagar Hyderabad Call +91-8250192130
VIP Call Girls Service Dilsukhnagar Hyderabad Call +91-8250192130
 
Booking open Available Pune Call Girls Shivane 6297143586 Call Hot Indian Gi...
Booking open Available Pune Call Girls Shivane  6297143586 Call Hot Indian Gi...Booking open Available Pune Call Girls Shivane  6297143586 Call Hot Indian Gi...
Booking open Available Pune Call Girls Shivane 6297143586 Call Hot Indian Gi...
 
Booking open Available Pune Call Girls Wadgaon Sheri 6297143586 Call Hot Ind...
Booking open Available Pune Call Girls Wadgaon Sheri  6297143586 Call Hot Ind...Booking open Available Pune Call Girls Wadgaon Sheri  6297143586 Call Hot Ind...
Booking open Available Pune Call Girls Wadgaon Sheri 6297143586 Call Hot Ind...
 
The Economic History of the U.S. Lecture 22.pdf
The Economic History of the U.S. Lecture 22.pdfThe Economic History of the U.S. Lecture 22.pdf
The Economic History of the U.S. Lecture 22.pdf
 
Top Rated Pune Call Girls Viman Nagar ⟟ 6297143586 ⟟ Call Me For Genuine Sex...
Top Rated  Pune Call Girls Viman Nagar ⟟ 6297143586 ⟟ Call Me For Genuine Sex...Top Rated  Pune Call Girls Viman Nagar ⟟ 6297143586 ⟟ Call Me For Genuine Sex...
Top Rated Pune Call Girls Viman Nagar ⟟ 6297143586 ⟟ Call Me For Genuine Sex...
 
Solution Manual for Principles of Corporate Finance 14th Edition by Richard B...
Solution Manual for Principles of Corporate Finance 14th Edition by Richard B...Solution Manual for Principles of Corporate Finance 14th Edition by Richard B...
Solution Manual for Principles of Corporate Finance 14th Edition by Richard B...
 
VVIP Pune Call Girls Katraj (7001035870) Pune Escorts Nearby with Complete Sa...
VVIP Pune Call Girls Katraj (7001035870) Pune Escorts Nearby with Complete Sa...VVIP Pune Call Girls Katraj (7001035870) Pune Escorts Nearby with Complete Sa...
VVIP Pune Call Girls Katraj (7001035870) Pune Escorts Nearby with Complete Sa...
 
Best VIP Call Girls Noida Sector 18 Call Me: 8448380779
Best VIP Call Girls Noida Sector 18 Call Me: 8448380779Best VIP Call Girls Noida Sector 18 Call Me: 8448380779
Best VIP Call Girls Noida Sector 18 Call Me: 8448380779
 
06_Joeri Van Speybroek_Dell_MeetupDora&Cybersecurity.pdf
06_Joeri Van Speybroek_Dell_MeetupDora&Cybersecurity.pdf06_Joeri Van Speybroek_Dell_MeetupDora&Cybersecurity.pdf
06_Joeri Van Speybroek_Dell_MeetupDora&Cybersecurity.pdf
 

Jain Irrigation 3QFY15 Results Update: Weak Agri Sector Impacts Revenue; Recovery Expected in FY16

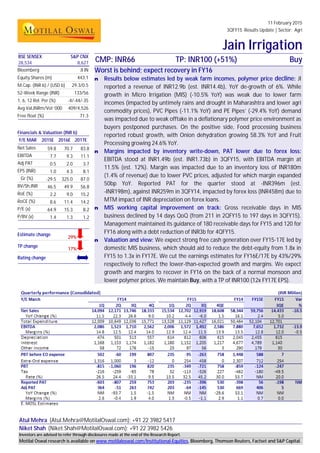
  • 1. 11 February 2015 3QFY15 Results Update | Sector: Agri Jain Irrigation Atul Mehra (Atul.Mehra@MotilalOswal.com); +91 22 3982 5417 Niket Shah (Niket.Shah@MotilalOswal.com); +91 22 3982 5426 BSE SENSEX S&P CNX CMP: INR66 TP: INR100 (+51%) Buy28,534 8,627 Bloomberg JI IN Equity Shares (m) 443.1 M.Cap. (INR b) / (USD b) 29.3/0.5 52-Week Range (INR) 133/56 1, 6, 12 Rel. Per (%) -4/-44/-35 Avg Val,INRm/Vol ‘000 409/4,526 Free float (%) 71.3 Financials & Valuation (INR b) Y/E MAR 2015E 2016E 2017E Net Sales 59.8 70.7 83.8 EBITDA 7.7 9.3 11.1 Adj PAT 0.5 2.0 3.7 EPS (INR) 1.0 4.3 8.1 Gr (%) -29.5 325.0 87.0 BV/Sh.INR 46.5 49.9 56.8 RoE (%) 2.2 9.0 15.2 RoCE (%) 8.6 11.4 14.2 P/E (x) 64.9 15.3 8.2 P/BV (x) 1.4 1.3 1.2 Estimate change 29% TP change 17% Rating change Worst is behind; expect recovery in FY16 n Results below estimates led by weak farm incomes, polymer price decline: JI reported a revenue of INR12.9b (est. INR14.4b), YoY de-growth of 6%. While growth in Micro Irrigation (MIS) (-10.5% YoY) was weak due to lower farm incomes (impacted by untimely rains and drought in Maharashtra and lower agri commodity prices), PVC Pipes (-11.1% YoY) and PE Pipes’ (-29.4% YoY) demand was impacted due to weak offtake in a deflationary polymer price environment as buyers postponed purchases. On the positive side, Food processing business reported robust growth, with Onion dehydration growing 58.3% YoY and Fruit Processing growing 24.6% YoY. n Margins impacted by inventory write-down, PAT lower due to forex loss: EBITDA stood at INR1.49b (est. INR1.73b) in 3QFY15, with EBITDA margin at 11.5% (est. 12%). Margin was impacted due to an inventory loss of INR180m (1.4% of revenue) due to lower PVC prices, adjusted for which margin expanded 50bp YoY. Reported PAT for the quarter stood at -INR396m (est. -INR198m), against INR259m in 3QFY14, impacted by forex loss (INR458m) due to MTM impact of INR depreciation on forex loans. n MIS working capital improvement on track: Gross receivable days in MIS business declined by 14 days QoQ (from 211 in 2QFY15 to 197 days in 3QFY15). Management maintained its guidance of 180 receivable days for FY15 and 120 for FY16 along with a debt reduction of INR3b for 4QFY15. n Valuation and view: We expect strong free cash generation over FY15-17E led by domestic MIS business, which should aid to reduce the debt-equity from 1.8x in FY15 to 1.3x in FY17E. We cut the earnings estimates for FY16E/17E by 43%/29% respectively to reflect the lower-than-expected growth and margins. We expect growth and margins to recover in FY16 on the back of a normal monsoon and lower polymer prices. We maintain Buy, with a TP of INR100 (12x FY17E EPS). Investors are advised to refer through disclosures made at the end of the Research Report. Motilal Oswal research is available on www.motilaloswal.com/Institutional-Equities, Bloomberg, Thomson Reuters, Factset and S&P Capital.
  • 2. 11 February 2015 2 Jain Irrigation Results below estimates n JI reported overall revenue of INR12.9b (est INR14.4b) as against INR13.8b in 3QFY14 marking a YoY de-growth of 6%. n Growth was lower than expected due to lower growth in MIS business in Maharashtra, impacted by untimely rains and drought. n Similarly, deflationary polymer price environment impacted growth in PVC and PE Pipes business as buyers postponed purchases. n EBITDA stood at INR1.49b (Est INR1.73b) in 3QFY15 with EBITDA margins at 11.5% (Est 12.0%). n Interest costs increased by 2.6% YoY and stood at INR1,205m in 3QFY15 as against INR1,174m in 3QFY14. n Forex loss for the quarter stood at INR458m. n Consequently, PAT for the quarter stood at INR-396m (Est INR-198m) as against INR259m in 3QFY14. n Management expects FY16 to be a better year on expectation of a normal monsoon and lower probability of El Nino affecting rains. n Similarly, margins are expected to improve in FY16 due to lower polymer prices. Exhibit 1: Consolidated revenue trend (INR m) Source: Company, MOSL Exhibit 2: EBITDA trend (INR m) Source: Company, MOSL Exhibit 3: PAT trend (INR m) Source: Company, MOSL 14,094 12,171 13,746 18,333 15,534 12,702 12,919 11.5 22.3 26.6 9.0 10.2 4.4 -6.0 1QFY14 2QFY14 3QFY14 4QFY14 1QFY15 2QFY15 3QFY15 Consolidated Revenue (INR m) Growth (YoY) % 2,086 1,523 1,710 2,562 2,006 1,572 1,492 14.8 12.5 12.4 14.0 12.9 12.4 11.5 1QFY14 2QFY14 3QFY14 4QFY14 1QFY15 2QFY15 3QFY15 EBITDA Margins (%) -603 -807 259 753 203 -235 -396 0.0 -93.7 1.5 -1.5 NM NM NM 1QFY14 2QFY14 3QFY14 4QFY14 1QFY15 2QFY15 3QFY15 PAT Growth (%)
  • 3. 11 February 2015 3 Jain Irrigation MIS growth negative due to weak farm incomes n MIS business de-grew by 10.5% to INR3.6b. While export business de-grew 26% YoY, domestic business reported weak growth of -8%. n Domestic MIS business was impacted due to muted demand on account of untimely rains in Maharashtra and pressure on agri commodity prices. n States like Gujarat, Karnataka, Andhra Pradesh and North & North East posted positive growth during the quarter. n Management highlighted that despite extremely weak rural sentiments, domestic MIS growth for 3QFY15 was steady due to better marketing efforts. n Maharashtra government is expected to announce time-bound schedules for mandatory sugarcane drip irrigation implementation. Management expects sugarcane to be INR80-90b opportunity which can drive long term growth. n MIS volume declined by ~3-4%. n JI has an outstanding order book of INR1.2b in MIS export business. Exhibit 4: MIS business growth by segment MIS business contribution by segment Segment 3QFY14 3QFY15 YoY Segment 3QFY14 3QFY15 YoY Retail 2,621 2,527 -4% Retail 64% 69% 5% Project 894 707 -21% Project 22% 19% -3% Export 559 414 -26% Export 14% 11% -3% Total 4,074 3,648 -10% Total 100% 100% 0% Source: Company, MOSL Most of government subsidy receivables have been recovered n Government subsidy receivables have been reduced from INR9.7b in FY12 to INR2.7b in 2QFY15. This has been led shift in favor of business to more progressive states like Maharashtra, Gujarat and Rajasthan. n Management believes government subsidy receivables will further decline to less than INR2.0b in FY15. This is despite higher growth for the MIS business. Exhibit 5: Break-up of MIS receivables (INR b) MIS -Receivables FY12 FY13 FY14 1QFY15 2QFY15 3QFY15 Dealer 2.5 1.7 2.2 2.1 1.7 1.5 Institutional 1.8 1.1 1.3 1.2 1.2 1.3 Project 3.1 2.4 3.4 4.0 4.4 3.4 Govt. Subsidy 9.7 7.1 3.9 3.4 2.6 2.7 Export 0.6 0.4 1.0 0.8 0.6 0.7 Total 17.7 12.7 11.9 11.5 10.5 9.6 Source: Company, MOSL
  • 4. 11 February 2015 4 Jain Irrigation MIS working capital improvement on right trajectory n MIS net working capital improved by 61 days YoY from 306 days in 3QFY14 to 245 days in 3QFY15. n MIS Debtors days showed a significant improvement of 68 days from 265 days in 3QFY14 to 197 days in 3QFY15. n Inventory days improved by 12 days YoY to 101 days in 3QFY15. Exhibit 6: MIS revenue trend Source: Company, MOSL Exhibit 7: MIS networking capital reducing Source: Company, MOSL Exhibit 8: MIS debtors decreased by 68 days YoY Source: Company, MOSL Exhibit 9: MIS inventory days reduced by 12 days YoY Source: Company, MOSL Polymer price deflation drives de-growth in PVC and PE piping businesses n PVC piping business de-grew by 11.1% YoY from INR1.97b in 3QFY14 to INR1.75b in 3QFY15. n PE piping business de-grew by 29.4% to INR1b in 3QFY15. n Demand was impacted as deflationary polymer price environment resulted in buyers to postpone purchases. n Inventory days in piping business improved by 14 days YoY to 40 days. n Debtor days in piping business increased by 22 days YoY to days. n Consequently Net working capital days in piping business reduced by 24 days to -31 days. n De-growth in PE piping business in 3QFY15 is expected to recover led by major infrastructure related orders expected in 4Q. n Similarly, as crude oil and polymer prices have now stabilized, demand revival is expected in the PVC pipes business as well. 3,855 2,933 4,074 6,225 4,248 3,801 3,647 16.5 17.2 25.7 24.8 10.2 29.6 -10.5 1QFY14 2QFY14 3QFY14 4QFY14 1QFY15 2QFY15 3QFY15 MIS revenue (INR M) Growth (YoY %) 296 317 306 255 235 255 245 1QFY14 2QFY14 3QFY14 4QFY14 1QFY15 2QFY15 3QFY15 Net Working Capital 308 279 265 257 243 211 197 1QFY14 2QFY14 3QFY14 4QFY14 1QFY15 2QFY15 3QFY15 Debtor days (Gross) 116 113 113 98 103 102 101 1QFY14 2QFY14 3QFY14 4QFY14 1QFY15 2QFY15 3QFY15 Inventory days
  • 5. 11 February 2015 5 Jain Irrigation Exhibit 10: PVC Piping revenue trend Source: Company, MOSL Exhibit 11: Piping net working capital days negative Source: Company, MOSL Exhibit 12: Piping inventory days down 14 days YoY Source: Company, MOSL Exhibit 13: Piping receivable days up by 22 days YoY Source: Company, MOSL Exhibit 14: PE piping revenues trend (INR m) Source: Company, MOSL Exhibit 15: PVC Sheets revenues trend (INR m) Source: Company, MOSL 3,247 1,089 1,976 2,440 2,578 1,323 1,757 36.5 1.6 3.0 -8.3 -20.6 21.5 -11.1 1QFY14 2QFY14 3QFY14 4QFY14 1QFY15 2QFY15 3QFY15 PVC Pipes Revenue (INR m) Growth (YoY %) -11 -16 -7 -8 -20 -11 -31 1QFY14 2QFY14 3QFY14 4QFY14 1QFY15 2QFY15 3QFY15 Net Working Capital 58 60 54 35 37 37 40 1QFY14 2QFY14 3QFY14 4QFY14 1QFY15 2QFY15 3QFY15 Inventory days 67 58 39 51 44 49 61 1QFY14 2QFY14 3QFY14 4QFY14 1QFY15 2QFY15 3QFY15 Debtor days (Gross) 752 1,688 1,479 1,259 696 753 1,044 -3.3 197.7 95.9 22.8 -7.5 -55.4 -29.4 1QFY14 2QFY14 3QFY14 4QFY14 1QFY15 2QFY15 3QFY15 PE Piping Revenue Growth (YoY %) 342 539 604 676 407 377 367 -17 65 22 117 19.1 -30.0 -39.2 1QFY14 2QFY14 3QFY14 4QFY14 1QFY15 2QFY15 3QFY15 PVC Sheets revenue Rev. YoY
  • 6. 11 February 2015 6 Jain Irrigation Food processing business delivered strong growth n Food processing business delivered strong performance with onion dehydration revenue growing by 58.3% YoY to INR272m; while fruit processing business growing by 24.6% YoY to INR1.2b. n Food processing inventory days declined by 40 days YoY to 246 days. However Debtor days were up by 50 days to 98 days, which as per management is a temporary phenomenon. n Net working capital saw a slippage of 91 days YoY to 226 days. Exhibit 16: Dehydrated Onions growth trend Source: Company, MOSL Exhibit 17: Fruit processing growth trend Source: Company, MOSL Exhibit 18: FP inventory days down 40 days YoY Source: Company, MOSL Exhibit 19: FP receivable days up 50 days YoY Source: Company, MOSL Exhibit 20: FP net working capital days increased by 91 days YoY Source: Company, MOSL 495 439 172 920 652 616 272 74.9 8.9 -29.5 19.3 31.7 40.4 58.3 1QFY14 2QFY14 3QFY14 4QFY14 1QFY15 2QFY15 3QFY15 Onion Dehydration revenue (INR m) Rev. YoY 881 913 963 1,946 1300 802 1,200 -16.3 50.7 49.1 39.6 47.6 -12.2 24.6 1QFY14 2QFY14 3QFY14 4QFY14 1QFY15 2QFY15 3QFY15 Fruit Processing revenue (INR m) Rev. YoY 345 315 286 190 264 276 246 1QFY14 2QFY14 3QFY14 4QFY14 1QFY15 2QFY15 3QFY15 Inventory days 66 66 48 88 87 102 98 1QFY14 2QFY14 3QFY14 4QFY14 1QFY15 2QFY15 3QFY15 Debtor days (Gross) 162 155 135 78 176 195 226 1QFY14 2QFY14 3QFY14 4QFY14 1QFY15 2QFY15 3QFY15 Net Working Capital
  • 7. 11 February 2015 7 Jain Irrigation Net working capital on consolidated basis improved by 7 days n On a consolidated (C/L) basis net working capital reduced from 161 days to 154 days in 3QFY15 (158 days in 2QFY15). Exhibit 21: C/L inventory days declined by 2 days YoY Source: Company, MOSL Exhibit 22: C/L receivable days declined by 23 days YoY Source: Company, MOSL Exhibit 23: C/L net working capital days declined by 7 days YoY Source: Company, MOSL 137 135 126 104 119 121 124 1QFY14 2QFY14 3QFY14 4QFY14 1QFY15 2QFY15 3QFY15 Inventory days 137 141 123 129 122 115 106 1QFY14 2QFY14 3QFY14 4QFY14 1QFY15 2QFY15 3QFY15 Debtor days (Gross) 162 174 161 142 145 158 154 1QFY14 2QFY14 3QFY14 4QFY14 1QFY15 2QFY15 3QFY15 Net Working Capital
  • 8. 11 February 2015 8 Jain Irrigation Consolidated debt to reduce by INR3b annually n Consolidated Net debt for 3QFY15 stood at INR42.9b as against INR42.4b in 2QFY15, marking an increase of INR0.5b on a QoQ basis. n On a YoY basis debt increased by INR0.9b from INR42b to INR42.9. n Management is targeting to reduce debt by atleast INR3b annually over FY15- 17. Annual capex is expected to be contained at INR2b. n SAFL has an outstanding loan book of INR1.35b and NPAs are expected to be less than 1%. However, growth in new disbursements during the quarter was not strong due to weak sentiments. Exhibit 24: Standalone net debt Source: Company, MOSL Exhibit 25: Consolidated net debt Source: Company, MOSL Exhibit 26: Debt Equity to decline from 1.8x in FY15 to 1.3x in FY17 Source: Company, MOSL 29.9 30.8 31.1 28.2 29.4 31.6 31.7 1QFY14 2QFY14 3QFY14 4QFY14 1QFY15 2QFY15 3QFY15 Standalone Net Debt (INR b) 40.1 41.9 42 38.9 39.8 42.4 42.9 1QFY14 2QFY14 3QFY14 4QFY14 1QFY15 2QFY15 3QFY15 Consolidated Net Debt (INR b) 34,442 35,654 38,601 38,442 35,420 32,865 2.0 1.6 1.8 1.8 1.5 1.3 FY12 FY13 FY14 FY15E FY16E FY17E Net Debt (INR m) Net DER (x)
  • 9. 11 February 2015 9 Jain Irrigation Valuation and view We value JI at a multiple of 12x FY17E EPS, (discount to long term average multiple of 20x), which we believe is justified considering: n India’s largest MIS player with a dominant market share of 55% JI is the largest player in India's organized micro irrigation sector, with a dominant market share of 55% and much higher than the second largest player Netafim (20% market share). There remains immense potential for micro irrigation in India as out of total irrigation potential of ~140 Mha and MIS potential of ~69.5 Mha, only 5 Mha (~3.5% of the total irrigation potential) is covered under MIS currently, implying significant growth potential over the long term. JI with its dominant market leadership is best placed to capture this growth potential. n Change in business model to drive de-leveraging JI has changed its business model to ensure that the company is not exposed to payment delays associated with subsidy receivables. Management is targeting to reduce gross receivable days to 180 in FY15 and 120 in FY16 which should ensure annual debt reduction of INR3b purely due to better working capital management. Additionally, the company is looking to raise INR5b in FY16 from 25% stake sale in its food processing business, proceeds of which would go towards further debt retirement. We have not factored this scenario in our forecasts, which can potentially reduce debt by another INR5b in FY16. We expect strong free cash generation, which should reduce debt-equity from 1.8x to 1.3x over FY15-17E. n Strong leadership in the high-growth food processing business JI is India’s largest player in the food processing sector, with a market share of ~30% and is the third largest in the world. Only 2% of India’s total produce is processed, compared to ~60-80% in some developed countries (80% US and Malaysia). Also, India's share in the global food trade is a miniscule 1.5%. Given the growing demand for processed food, due to lifestyle changes and storage advantages, the segment is expected to be a strong growth driver for the company. Exhibit 27: 15-year PE band Source: Company, MOSL Exhibit 28: 15-year PB band Source: Company, MOSL We value the stock at 12x FY17E EPS and arrive at a target price of INR100 – 51% upside. Maintain Buy rating.
  • 10. 11 February 2015 10 Jain Irrigation Story in charts Exhibit 29: JI is the market leader in MIS business in India Source: Company, MOSL Exhibit 30: MIS penetration in India is lowest in world Source: Company, MOSL Exhibit 31: Gross debtors set to decline Source: Company, MOSL Exhibit 32: Hence, debt to equity to decline from 1.8x to 1.3x Source: Company, MOSL Exhibit 33: Food processing is another key opportunity for JI Source: Company, MOSL Exhibit 34: RoE to improve Source: Company, MOSL 55% 20% 25% Jain Irrigation Netafim Others Market share of key players in micro irrigation systems in India 90% 78% 65% 55% 52% 10% 3% Israel Russia Spain US Brazil China India MIS penetration across countries (%) 255 316 369 343 329 257 180 150 130 FY09 FY10 FY11 FY12 FY13 FY14 FY15E FY16E FY17E Gross Sundry Debtors 34,442 35,654 38,601 38,442 35,420 32,865 2.0 1.6 1.8 1.8 1.5 1.3 FY12 FY13 FY14 FY15E FY16E FY17E Net Debt (INR m) Net DER (x) 80% 80% 70% 30% 2% USA Malaysia France Thailand India % of food processing 13.5 2.4 3.1 2.2 9.0 15.2 FY12 FY13 FY14 FY15E FY16E FY17E RoE (%)
  • 11. 11 February 2015 11 Jain Irrigation Key assumptions Exhibit 35: Key assumptions FY12 FY13 FY14 FY15E FY16E FY17E 1. Micro Irrigation Systems 18,848 14,248 17,354 18,551 22,455 27,422 % growth (YoY) 11% -24% 22% 7% 21% 22% % of net sales 38% 28% 30% 31% 32% 33% EBITDA Margin % 30% 27% 22% 20% 21% 21% 2. Plastic Piping Systems 9,856 11,269 13,928 11,170 12,886 14,865 % growth (YoY) 4% 14% 24% -20% 15% 15% % of net sales 20% 22% 24% 19% 18% 18% EBITDA Margin % 7% 7% 5% 4% 6% 6% 3. PVC sheets 1,826 1,543 2,160 1,721 2,039 2,415 % growth (YoY) 30% -15% 40% -20% 18% 18% % of net sales 4% 3% 4% 3% 3% 3% EBITDA Margin % 7% 5% 5% 6% 6% 6% 4. Agro Processing 5,441 5,736 6,884 8,677 11,171 14,383 % growth (YoY) 23% 5% 20% 26% 29% 29% % of net sales 11% 11% 12% 15% 16% 17% EBITDA Margin % 20% 19% 17% 17% 18% 18% 5. Solar Systems 1,804 2,259 1,591 1,044 1,079 1,117 % growth (YoY) 130% 25% -30% -34% 3% 4% % of net sales 4% 4% 3% 2% 2% 1% EBIDTA margin 22% 18% 18% 18% 18% 18% 6. Tissue Culture Plants 457 699 874 898 1035 1193 % growth (YoY) 64% 53% 25% 3% 15% 15% % of net sales 1% 1% 1% 2% 1% 1% EBIDTA margin 22% 18% 18% 18% 18% 18% 7. Net Subsidiary Sales 11,351 15,058 16,950 17,628 20,096 22,508 % growth (YoY) 39% 33% 13% 4% 14% 12% % of net sales 23% 30% 29% 30% 28% 27% EBIDTA margin 7% 7% 7% 10% 10% 10% Total Sales 49,206 50,217 58,344 59,761 70,678 83,820 Source: Company, MOSL
  • 12. 11 February 2015 12 Jain Irrigation Financials and valuations Consolidated - Income Statement (INR Million) Y/E March FY10 FY11 FY12 FY13 FY14 FY15E FY16E FY17E Net Sales 34,200 41,528 49,206 50,217 58,281 59,756 70,676 83,818 Change (%) 19.6 21.4 18.5 2.1 16.1 2.5 18.3 18.6 EBITDA 6,698 7,480 8,155 7,253 7,700 7,652 9,344 11,081 Margin (%) 19.6 18.0 16.6 14.4 13.2 12.8 13.2 13.2 Depreciation 1,020 1,222 1,441 1,696 2,045 2,455 2,563 2,692 EBIT 5,679 6,258 6,714 5,558 5,654 5,197 6,780 8,389 Int. and Finance Charges 2,194 3,270 4,768 4,855 4,676 4,789 4,495 3,969 Other Income - Rec. 197 1,106 345 668 463 179 212 251 PBT bef. EO Exp. 3,682 4,094 2,290 1,370 1,441 588 2,498 4,671 EO Expense/(Income) 0 0 0 1,245 2,300 712 0 0 PBT after EO Exp. 3,682 4,094 2,290 125 -860 -124 2,498 4,671 Current Tax 979 1,177 -419 175 233 -180 500 934 Deferred Tax 224 37 422 -95 -695 0 0 0 Tax Rate (%) 32.7 29.6 0.2 63.9 53.7 NM 20.0 20.0 Reported PAT 2,478 2,881 2,286 45 -398 56 1,998 3,737 PAT Adj for EO items 2,478 2,881 2,286 495 667 470 1,998 3,737 Change (%) 85.6 16.2 -20.6 -78.4 34.9 -29.5 325.0 87.0 Margin (%) 7.2 6.9 4.6 1.0 1.1 0.8 2.8 4.5 Consolidated - Balance Sheet (INR Million) Y/E March (Rs mn) FY10 FY11 FY12 FY13 FY14 FY15E FY16E FY17E Equity Share Capital 760 772 810 910 925 925 925 925 Equity Share Warrants 0 348 348 162 0 0 0 0 Total Reserves 11,384 14,439 16,378 20,608 20,831 20,562 22,127 25,322 Net Worth 12,167 15,558 17,537 21,680 21,755 21,486 23,052 26,247 Minority Interest 571 524 498 0 205 205 205 205 Deferred Liabilities 1,024 1,239 1,755 1,841 1,412 1,412 1,412 1,412 Total Loans 24,448 29,842 37,986 38,051 40,583 40,583 37,583 34,583 Capital Employed 38,210 47,164 57,775 61,572 63,955 63,686 62,251 62,447 Gross Block 23,266 28,467 33,528 37,726 41,514 44,621 46,921 49,221 Less: Accum. Deprn. 6,667 8,050 9,793 11,640 13,742 16,197 18,760 21,452 Net Fixed Assets 16,599 20,417 23,735 26,086 27,771 28,423 28,160 27,768 Capital WIP 1,324 956 1,980 749 807 0 0 0 Total Investments 211 211 236 38 14 14 14 14 Curr. Assets, Loans&Adv. 29,672 41,396 48,180 50,405 52,258 51,855 55,089 60,895 Inventory 10,638 14,864 14,614 17,231 18,364 18,742 21,872 25,985 Account Receivables 10,099 16,924 22,712 19,547 17,994 16,742 17,514 19,427 Cash and Bank Balance 5,053 4,144 3,308 2,359 1,968 2,127 2,149 1,704 Loans and Advances 3,883 5,463 7,546 11,269 13,932 14,243 13,554 13,778 Curr. Liability & Prov. 10,011 16,394 17,073 16,636 18,089 17,800 22,206 27,425 Account Payables 7,045 12,696 13,692 13,379 13,433 13,906 16,959 20,705 Other Current Liabilities 2,279 2,977 2,673 2,716 4,040 3,274 4,454 5,741 Provisions 687 720 708 541 617 620 794 978 Net Current Assets 19,662 25,002 31,107 33,770 34,169 34,054 32,883 33,470 Deferred Tax Assets 414 577 718 929 1,194 1,194 1,194 1,194 Appl. of Funds 38,210 47,164 57,775 61,572 63,955 63,686 62,251 62,447 E: MOSL Estimates
  • 13. 11 February 2015 13 Jain Irrigation Financials and valuations Ratios Y/E March FY10 FY11 FY12 FY13 FY14 FY15E FY16E FY17E Basic (INR) EPS 6.5 7.5 5.6 1.1 1.4 1.0 4.3 8.1 Cash EPS 9.2 10.6 9.2 4.8 5.9 6.3 9.9 13.9 BV/Share 32.0 40.3 43.3 47.7 47.0 46.5 49.9 56.8 DPS 0.8 1.0 1.0 0.6 0.6 0.7 0.9 1.1 Payout (%) 16.3 15.6 20.6 588.3 -68.0 582.1 21.7 14.5 Valuation (x) P/E 10.1 8.8 11.7 60.7 45.8 64.9 15.3 8.2 Cash P/E 7.2 6.2 7.2 13.7 11.3 10.4 6.7 4.7 P/BV 2.1 1.6 1.5 1.4 1.4 1.4 1.3 1.2 EV/Sales 1.5 1.4 1.3 1.3 1.2 1.2 0.9 0.8 EV/EBITDA 7.5 7.5 8.0 9.1 9.0 9.0 7.1 5.7 Dividend Yield (%) 1.3 1.4 1.5 0.9 0.9 1.0 1.4 1.7 Return Ratios (%) RoE 23.3 20.2 13.5 2.4 3.1 2.2 9.0 15.2 RoCE 18.4 18.0 14.0 10.8 10.0 8.6 11.4 14.2 Working Capital Ratios Inventory (Days) 113.5 130.6 108.4 125.2 115.0 114.5 113.0 113.2 Debtor (Days) 106 146 165 139 110 100 88 82 Leverage Ratio (x) Current Ratio 3.0 2.5 2.8 3.0 2.9 2.9 2.5 2.2 Debt/Equity 2.0 1.9 2.2 1.8 1.9 1.9 1.6 1.3 Consolidated - Cash Flow Statement (INR Million) Y/E March (Rs mn) FY10 FY11 FY12 FY13 FY14 FY15E FY16E FY17E Net Profit / (Loss) Before Tax 3,682 4,094 2,286 125 -860 588 2,498 4,671 Depreciation 1,020 1,222 1,441 1,696 2,045 2,455 2,563 2,692 Interest & Finance Charges 2,194 2,717 4,157 4,855 4,676 4,610 4,283 3,718 Direct Taxes Paid 706 1,047 938 295 41 -180 500 934 (Inc)/Dec in WC -2,408 -6,069 -6,166 -3,127 -1,551 273 1,193 -1,032 CF from Operations 3,781 916 781 3,254 4,270 8,105 10,037 9,114 Others 151 143 69 1,021 1,461 -712 0 0 CF from Operating incl EO 3,932 1,059 850 4,275 5,731 7,393 10,037 9,114 (inc)/dec in FA -4,646 -4,930 -5,270 -2,943 -2,615 -2,300 -2,300 -2,300 Free Cash Flow -714 -3,871 -4,420 1,333 3,116 5,093 7,737 6,814 (Pur)/Sale of Investments -10 -142 -114 -459 -407 0 0 0 Others 87 64 55 20 138 179 212 251 CF from Investments -4,569 -5,007 -5,330 -3,383 -2,885 -2,121 -2,088 -2,049 Issue of Shares 435 780 14 3,903 0 0 0 0 (Inc)/Dec in Debt 6,693 5,507 8,143 -586 1,216 0 -3,000 -3,000 Interest Paid -2,232 -2,717 -4,051 -4,843 -4,638 -4,789 -4,495 -3,969 Dividend Paid -219 -355 -448 -469 -265 -325 -433 -541 Others -39 -62 16 162 485 0 0 0 CF from Fin. Activity 4,637 3,153 3,674 -1,832 -3,202 -5,114 -7,928 -7,510 Inc/Dec of Cash 4,000 -796 -805 -939 -356 159 22 -444 Add: Beginning Balance 1,053 4,940 4,114 3,298 2,324 1,968 2,127 2,149 Closing Balance 5,053 4,144 3,308 2,359 1,968 2,127 2,149 1,704
  • 14. 11 February 2015 14 Jain Irrigation Corporate profile: Jain Irrigation Exhibit 37: Shareholding pattern (%) Dec-14 Sep-14 Dec-13 Promoter 28.7 28.7 27.5 DII 2.7 3.3 1.6 FII 44.9 48.0 53.0 Others 23.7 20.1 18.0 Note: FII Includes depository receipts Exhibit 38: Top holders Holder Name % Holding MKCP Institutional Investor (Mauritius) II Ltd 7.9 International Finance Corporation 3.0 Templeton Funds -Templeton Foreign Fund 2.5 Macquarie Bank Ltd 2.3 Shivanand Shankar Mankekar 1.9 Exhibit 39: Top management Name Designation Bhavarlal H Jain Chairman Ashok B Jain Vice Chairman Anil B Jain Managing Director Ajit B jain Joint Managing Director Atul Bhavarlal Jain Joint Managing Director Exhibit 40: Directors Name Name Bhavarlal H Jain Vasant V Warty* Ashok B Jain Ghanshyam Dass* Anil B Jain Arun Kumar Jain* Ajit B jain Radhika C Pereira* Atul Bhavarlal Jain R Swaminathan D R Mehta* H P Singh *Independent Exhibit 41: Auditors Name Type Haribhakti & Co Statutory Ernst & Young Internal Exhibit 42: MOSL forecast v/s consensus EPS (INR) MOSL forecast Consensus forecast Variation (%) FY15 1.0 3.0 -65.6 FY16 4.3 8.3 -48.1 FY17 8.1 9.6 -15.5 Company description Established in 1986, JI is a transnational organization headquartered at Jalgaon, Maharashtra, India. JI employs over 5,000 associates and manufactures a number of products, including drip and sprinkler irrigation systems, PVC & PE piping systems, plastic sheets, green houses, bio-fertilizers, solar products including water-heating systems, photovoltaic appliances and solar pumps. JI processes fruits and vegetables into aseptic concentrates, frozen fruits and dehydrated vegetables, respectively. It has 21 manufacturing plants spread over 5 continents and its products are supplied to 110 countries through 3,000 dealers and distributors worldwide. Exhibit 36: Sensex rebased
  • 15. 11 February 2015 15 Jain Irrigation N O T E S
  • 16. 11 February 2015 16 Jain Irrigation Disclosures This document has been prepared by Motilal Oswal Securities Limited (hereinafter referred to as Most) to provide information about the company(ies) and/sector(s), if any, covered in the report and may be distributed by it and/or its affiliated company(ies). This report is for personal information of the selected recipient/s and does not construe to be any investment, legal or taxation advice to you. This research report does not constitute an offer, invitation or inducement to invest in securities or other investments and Motilal Oswal Securities Limited (hereinafter referred as MOSt) is not soliciting any action based upon it. This report is not for public distribution and has been furnished to you solely for your general information and should not be reproduced or redistributed to any other person in any form. This report does not constitute a personal recommendation or take into account the particular investment objectives, financial situations, or needs of individual clients. Before acting on any advice or recommendation in this material, investors should consider whether it is suitable for their particular circumstances and, if necessary, seek professional advice. The price and value of the investments referred to in this material and the income from them may go down as well as up, and investors may realize losses on any investments. Past performance is not a guide for future performance, future returns are not guaranteed and a loss of original capital may occur. MOSt and its affiliates are a full-service, integrated investment banking, investment management, brokerage and financing group. We and our affiliates have investment banking and other business relationships with a some companies covered by our Research Department. Our research professionals may provide input into our investment banking and other business selection processes. Investors should assume that MOSt and/or its affiliates are seeking or will seek investment banking or other business from the company or companies that are the subject of this material and that the research professionals who were involved in preparing this material may educate investors on investments in such business. The research professionals responsible for the preparation of this document may interact with trading desk personnel, sales personnel and other parties for the purpose of gathering, applying and interpreting information. Our research professionals are paid on the profitability of MOSt which may include earnings from investment banking and other business. MOSt generally prohibits its analysts, persons reporting to analysts, and members of their households from maintaining a financial interest in the securities or derivatives of any companies that the analysts cover. Additionally, MOSt generally prohibits its analysts and persons reporting to analysts from serving as an officer, director, or advisory board member of any companies that the analysts cover. Our salespeople, traders, and other professionals or affiliates may provide oral or written market commentary or trading strategies to our clients that reflect opinions that are contrary to the opinions expressed herein, and our proprietary trading and investing businesses may make investment decisions that are inconsistent with the recommendations expressed herein. In reviewing these materials, you should be aware that any or all of the foregoing among other things, may give rise to real or potential conflicts of interest. MOSt and its affiliated company(ies), their directors and employees and their relatives may; (a) from time to time, have a long or short position in, act as principal in, and buy or sell the securities or derivatives thereof of companies mentioned herein. (b) be engaged in any other transaction involving such securities and earn brokerage or other compensation or act as a market maker in the financial instruments of the company(ies) discussed herein or act as an advisor or lender/borrower to such company(ies) or may have any other potential conflict of interests with respect to any recommendation and other related information and opinions.; however the same shall have no bearing whatsoever on the specific recommendations made by the analyst(s), as the recommendations made by the analyst(s) are completely independent of the views of the affiliates of MOSt even though there might exist an inherent conflict of interest in some of the stocks mentioned in the research report Reports based on technical and derivative analysis center on studying charts company's price movement, outstanding positions and trading volume, as opposed to focusing on a company's fundamentals and, as such, may not match with a report on a company's fundamental analysis. In addition MOST has different business segments / Divisions with independent research separated by Chinese walls catering to different set of customers having various objectives, risk profiles, investment horizon, etc, and therefore may at times have different contrary views on stocks sectors and markets. Unauthorized disclosure, use, dissemination or copying (either whole or partial) of this information, is prohibited. The person accessing this information specifically agrees to exempt MOSt or any of its affiliates or employees from, any and all responsibility/liability arising from such misuse and agrees not to hold MOSt or any of its affiliates or employees responsible for any such misuse and further agrees to hold MOSt or any of its affiliates or employees free and harmless from all losses, costs, damages, expenses that may be suffered by the person accessing this information due to any errors and delays. The information contained herein is based on publicly available data or other sources believed to be reliable. Any statements contained in this report attributed to a third party represent MOSt’s interpretation of the data, information and/or opinions provided by that third party either publicly or through a subscription service, and such use and interpretation have not been reviewed by the third party. This Report is not intended to be a complete statement or summary of the securities, markets or developments referred to in the document. While we would endeavor to update the information herein on reasonable basis, MOSt and/or its affiliates are under no obligation to update the information. Also there may be regulatory, compliance, or other reasons that may prevent MOSt and/or its affiliates from doing so. MOSt or any of its affiliates or employees shall not be in any way responsible and liable for any loss or damage that may arise to any person from any inadvertent error in the information contained in this report. MOSt or any of its affiliates or employees do not provide, at any time, any express or implied warranty of any kind, regarding any matter pertaining to this report, including without limitation the implied warranties of merchantability, fitness for a particular purpose, and non-infringement. The recipients of this report should rely on their own investigations. This report is intended for distribution to institutional investors. Recipients who are not institutional investors should seek advice of their independent financial advisor prior to taking any investment decision based on this report or for any necessary explanation of its contents. Most and it’s associates may have managed or co-managed public offering of securities, may have received compensation for investment banking or merchant banking or brokerage services, may have received any compensation for products or services other than investment banking or merchant banking or brokerage services from the subject company in the past 12 months. Most and it’s associates have not received any compensation or other benefits from the subject company or third party in connection with the research report. Subject Company may have been a client of Most or its associates during twelve months preceding the date of distribution of the research report MOSt and/or its affiliates and/or employees may have interests/positions, financial or otherwise of over 1 % at the end of the month immediately preceding the date of publication of the research in the securities mentioned in this report. To enhance transparency, MOSt has incorporated a Disclosure of Interest Statement in this document. This should, however, not be treated as endorsement of the views expressed in the report. Motilal Oswal Securities Limited is under the process of seeking registration under SEBI (Research Analyst) Regulations, 2014. There are no material disciplinary action that been taken by any regulatory authority impacting equity research analysis activities Analyst Certification The views expressed in this research report accurately reflect the personal views of the analyst(s) about the subject securities or issues, and no part of the compensation of the research analyst(s) was, is, or will be directly or indirectly related to the specific recommendations and views expressed by research analyst(s) in this report. The research analysts, strategists, or research associates principally responsible for preparation of MOSt research receive compensation based upon various factors, including quality of research, investor client feedback, stock picking, competitive factors and firm revenues Disclosure of Interest Statement JAIN IRRIGATION § Analyst ownership of the stock No § Served as an officer, director or employee No Regional Disclosures (outside India) This report is not directed or intended for distribution to or use by any person or entity resident in a state, country or any jurisdiction, where such distribution, publication, availability or use would be contrary to law, regulation or which would subject MOSt & its group companies to registration or licensing requirements within such jurisdictions. For U.S. Motilal Oswal Securities Limited (MOSL) is not a registered broker - dealer under the U.S. Securities Exchange Act of 1934, as amended (the"1934 act") and under applicable state laws in the United States. In addition MOSL is not a registered investment adviser under the U.S. Investment Advisers Act of 1940, as amended (the "Advisers Act" and together with the 1934 Act, the "Acts), and under applicable state laws in the United States. Accordingly, in the absence of specific exemption under the Acts, any brokerage and investment services provided by MOSL, including the products and services described herein are not available to or intended for U.S. persons. This report is intended for distribution only to "Major Institutional Investors" as defined by Rule 15a-6(b)(4) of the Exchange Act and interpretations thereof by SEC (henceforth referred to as "major institutional investors"). This document must not be acted on or relied on by persons who are not major institutional investors. Any investment or investment activity to which this document relates is only available to major institutional investors and will be engaged in only with major institutional investors. In reliance on the exemption from registration provided by Rule 15a-6 of the U.S. Securities Exchange Act of 1934, as amended (the "Exchange Act") and interpretations thereof by the U.S. Securities and Exchange Commission ("SEC") in order to conduct business with Institutional Investors based in the U.S., MOSL has entered into a chaperoning agreement with a U.S. registered broker-dealer, Motilal Oswal Securities International Private Limited. ("MOSIPL"). Any business interaction pursuant to this report will have to be executed within the provisions of this chaperoning agreement. The Research Analysts contributing to the report may not be registered /qualified as research analyst with FINRA. Such research analyst may not be associated persons of the U.S. registered broker-dealer, MOSIPL, and therefore, may not be subject to NASD rule 2711 and NYSE Rule 472 restrictions on communication with a subject company, public appearances and trading securities held by a research analyst account. For Singapore Motilal Oswal Capital Markets Singapore Pte Limited is acting as an exempt financial advisor under section 23(1)(f) of the Financial Advisers Act(FAA) read with regulation 17(1)(d) of the Financial Advisors Regulations and is a subsidiary of Motilal Oswal Securities Limited in India. This research is distributed in Singapore by Motilal Oswal Capital Markets Singapore Pte Limited and it is only directed in Singapore to accredited investors, as defined in the Financial Advisers Regulations and the Securities and Futures Act (Chapter 289), as amended from time to time. In respect of any matter arising from or in connection with the research you could contact the following representatives of Motilal Oswal Capital Markets Singapore Pte Limited: Anosh Koppikar Kadambari Balachandran Email : anosh.Koppikar@motilaloswal.com Email : kadambari.balachandran@motilaloswal.com Contact : (+65)68189232 Contact : (+65) 68189233 / 65249115 Office Address : 21 (Suite 31),16 Collyer Quay,Singapore 04931 Motilal Oswal Securities Ltd Motilal Oswal Tower, Level 9, Sayani Road, Prabhadevi, Mumbai 400 025 Phone: +91 22 3982 5500 E-mail: reports@motilaloswal.com