Hester Biosciences gets manufacturing licence for 2 additional poultry vaccines
•
1 gefällt mir•571 views

Hester Biosciences gets manufacturing licence for 2 more poultry vaccines; Buy #BrokerAdvice http://goo.gl/HAiesf

Empfohlen
Empfohlen
Weitere ähnliche Inhalte
Was ist angesagt?
Was ist angesagt? (19)
Ähnlich wie Hester Biosciences gets manufacturing licence for 2 additional poultry vaccines
Ähnlich wie Hester Biosciences gets manufacturing licence for 2 additional poultry vaccines (20)
Mehr von IndiaNotes.com
Mehr von IndiaNotes.com (20)
Kürzlich hochgeladen
Kürzlich hochgeladen (20)
Hester Biosciences gets manufacturing licence for 2 additional poultry vaccines
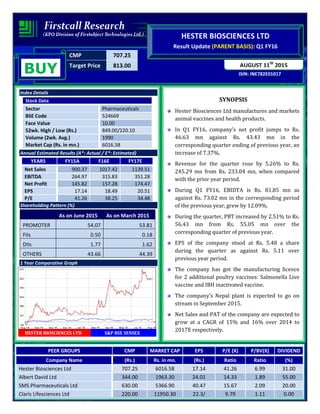
- 1. CMP 707.25 Target Price 813.00 ISIN: INE782E01017 AUGUST 11th 2015 HESTER BIOSCIENCES LTD Result Update (PARENT BASIS): Q1 FY16 BUY Index Details Stock Data Sector Pharmaceuticals BSE Code 524669 Face Value 10.00 52wk. High / Low (Rs.) 849.00/220.10 Volume (2wk. Avg.) 1990 Market Cap (Rs. in mn.) 6016.58 Annual Estimated Results (A*: Actual / E*: Estimated) YEARS FY15A F16E FY17E Net Sales 900.37 1017.42 1139.51 EBITDA 264.97 315.83 351.28 Net Profit 145.82 157.28 174.47 EPS 17.14 18.49 20.51 P/E 41.26 38.25 34.48 Shareholding Pattern (%) As on June 2015 As on March 2015 PROMOTER 54.07 53.81 FIIs 0.50 0.18 DIIs 1.77 1.62 OTHERS 43.66 44.39 1 Year Comparative Graph HESTER BIOSCIENCES LTD S&P BSE SENSEX SYNOPSIS Hester Biosciences Ltd manufactures and markets animal vaccines and health products. In Q1 FY16, company’s net profit jumps to Rs. 46.63 mn against Rs. 43.43 mn in the corresponding quarter ending of previous year, an increase of 7.37%. Revenue for the quarter rose by 5.26% to Rs. 245.29 mn from Rs. 233.04 mn, when compared with the prior year period. During Q1 FY16, EBIDTA is Rs. 81.85 mn as against Rs. 73.02 mn in the corresponding period of the previous year, grew by 12.09%. During the quarter, PBT increased by 2.51% to Rs. 56.43 mn from Rs. 55.05 mn over the corresponding quarter of previous year. EPS of the company stood at Rs. 5.48 a share during the quarter as against Rs. 5.11 over previous year period. The company has got the manufacturing licence for 2 additional poultry vaccines: Salmonella Live vaccine and IBH inactivated vaccine. The company’s Nepal plant is expected to go on stream in September 2015. Net Sales and PAT of the company are expected to grow at a CAGR of 15% and 16% over 2014 to 2017E respectively. PEER GROUPS CMP MARKET CAP EPS P/E (X) P/BV(X) DIVIDEND Company Name (Rs.) Rs. in mn. (Rs.) Ratio Ratio (%) Hester Biosciences Ltd 707.25 6016.58 17.14 41.26 6.99 31.00 Albert David Ltd 344.00 1963.30 24.01 14.33 1.89 55.00 SMS Pharmaceuticals Ltd 630.00 5366.90 40.47 15.67 2.09 20.00 Claris Lifesciences Ltd 220.00 11950.30 22.3/ 9.79 1.11 0.00
- 2. QUARTERLY HIGHLIGHTS (PARENT BASIS) Results Updates- Q1 FY16 Hester Biosciences Limited manufactures and markets animal vaccines and health products in India and internationally has reported its financial results for the quarter ended 30 June, 2015. The company’s net profit jumps to Rs. 46.63 million against Rs. 43.43 million in the corresponding quarter ending of previous year, an increase of 7.37%. Revenue for the quarter rose by 5.26% to Rs. 245.29 million from Rs. 233.04 million, when compared with the prior year period. Reported earnings per share of the company stood at Rs. 5.48 a share during the quarter as against Rs. 5.11 over previous year period. Profit before interest, depreciation and tax is Rs. 81.85 million as against Rs. 73.02 million in the corresponding period of the previous year. Break up of Expenditure Months Jun -15 Jun -14 % Change Net Sales 245.29 233.04 5.26 PAT 46.63 43.43 7.37 EPS 5.48 5.11 7.37 EBITDA 81.85 73.02 12.09 Break up of Expenditure (Rs in millions) Q1 FY16 Q1 FY15 % CHNG Cost of Material consumed 45.58 32.55 40% Purchase of Stock in Trade 13.59 9.68 40% Employee Benefit Expenses 29.34 26.94 9% Depreciation & Amortization Expense 13.39 8.28 62% Other Expenses - Mfg.exp. 33.33 28.19 18% Other Exp - Selling, Admn. 33.08 33.78 -2%
- 3. Segment Revenue Latest updates • The company got the manufacturing licence for 2 additional poultry vaccines: 1. Salmonella Live vaccine 2. IBH inactivated vaccine These 2 vaccines put together would contribute INR 20 million in this financial year. • The company’s Nepal plant is expected to go on stream in September 2015. COMPANY PROFILE Hester Biosciences Limited is one of India’s leading animal health care companies. Being the country’s second largest poultry vaccine manufacturer, Hester has rightly positioned itself to capitalise on upcoming opportunities in the animal health care industry globally. Apart from poultry vaccines, the company has recently forayed into poultry health products, large animal vaccines and large animal health products. These four verticals put together will underpin Hester’s identity as a strong animal health company, addressing all segments in the animal health care sector. Founded in 1987, by Mr. Rajiv Gandhi, a first generation entrepreneur, he converted a proprietary trading business into Asia’s largest single-location animal biological manufacturing facility. Benchmarked to international quality compliance standards, Hester manufactures and markets veterinary vaccines and health products in the Indian as well as globally.
- 4. The Company has a state-of-the-art manufacturing facility unit in Mehsana, Gujarat, complying withstringent international norms. Hester is WHO-GMP, Good Laboratory Practices (GLP), ISO 9001, ISO 14001&OHSAS 18001 certified. The Company’s product portfolio comprises of over 45 vaccines and over 70 health products, which are distributed through Hester’s all-India distribution network. Exports are currently to eight countries with the registration process on in over 20 countries. Hester’s key strength is embedded in its cutting-edge research and development capabilities. The Company’s R&D Centre is recognized by the Department of Scientific and Industrial Research (DSIR), Ministry of Science and Technology, Government of India. Current research activities are aimed at developing next generation veterinary recombinant vaccines. For the financial year 2014-15, the company reported revenue of INR 900 million with a net profit of INR 146 million.
- 5. FINANCIAL HIGHLIGHT (PARENT BASIS) (A*- Actual, E* -Estimations & Rs. In Millions) Balance Sheet as at March 31, 2014-2017E FY14A FY15A FY16E FY17E SOURCES OF FUNDS Shareholder's Funds Share Capital 85.07 85.07 85.07 85.07 Reserves and Surplus 674.65 775.21 932.49 1081.69 1. Sub Total - Net worth 759.72 860.28 1017.56 1166.76 Non Current Liabilities Long term Borrowings 61.95 144.91 165.20 183.37 Deferred Tax Liabilities 49.26 53.81 57.58 60.46 Other Long term Liabilities 0.14 0.00 0.00 0.00 2. Sub Total - Non Current Liabilities 111.35 198.72 222.77 243.82 Current Liabilities Short term Borrowings 262.55 200.64 170.54 150.08 Trade Payables 44.64 45.72 47.55 48.98 Other Current Liabilities 71.88 62.17 65.28 67.89 Short Term Provisions 38.03 39.23 40.41 41.22 3. Sub Total - Current Liabilities 417.10 347.76 323.78 308.16 Total Liabilities (1+2+3) 1288.17 1406.76 1564.11 1718.74 APPLICATION OF FUNDS Non-Current Assets Fixed Assets Tangible assets 505.84 522.76 548.90 570.85 Intangible assets 0.93 2.88 3.23 3.52 Capital Work in Progress 131.51 142.74 152.73 161.90 a) Sub Total Fixed Assets 638.28 668.38 704.86 736.27 b) Non-current investments 36.33 86.53 100.37 114.43 c) Long Term loans and advances 80.58 85.27 92.09 98.54 1. Sub Total - Non Current Assets 755.19 840.18 897.32 949.23 Current Assets Inventories 355.89 291.08 324.94 359.39 Trade receivables 140.62 182.92 226.82 272.18 Cash and Bank Balances 10.60 42.98 55.01 67.12 Short-terms loans & advances 25.87 49.60 60.02 70.82 2. Sub Total - Current Assets 532.98 566.58 666.79 769.51 Total Assets (1+2) 1288.17 1406.76 1564.11 1718.74
- 6. Annual Profit & Loss Statement for the period of 2014 to 2017E Value(Rs.in.mn) FY14A FY15A FY16E FY17E Description 12m 12m 12m 12m Net Sales 690.49 900.37 1017.42 1139.51 Other Income 7.73 3.29 2.47 2.59 Total Income 698.22 903.66 1019.89 1142.10 Expenditure -437.19 -638.69 -704.05 -790.82 Operating Profit 261.03 264.97 315.83 351.28 Interest -64.34 -44.07 -50.68 -56.26 Gross profit 196.69 220.90 265.15 295.03 Depreciation -53.78 -52.91 -58.20 -62.86 Exceptional Items 0.00 26.53 0.00 0.00 Profit Before Tax 142.91 194.52 206.95 232.17 Tax -42.03 -48.70 -49.67 -57.69 Net Profit 100.88 145.82 157.28 174.47 Equity capital 85.07 85.07 85.07 85.07 Reserves 674.65 775.21 932.49 1081.69 Face value 10.00 10.00 10.00 10.00 EPS 11.86 17.14 18.49 20.51 Quarterly Profit & Loss Statement for the period of 31st Dec, 2014 to 30th Sep, 2015E Value(Rs.in.mn) 31-Dec-14 31-Mar-15 30-Jun-15 30-Sep-15E Description 3m 3m 3m 3m Net sales 218.83 233.61 245.29 230.57 Other income 0.22 2.74 0.08 0.09 Total Income 219.05 236.35 245.37 230.66 Expenditure -155.53 -163.15 -163.52 -159.56 Operating profit 63.52 73.20 81.85 71.11 Interest -9.62 -13.86 -12.03 -13.23 Gross profit 53.90 59.34 69.82 57.88 Depreciation -8.53 -27.57 -13.39 -13.66 Exceptional Items 0.00 26.53 0.00 0.00 Profit Before Tax 45.37 58.30 56.43 44.22 Tax -11.65 -17.02 -9.80 -10.57 Net Profit 33.72 41.28 46.63 33.65 Equity capital 85.07 85.07 85.07 85.07 Face value 10.00 10.00 10.00 10.00 EPS 3.96 4.85 5.48 3.96
- 7. Ratio Analysis Particulars FY14A FY15A FY16E FY17E EPS (Rs.) 11.86 17.14 18.49 20.51 EBITDA Margin (%) 37.80 29.43 31.04 30.83 PBT Margin (%) 20.70 21.60 20.34 20.37 PAT Margin (%) 14.61 16.20 15.46 15.31 P/E Ratio (x) 59.64 41.26 38.25 34.48 ROE (%) 13.28 16.95 15.46 14.95 ROCE (%) 29.04 26.36 27.64 27.61 Debt Equity Ratio 0.43 0.40 0.33 0.29 EV/EBITDA (x) 24.25 23.85 19.94 17.89 Book Value (Rs.) 89.31 101.13 119.61 137.15 P/BV 7.92 6.99 5.91 5.16 Charts
- 8. OUTLOOK AND CONCLUSION At the current market price of Rs. 707.25, the stock P/E ratio is at 38.25 x FY16E and 34.48 x FY17E respectively. Earnings per share (EPS) of the company for the earnings for FY16E and FY17E are seen at Rs. 18.49 and Rs. 20.51 respectively. Net Sales and PAT of the company are expected to grow at a CAGR of 15% and 16% over 2014 to 2017E respectively. On the basis of EV/EBITDA, the stock trades at 19.94 x for FY16E and 17.89 x for FY17E. Price to Book Value of the stock is expected to be at 5.91 x and 5.16 x for FY16E and FY17E respectively. We recommend ‘BUY’ in this particular scrip with a target price of Rs. 813.00 for Medium to Long term investment.
- 9. INDUSTRY OVERVIEW ANIMAL VETERINARY VACCINES MARKET The global market for animal vaccines is estimated at $5.8 billion by 2013 and expected to grow at a healthy CAGR of 8.1% to $8.6 billion by 2018. The factors responsible for the growth of the market include an increasing incidence of zoonotic diseases in humans, growing prevalence of animal disease, increasing investments and continuous innovation. With growing awareness of animal health in emerging economies, players are introducing recombinant vaccines. Europe accounts for the largest share of the animal vaccines market followed by North America. The market is dominated by Tier 1 players; the top 5 players contribute close to 70% of the global market. New entrants, though facing high barriers in entering these markets on account of capital-intensity and strict regulations, these markets are reaching maturity and could register mid-single digit growth rates for five years. Asia, parts of Africa and LATAM are poised to grow at double-digit rates owing to the increasing investment opportunities for companies in these immature markets and improving healthcare facilities for animals. Countries like China, India and Brazil are expected to be major growth drivers. Animal health sits at the intersection of two large and growing industry sectors: pet care and livestock production. These two sectors are interrelated. As livestock production and pet ownership increase in response to demand growth and increased standard of living, animal health medicines and vaccines will be required in greater volumes. INDIAN LIVESTOCK SECTOR India possesses the largest livestock population in the world and accounting for a fifth of the world’s cattle population. The pet population though, still remains small. Consequently, the Indian animal health care industry is estimated at Rs22 billion, contributing a mere 2.2% to the global health care industry. Livestock plays an important role in the national economy as well as the socio-economic development, augmenting family incomes and generating gainful rural employment particularly for the landless marginal farmers and women. Growing at a CAGR of about 4%, India’s livestock population is likely to grow from 280 million to about 312 million by 2015. Cattle constitute 60 percent of India’s livestock population followed by buffaloes (32 percent), goats (four percent) and sheep (two percent). Andhra Pradesh, Rajasthan and Uttar Pradesh account for about 35 percent of India’s total livestock population followed by Karnataka, Madhya Pradesh, Maharashtra, Tamil Nadu and West Bengal. India is the world’s largest milk producer with an annual output of around 116 million tonnes. With an annual growth rate of 4%, India’s milk production accounts for 16% of the total global output. The Union Agriculture
- 10. Ministry’s Department of Animal Husbandry, Dairying & Fisheries is focusing on increasing animal population and productivity. Besides, the Ministry of Food Processing Industries intends to implement programs to increase dairy processing and value-added product export, in line with the vision to make India the ‘food factory of the world.’ INDIAN POULTRY SECTOR India is emerging as the world’s fifth largest egg producer. It produces 3.6% of global egg production. India also ranks sixth in broiler production with an annual output of 2.39 million tonnes of broiler meat estimated at about H350 bn. The scope of this sector is reflected in the fact that the annual per capita consumption of poultry in India is a mere 3.1 kg compared with 70-80 kg in developed countries. India produces nearly 27 million chickens a week (95% traded alive). The outlook for poultry production appears bright, the annual growth of the layer business estimated at 6% and broilers at 12%. Efficient distribution, cold chain infrastructure investments and increasing preference for frozen chicken are likely to be key industry drivers. Disclaimer: This document is prepared by our research analysts and it does not constitute an offer or solicitation for the purchase or sale of any financial instrument or as an official confirmation of any transaction. The information contained herein is from publicly available data or other sources believed to be reliable but we do not represent that it is accurate or complete and it should not be relied on as such. Firstcall Research or any of its affiliates shall not be in any way responsible for any loss or damage that may arise to any person from any inadvertent error in the information contained in this report. Firstcall Research and/ or its affiliates and/or employees will not be liable for the recipients’ investment decision based on this document.
- 11. Firstcall India Equity Research: Email – info@firstobjectindia.com C.V.S.L.Kameswari Pharma & Diversified U. Janaki Rao Capital Goods B. Anil Kumar Auto, IT & FMCG M. Vinayak Rao Diversified G. Amarender Diversified Firstcall Research Provides Industry Research on all the Sectors and Equity Research on Major Companies forming part of Listed and Unlisted Segments For Further Details Contact: Tel.: 022-2527 2510/2527 6077 / 25276089 Telefax: 022-25276089 040-20000235 /20000233 E-mail: info@firstobjectindia.com www.firstcallresearch.com