SlideShare ist ein Scribd-Unternehmen logo
1 von 56
Downloaden Sie, um offline zu lesen
International assessment of adaptation
Water, Food and Environment under Climate Change


                   Chu Thai Hoanh
   International Water Management Institute (IWMI)
Consultative Group on International Agricultural
                        Research (CGIAR)
                      16 Centers (Institutes)


                                                        Penang,
                                                        Malaysia


Nov-03
ADAPT
         Water, Climate, Food and Environment under
                       Climate Change
                    in Seven River Basins


Nov-03
Adaptation in seven river basins
            1.   Goal
            2.   Basins & major issues
            3.   Collaborators
            4.   Methodologies
            5.   Climate changes
            6.   Adaptation strategies
            7.   Lessons learnt


Nov-03
Goal
     Downscaling CC from global to regional level:

Develop & evaluate adaptation strategies for
river basins under climate change & climate
                 variability
Seven basins & major issues


Nov-03
ADAPT Basins
                      dry / wet areas & developed / developing regions


                                                      Rhine, EU                   Syr Darya, CA
                                                   185,000 km2, wet              400,000 km2, dry


    Sacramento, US
    70,000 km2, dry
                                                                                                      Mekong, SEA
                                                            Zayandeh Ruh, Iran                      800,000 km2, wet
                                                              42,000 km2, dry


                                            Volta, WA                          Walawe, SL
                                         400,000 km2, dry                    2,400 km2, wet


Nov-03
Sacramento


     Sacramento


     Agriculture,
  wetland & fisheries


Nov-03
Rhine


           Flood control
                                     Rhine
     & urban + industry demand


Nov-03
Volta


             Volta


         Hydropower


Nov-03
Syr Darya


                      Syr Darya


                     Lowering of
                     Aral sea level


Nov-03
Zayandeh Ruh


                         Zayandeh Ruh


                        Agriculture vs
                   industry & urban demand


Nov-03
Walawe


                  Walawe


                  Agriculture


Nov-03
Mekong


                             Mekong


                   Agriculture
                  & flood control


Nov-03
Collaborators
         1.    Institute for Environmental Studies (IVM), Netherlands
         2.    International Water Management institute (IMWI), Sri Lanka
         3.    International Food Policy Institute (IFPRI), USA
         4.    FAO, Italy
         5.    Institute of Infra-structural Hydrological & Environmental Engineering
               (IHE), Netherlands
         6.    Institute for Geo-information and earth Observation (ITC),
               Netherlands
         7.    Irrigation Department (ID), Sri Lanka
         8.    Mekong River Commission (MRC) Cambodia
         9.    Moscow State University (MSU), Russia
         10.   SEI-Boston, USA
         11.   Tarbiat Modarres University (TMU), Iran
         12.   Water Research Institute (WRI), Ghana
         13.   Wageningen University & Research (WUR), Netherlands
         14.   Center for Development Research (ZEF), Germany
                     http://www.geo.vu.nl/users/ivmadapt
Nov-03
ADAPT approach


Nov-03
Changes:

         Current !Future


Nov-03
Socio-Economic
                   Socio
                             &
                       Climate Drivers

                                           Derived from DPSIR approach
                                               (Driving forces
                                                Pressures
                         Pressures              State
                                                Impact
                   ‘Issues & Problems’
                                                Response)

         Adaptation
          strategies

                                         ‘State’ Changes
         Stakeholders


                           Impacts
                          Impacts


Nov-03
Adaptation strategies to:


          Enhance environmental quality                             Secure food production             Enhance industrial capacity

            Environment           Environment
             (Human)              (ecosystems)                               Food                           Industry


         Health   security       habitat       waterquality         Quantity        Security        Hydropower    Transport


     pcb          people       ha floodplain    BOD    Salmon                        Farm income    Kw produced      # days
                  at risk          forest                            Yield                                         Un-navigable
                                                NaCl   Fertilizer
                                                                                     Variation in
                               ha upstream
                                                                     tons of         Farm income
                                  forest
                                                                     River fish
                                 % lateral
                                 freedom
                              % longitudinal
                                 freedom
                                                         Indicators


Nov-03
Drivers
     Population growth

     Climate change & variability
     Current situation:
      - CRU data (Climatic Research Unit,
                     University of East Anglia, UK)
         - IPCC   SRES data (Special Report on
                     Emission Scenarios).
         - Observed data

     Future situation:
             SRES A2 and B2 storylines
             2010-2039 & 2070-2099
    Temperature & Precipitation


Nov-03
Climate vs Development?


         Population: changes in mean
         Climate change: changes in
         extremes & frequency


          Vörösmarty, C.J., P. Green, J. Salisbury, R.B. Lammers.
         2000. Global Water Resources: Vulnerability from Climate
           Change and Population Growth. Science 289: 284-288.
Nov-03
Climate change in seven basins


Nov-03
Syr Darya Climate 1961-90


                Mean Annual Temperature (oC)         Mean Annual Precipitation (mm)


         HadCM3-A2:                            2070-99                        HadCM3-B2:
            dTMP=5-6oC                                                       dTMP=4-5oC
            xPRE=1.06                                                        xPRE=1.28


Nov-03
Mekong precipitation
         Precipitation
         (mm/month)
         600


         500


         400


    A2
         300


         200


         100


           0
           1961    1971    1981   1991   2001   2011   2021   2031   2041   2051   2061   2071   2081   2091

                                                              Year

          Precipitation
          (mm/month)
          600


          500


          400

    B2    300


          200


          100


           0
           1961     1971   1981   1991   2001   2011   2021   2031   2041   2051   2061   2071   2081   2091
                                                              Year
Nov-03
Mekong temperature
         Mean temperature
               (oC)
         35


         30


         25


    A2   20


         15
          1961   1971   1981   1991   2001   2011   2021   2031   2041   2051   2061   2071   2081   2091

                                                           Year


         Mean temperature
               (oC)
         35


         30


    B2   25


         20


         15
          1961   1971   1981   1991   2001   2011   2021   2031   2041   2051   2061   2071   2081   2091
                                                           Year

Nov-03
Volta climate - HadCM3 A2
                                                                             34


                                                                             32
                            1961-   2010-   2070-


                                                    Temperature (oC)
         Period             1990    2039    2099                             30


         Temperature (oC)   27.3 28.5 31.8                                   28
         Std (oC)            0.5 0.5 0.8
         CV (%)              1.7 1.7 2.5                                     26


                                                                             24
         Precip. (mm y-1)   1079 1161 1147                                          CRU GCM 1961- 2010- 2070-
         Std (mm y-1)        115 105 123                                                    1990 2039 2099

         CV (%)             10.7 9.0 10.7                                    2000


                                                    Precipitation (mm y-1)
                                                                             1600


                                                                             1200


                                                                              800


                                                                              400
                                                                                     CRU GCM    1961- 2010- 2070-
                                                                                                1990 2039 2099


Nov-03
Mekong

                 2500                              B2
                 2000     CRU
                 1500                                   Extreme dry year


          [mm]
                 1000
                  500                                   Extreme wet year
                    0


                    61

                    65

                    69

                    73

                    77

                    81

                    85

                    89


                                         70

                                         74

                                         78

                                         82

                                         86

                                         90

                                         94

                                         98
                  19

                  19

                  19

                  19

                  19

                  19

                  19

                  19


                                       20

                                       20

                                       20

                                       20

                                       20

                                       20

                                       20

                                       20
                                      Year


                                Sacramento

                 2400
                 1800
                        CRU                   B2
                                                        Extreme dry year
         [mm]


                 1200
                  600                                   Extreme wet year
                    0
                    61

                    65

                    69

                    73

                    77

                    81

                    85

                    89


                                         70

                                         74

                                         78

                                         82

                                         86

                                         90

                                         94

                                         98
                  19

                  19

                  19

                  19

                  19

                  19

                  19

                  19


                                       20

                                       20

                                       20

                                       20

                                       20

                                       20

                                       20

                                       20
                                      Year


                                 Walawe
                 3600
                 3000   CRU                  B2
                                                        Extreme dry year
                 2400
         [mm]


                 1800
                 1200                                   Extreme wet year
                  600
                    0
                    61

                    65

                    69

                    73

                    77

                    81

                    85

                    89


                                        70

                                        74

                                        78

                                        82

                                        86

                                        90

                                        94

                                        98
                  19

                  19

                  19

                  19

                  19

                  19

                  19

                  19


                                      20

                                      20

                                      20

                                      20

                                      20

                                      20

                                      20

                                      20
                                     Year
Nov-03
Extreme years of precipitation in the Rhine Basin
                1400
                1200
                1000


         [mm]
                 800
                 600
                                                                               Extreme dry year
                 400
                 200
                   0                                                           Extreme wet year


                   61

                   65

                   69

                   73

                   77

                   81

                   85

                   89


                                                     70

                                                     74

                                                     78

                                                     82

                                                     86

                                                     90

                                                     94

                                                     98
                 19

                 19

                 19

                 19

                 19

                 19

                 19

                 19


                                                   20

                                                   20

                                                   20

                                                   20

                                                   20

                                                   20

                                                   20

                                                   20
                                                  Year


                       Extreme years of precipitation in the Syr Darya Basin
                700
                600
                500
         [mm]


                400
                300                                                            Extreme dry year
                200
                100                                                            Extreme wet year
                  0
                  61

                  65

                  69

                  73

                  77

                  81

                  85

                  89


                                                     70

                                                     74

                                                     78

                                                     82

                                                     86

                                                     90

                                                     94

                                                     98
                19

                19

                19

                19

                19

                19

                19

                19


                                                   20

                                                   20

                                                   20

                                                   20

                                                   20

                                                   20

                                                   20

                                                   20
                                                  Year


                         Extreme years of precipitation in the Volta Basin
                2000

                1500                                                           Extreme dry year
         [mm]


                1000
                                                                               Extreme wet year
                500

                  0
                   61

                   65

                   69

                   73

                   77

                   81

                   85

                   89


                                                      70

                                                      74

                                                      78

                                                      82

                                                      86

                                                      90

                                                      94

                                                      98
                 19

                 19

                 19

                 19

                 19

                 19

                 19

                 19


                                                    20

                                                    20

                                                    20

                                                    20

                                                    20

                                                    20

                                                    20

                                                    20
                                                  Year
Nov-03
Extreme years of precipitation in the Zayandeh Rud Basin

                600
                400
         [mm]


                                                                                                                  Extreme dry year
                200
                  0
                                                                                                                  Extreme wet year
                 61

                       65

                             69

                                   73

                                         77

                                               81

                                                     85

                                                           89


                                                                   70

                                                                         74

                                                                               78

                                                                                     82

                                                                                           86

                                                                                                 90

                                                                                                       94

                                                                                                             98
                19

                      19

                            19

                                  19

                                        19

                                              19

                                                    19

                                                          19


                                                                 20

                                                                        20

                                                                              20

                                                                                    20

                                                                                          20

                                                                                                20

                                                                                                      20

                                                                                                            20
                                                                Year


Nov-03
Changes in crop yield
          & water resources


Nov-03
Changes in crop yield & water resources


                       Use models & expert knowledge


         Hydrological models        Food production models (dif. Scales)


Nov-03
SWAP model at field scale
                                    Irrigation                Precipitation


                                                           Transpiration
                                Evaporation                     Surface runoff

                            Unsaturated
                                  zone

          Transport:
          - water
          - heat
          - solutes
                                                                               Drainage/
                         Saturated                                            subsurface
                           zone                                                infiltration


         Properties:                             Deep groundwater
         - water retention
         - hydraulic conductivity


Nov-03
Food production models
         Yield Walawe / Sri Lanka


Nov-03
Yield BAU, HADCM3_A2
         Zay_Wheat

         Zay_Rice

         Wal_Vege

         Wal_Rice

         Vol_Maize

         Vol-Rice

         Syr_Wheat

         Syr_Cotton

         Sac_Tomato

         Sac_Rice

         Rhi_Wheat

         Rhi_SugB

         Mek_Maize                                                        2010-2039
                                                                          2070-2099
         Mek_Rice


             -60%     -40%      -20%           0%             20%   40%          60%
                                       Changes in Yield (%)

Nov-03
Effective temperature for rice
                                30
         temperature sum (oC)
           Daily increase in


                                25
                                20
                                15
                                10
                                 5
                                 0
                                     0     10       20       30       40    50
                                           Daily average temperature (oC)


Nov-03
Max, min & average temperature
            Maximum
         temperature (oC)
         45


         40


         35


         30


         25


         20
             Minimum
         temperature (oC)
           1961  1971   1981   1991   2001   2011   2021   2031   2041   2051   2061   2071   2081   2091
         30
                                                           Year

         25


A2       20


         15


         10

          Mean temperature
          5     (oC)
         35
          1961   1971   1981   1991   2001   2011   2021   2031   2041   2051   2061   2071   2081   2091

                                                           Year


         30


         25


         20


         15
          1961   1971   1981   1991   2001   2011   2021   2031   2041   2051   2061   2071   2081   2091

                                                           Year
Nov-03
Food production – Syr Darya
                Wheat Production 2070-99             (mln t)


         6                                                          A2: less water less food
         5

         4
                                                               A2
                                                               B2
         3                                                            Average Farm Income 2070-99       (USD/farm)
         2
                                                                    5000
         1

         0                                                          4000
             1961-90   NA   E     F        I        M

                                                                    3000
                                                                                                                     A2
                                                                                                                     B2
                                                                    2000

             Cotton Production 2070-99             (mln t)
                                                                    1000


         3                                                             0
                                                                           1961-90   NA   E   F     I   M

                                                               A2
         2
                                                               B2


         1

                                                                      B2: more water more food
         0
             1961-90   NA   E      F           I     M


Nov-03
Walawe - Impact on Food Security
                           60%
                                                                                     1961-1990
                                                                                     2010-2030
                           50%
                                                                                     2070-2099


                           40%
         Low Yield Years


                           30%


                           20%


                           10%


                           0%
                                 0.95       0.90       0.85         0.80     0.75       0.70
                                                        Threshold Value

                                 Number of years with low yields, defined as a year where total rice
                                 production is lower than the 5 years moving average considering a
Nov-03                                                                    defined Threshold Value.
Basin simulation models
SLURP model
                                                          Mekong river sub-basins
                                                                                      Area
                                                                         Sub-basin
                            Raster 0.5 degree                                        (km2)
                                                                        Mun       60,912
                                                                        Chi       55,985
                                                                        Chi-Mun    4,175
                                                                        Lancang  225,562
                                                                        Nam Ou    30,708
                                                                        Nam Ngum   8,886
                                                                        Mekong 1 156,509
                                                                        Mekong 2  20,558
                                                                        Sekong    28,601
                                                                        Srepok    48,318
                                                                        Mekong 3  27,701
                                                                        Tonlesap  86,594
                China                                                   Delta     40,492
                                                                        Total    795,000

 Myanmar          Vietnam
              Lao
              PDR


           ThailandMEKONG
                  BASIN

                 Cambodia
                                                Climate station
                                                with long records
Nov-03
Changes in Mekong flow
                          Monthly Q - A2 - Mekong 3                            Q (m3/s)                   Monthly Q - A2 - Delta
  Q (m3/s)
                                                                              70,000
 70,000
 60,000                                                                       60,000
 50,000                                                                       50,000
 40,000                                                                       40,000
 30,000                                                                       30,000
 20,000                                                                       20,000
 10,000                                                                       10,000
      0
                                                                                  0
      1961 1971 1981 1991 2001 2011 2021 2031 2041 2051 2061 2071 2081 2091
                                                                                   1961 1971 1981 1991 2001 2011 2021 2031 2041 2051 2061 2071 2081 2091
                                        Month                                                                        Month


  Q (m3/s)                                                                     Q (m3/s)                   Monthly Q - B2 - Delta
                          Monthly Q - B2 - Mekong 3                           70,000
 70,000
 60,000                                                                       60,000
 50,000                                                                       50,000
 40,000                                                                       40,000
 30,000                                                                       30,000
 20,000                                                                       20,000
 10,000                                                                       10,000
     0                                                                            0
      1961 1971 1981 1991 2001 2011 2021 2031 2041 2051 2061 2071 2081 2091        1961 1971 1981 1991 2001 2011 2021 2031 2041 2051 2061 2071 2081 2091
                                        Month                                                                        Month


Nov-03
RHINEFLOW-2 model
             Discharge Rhine Basin
               Current vs A2 scenario


           Current
           2010-2039
           2070-2099

Nov-03
Mekong - changes in water resources
         Higher flood and more droughts in A2, 2010-39


Nov-03
Adaptation strategies


Nov-03
Four Adaptation Strategies

         Environmental focused
         Food focused
         Industry/Energy Focused
         Mix of the above


Nov-03
Measures                                      Adaptation Strategies
         ‘E’: Environmental measures             Mekong               Rhine            Volta
    Field / Management/policy scale:
   1.     Side path Salmon                      Env. adaptation    Env. adaptation    Env. adaptation
   2.     Open reservoir in dry period             strategy           strategy           strategy
   3.     Use less fertilizer
   4.     Develop sewage treatment plants   1    E3, E4, E5, E7       E3, E4, E6       E2, E4, E8
   5.     Develop dikes & protection
   6.     Construct flood regulation area        F6                   F7               F1
   7.     Regulate mangrove lodging
   8.     Protect wetlands (RAMSAR)
                                                Food adaptation    Food adaptation    Food adaptation
                                                   strategy           strategy           strategy
                                            2    E4                   E6               E4
         ‘F’: Food security measures                                  F2, F5, F9       F1, F2, F3, F5
                                                 F1, F2, F3, F5
   Farmers/manager/policy scale:
   1.     Rainfed to irrigation                                                                          ETC
   2.     Increase crop intensity                Ind. adaptation    Ind. adaptation    Ind. adaptation
   3.     Salinity control                           strategy           strategy           strategy
   4.     Increase water storage capacity
   5.     Re-use waste water                3         F4                 E6                  F7
   6.     Desalinisation                              I1                 I2                  I3
   7.     Water pricing
   8.     Water rights
   9.     Insurance arrangements
                                                Mixed adaptation   Mixed adaptation   Mixed adaptation
                                                    strategy           strategy           strategy

   1.
         ‘I’:. Industrial measures
          Built new reservoirs
                                            4       E3, E4, E5        E4, E6             E2, E4
   2.     Develop sluice / barrages
                                                    F1, F2, F3        F2, F5             F1, F2
   3.     Sell Kw for Food                          I1                I2                 I3
Nov-03
Scenarios for Mekong
     No.      Scenario      Objective        Agriculture     Reforestation
                                             development

         1    Baseline    Current trend     Developed for       Current
                            without CC            food
         2   CC-NoAgri     Effects of CC      Current           Current

         3    CC-Agri     Effects of CC &   Developed for       Current
                              agriculture         food
         4   CC-AgriFor   Effects of CC,    Developed for   Reforestation of
                            agriculture &         food        all shrub land
                               forestry                         (17.7%) by
                                                               mixed forest


Nov-03
Scenario CC-NoAgri: higher flood, deeper salinity intrusion
              Monthly discharge (m3/s)     % change           Daily discharge (m3/s)     % change
  Sub-basin   Mekong 3        Delta      Mekng 3   Delta      Mekong 3       Delta     Mekng 3   Delta
 Max 61_90        40,995        45,681                            54,829      51,161
 Min 61_90           560         1,857
 Ave 61_90        12,894        15,459
                                           Scenario A2
 Max 10_39        46,635        45,091        14         -1       57,387      50,294         5      -2
 Min 10_39           574         1,726         2         -7
 Ave 10_39        12,940        15,399         0         0
 Max 70_99        57,659        54,269        41      19          74,055      66,439        35      30
 Min 70_99           424         1,370       -24      -26
 Ave 70_99        15,147        17,698        17      14
                                           Scenario B2
 Max 10_39        45,163        45,271        10         -1       54,016      50,188        -1      -2
 Min 10_39           592         1,588         6      -15
 Ave 10_39        12,973        15,397         1         0
 Max 70_99        55,168        53,181        35      16          62,118      58,696        13      15
 Min 70_99           466         1,311       -17      -29
 Ave 70_99        13,672        16,140         6         4
Nov-03
Scenario CC-Agri: higher flood, deeper salinity intrusion
             Monthly discharge (m3/s)      % change          Daily discharge (m3/s)      % change
 Sub-basin   Mekong 3        Delta      Mekng 3   Delta      Mekong 3       Delta     Mekng 3   Delta
Max 61_90        40,995        45,681                            54,829     51,161
Min 61_90           560         1,857
Ave 61_90        12,894        15,459
                                          Scenario A2
Max 10_39        46,646        45,446        14         -1       57,629     50,533          5       -1
Min 10_39           574         1,726         2         -7
Ave 10_39        12,843        15,230         0         -1
Max 70_99        57,723        54,497        41       19         74,178     66,648         35       30
Min 70_99           424         1,370       -24       -26
Ave 70_99        14,967        17,439        16       13
                                          Scenario B2
Max 10_39        45,504        45,264        11         -1       53,979     50,165         -2       -2
Min 10_39           592         1,484         6       -20
Ave 10_39        12,884        15,245         0         -1
Max 70_99        55,106        53,138        34       16         62,070     58,655         13       15
Min 70_99           466         1,305       -17       -30
Ave 70_99        13,512        15,902         5         3
Nov-03
Scenario CC-AgriFor: less severe flood
             Monthly discharge (m3/s)     % change           Daily discharge (m3/s)     % change
                                        Mekong                                        Mekong
 Sub-basin   Mekong 3        Delta        3       Delta      Mekong 3       Delta       3       Delta
Max 61_90         40,995       45,681                            54,829     51,161
Min 61_90           560         1,857
Ave 61_90         12,894       15,459
                                          Scenario A2
Max 10_39         42,376       43,190        3          -5       57,410     49,928         5        -2
Min 10_39           508         1,634        -9      -12
Ave 10_39         11,905       14,119        -8         -9
Max 70_99         53,370       52,770       30       16          71,874     64,245        31       26
Min 70_99           412         1,356       -26      -27
Ave 70_99         13,809       16,103        7          4
                                          Scenario B2
Max 10_39         44,536       41,725        9          -9       53,068     48,221         -3       -6
Min 10_39           533         1,423        -5      -23
Ave 10_39         11,942       14,132        -7         -9
Max 70_99         54,967       52,735       34       15          66,124     59,099        21       16
Min 70_99           394         1,149       -30      -38
Nov-03
Conclusions on basin CC

         Adjust GCM data to regional conditions =>
         improve regional projections
         CC has a clear impact on food & water in all
         basins. However, not all changes cause
         negative impacts in Env. and/or Food.


Nov-03
Socio-Economic
                   Socio
                             &
                       Climate Drivers
                                                                What we have done?

                         Pressures                         1. Described ‘Pressures, issues, problems’
                   ‘Issues & Problems’
                                                           2. Development of Drivers (population & CC/CV)
         Adaptation
          strategies

                                         ‘State’ Changes
                                                           3. Simulation of Changes (food / hydrology)
         Stakeholders

                                                           4. Development and evaluation of Adaptation str.
                           Impacts
                          Impacts


                                                                 What to be done?
                                                            5. Cost benefit analysis

                                                            6. Link basin to global scale
                                                            7. Stakeholder involvement


Nov-03
Link basin strategies to global developments…..


                  Change in suitability for rain-fed wheat (HadCM3-A1FI, 2080s).
                                                                         Fisher et al. 2002
            Global Water and Agricultural: Climate Variability and Change Assessment
             Global model: Mark Rosegrant (IFPRI) / Ken Strzspek (Univ. Colorado)


Nov-03
World market Market Food Prices Influenced by Climate Change changes
                                        World
                                              food prices under climate
                                             8
   P rices R elative to C u rren t P rices


                                             7

                                             6                                                                   MaxPlank B2 2020
                                                                                                                 MaxPlank B2 2080
                                             5                                                                   Hadley A1 2020
                                             4                                                                   Hadley A1 2080
                                                                                                                 Hadley B2 2020
                                             3
                                                                                                                 Hadley B2 2080
                                             2

                                             1
                                                 Rice   Wheat   Maize          Other Grain   Soy   Cassava and
                                                                                                      R&T
                                                                        Crop


Nov-03
!


                                                             - Yes, but also White House
                                                                             effects
         Another challenge: adaptation to adaptation strategies
         Applied by others, including natural & human systems
         (Ex. people in delta have to adapt to local CC and also adapt to strategies of upstream people
                          => may we agree a common strategies for the whole basin?)
Nov-03
THANK YOU FOR YOUR
    ATTENTION

Weitere ähnliche Inhalte

Was ist angesagt?

Water resources and biofuels water quality april 2012
Water resources and biofuels water quality   april 2012Water resources and biofuels water quality   april 2012
Water resources and biofuels water quality april 2012Sharon Lezberg
 
Nile Basin wetlands — an important natural resource
Nile Basin wetlands — an important natural resourceNile Basin wetlands — an important natural resource
Nile Basin wetlands — an important natural resourceILRI
 
Ine VANDECASTEELE "Mapping of current and projected Pan-European water withdr...
Ine VANDECASTEELE "Mapping of current and projected Pan-European water withdr...Ine VANDECASTEELE "Mapping of current and projected Pan-European water withdr...
Ine VANDECASTEELE "Mapping of current and projected Pan-European water withdr...Global Risk Forum GRFDavos
 
Discharge–calcium concentration relationships in streams
Discharge–calcium concentration relationships in streamsDischarge–calcium concentration relationships in streams
Discharge–calcium concentration relationships in streamstamielkhan
 
Morris air water-carbon-fluxes-aslo2013_handout
Morris air water-carbon-fluxes-aslo2013_handoutMorris air water-carbon-fluxes-aslo2013_handout
Morris air water-carbon-fluxes-aslo2013_handoutEdwardPMorris
 
Mark Mulligan: Water availability and Productivity in the Andes Region
Mark Mulligan: Water availability and Productivity in the Andes RegionMark Mulligan: Water availability and Productivity in the Andes Region
Mark Mulligan: Water availability and Productivity in the Andes Regiontasstie
 
Water Availability and Productivity in the Andes Region
Water Availability and Productivity in the Andes RegionWater Availability and Productivity in the Andes Region
Water Availability and Productivity in the Andes RegionAndesBFP
 
Lexington Fayette Urban County: Rain Gardens
Lexington Fayette Urban County: Rain GardensLexington Fayette Urban County: Rain Gardens
Lexington Fayette Urban County: Rain GardensSotirakou964
 
Impacts of Hydrology and Habitat Changes on the Primary Production of the Ton...
Impacts of Hydrology and Habitat Changes on the Primary Production of the Ton...Impacts of Hydrology and Habitat Changes on the Primary Production of the Ton...
Impacts of Hydrology and Habitat Changes on the Primary Production of the Ton...tacochrane
 
Nile water accounting — how much is water resources and use in the Nile basin?
Nile water accounting — how much is water resources and use in the Nile basin?Nile water accounting — how much is water resources and use in the Nile basin?
Nile water accounting — how much is water resources and use in the Nile basin?ILRI
 
EcoCity 7: Fisher, fisher eco frameworks
EcoCity 7: Fisher, fisher eco frameworksEcoCity 7: Fisher, fisher eco frameworks
EcoCity 7: Fisher, fisher eco frameworksEcoCity Builders
 
Mackinnon sandwithiucnu kconferenceapril2012
Mackinnon sandwithiucnu kconferenceapril2012Mackinnon sandwithiucnu kconferenceapril2012
Mackinnon sandwithiucnu kconferenceapril2012objass
 

Was ist angesagt? (19)

Quantification of Potential Impacts of Urban and Peri Urban Agriculture and F...
Quantification of Potential Impacts of Urban and Peri Urban Agriculture and F...Quantification of Potential Impacts of Urban and Peri Urban Agriculture and F...
Quantification of Potential Impacts of Urban and Peri Urban Agriculture and F...
 
Water resources and biofuels water quality april 2012
Water resources and biofuels water quality   april 2012Water resources and biofuels water quality   april 2012
Water resources and biofuels water quality april 2012
 
Nile Basin wetlands — an important natural resource
Nile Basin wetlands — an important natural resourceNile Basin wetlands — an important natural resource
Nile Basin wetlands — an important natural resource
 
T s3 gh3_nitin kaushal
T s3 gh3_nitin kaushalT s3 gh3_nitin kaushal
T s3 gh3_nitin kaushal
 
‘Assessing Health, Livelihoods, Ecosystem Services And Poverty Alleviation In...
‘Assessing Health, Livelihoods, Ecosystem Services And Poverty Alleviation In...‘Assessing Health, Livelihoods, Ecosystem Services And Poverty Alleviation In...
‘Assessing Health, Livelihoods, Ecosystem Services And Poverty Alleviation In...
 
Ine VANDECASTEELE "Mapping of current and projected Pan-European water withdr...
Ine VANDECASTEELE "Mapping of current and projected Pan-European water withdr...Ine VANDECASTEELE "Mapping of current and projected Pan-European water withdr...
Ine VANDECASTEELE "Mapping of current and projected Pan-European water withdr...
 
Discharge–calcium concentration relationships in streams
Discharge–calcium concentration relationships in streamsDischarge–calcium concentration relationships in streams
Discharge–calcium concentration relationships in streams
 
Karkheh Basin Focal Project:Synthesis of approach, findings and lessons
Karkheh Basin Focal Project:Synthesis of approach, findings and lessonsKarkheh Basin Focal Project:Synthesis of approach, findings and lessons
Karkheh Basin Focal Project:Synthesis of approach, findings and lessons
 
Morris air water-carbon-fluxes-aslo2013_handout
Morris air water-carbon-fluxes-aslo2013_handoutMorris air water-carbon-fluxes-aslo2013_handout
Morris air water-carbon-fluxes-aslo2013_handout
 
Mark Mulligan: Water availability and Productivity in the Andes Region
Mark Mulligan: Water availability and Productivity in the Andes RegionMark Mulligan: Water availability and Productivity in the Andes Region
Mark Mulligan: Water availability and Productivity in the Andes Region
 
Water Availability and Productivity in the Andes Region
Water Availability and Productivity in the Andes RegionWater Availability and Productivity in the Andes Region
Water Availability and Productivity in the Andes Region
 
David Dilks
David DilksDavid Dilks
David Dilks
 
Lexington Fayette Urban County: Rain Gardens
Lexington Fayette Urban County: Rain GardensLexington Fayette Urban County: Rain Gardens
Lexington Fayette Urban County: Rain Gardens
 
Gq2512111220
Gq2512111220Gq2512111220
Gq2512111220
 
Impacts of Hydrology and Habitat Changes on the Primary Production of the Ton...
Impacts of Hydrology and Habitat Changes on the Primary Production of the Ton...Impacts of Hydrology and Habitat Changes on the Primary Production of the Ton...
Impacts of Hydrology and Habitat Changes on the Primary Production of the Ton...
 
Nile water accounting — how much is water resources and use in the Nile basin?
Nile water accounting — how much is water resources and use in the Nile basin?Nile water accounting — how much is water resources and use in the Nile basin?
Nile water accounting — how much is water resources and use in the Nile basin?
 
NC Chamber Public Policy Meeting
NC Chamber Public Policy MeetingNC Chamber Public Policy Meeting
NC Chamber Public Policy Meeting
 
EcoCity 7: Fisher, fisher eco frameworks
EcoCity 7: Fisher, fisher eco frameworksEcoCity 7: Fisher, fisher eco frameworks
EcoCity 7: Fisher, fisher eco frameworks
 
Mackinnon sandwithiucnu kconferenceapril2012
Mackinnon sandwithiucnu kconferenceapril2012Mackinnon sandwithiucnu kconferenceapril2012
Mackinnon sandwithiucnu kconferenceapril2012
 

Ähnlich wie Adaptation Strategies for 7 River Basins Under Climate Change

Australian Showcase: Theme 1: Australia and Waterined_v3
Australian Showcase:Theme 1:Australia and Waterined_v3Australian Showcase:Theme 1:Australia and Waterined_v3
Australian Showcase: Theme 1: Australia and Waterined_v3icidciid
 
Remote Sensing And GIS Application In Wetland Mapping
Remote Sensing And GIS Application In Wetland MappingRemote Sensing And GIS Application In Wetland Mapping
Remote Sensing And GIS Application In Wetland MappingSwetha A
 
Climate Change & Drought_Dr. Vinod K. Sharma, Sikkim SDMA_16October 2014
Climate Change & Drought_Dr. Vinod K. Sharma, Sikkim SDMA_16October 2014Climate Change & Drought_Dr. Vinod K. Sharma, Sikkim SDMA_16October 2014
Climate Change & Drought_Dr. Vinod K. Sharma, Sikkim SDMA_16October 2014India Water Portal
 
John Richardson, UBC - Learning How to Protect Water for Environmental and Hu...
John Richardson, UBC - Learning How to Protect Water for Environmental and Hu...John Richardson, UBC - Learning How to Protect Water for Environmental and Hu...
John Richardson, UBC - Learning How to Protect Water for Environmental and Hu...BC Water Science Symposium
 
Aquaculture in a changing climate
Aquaculture in a changing climateAquaculture in a changing climate
Aquaculture in a changing climateWorldFish
 
Vulnerability and Impact Assessment climate change
Vulnerability and Impact Assessment   climate changeVulnerability and Impact Assessment   climate change
Vulnerability and Impact Assessment climate changeSai Bhaskar Reddy Nakka
 
ADB, Climate Change and Water Security in South Asia, by Arnaud Cauchois
ADB, Climate Change and Water Security in South Asia, by Arnaud CauchoisADB, Climate Change and Water Security in South Asia, by Arnaud Cauchois
ADB, Climate Change and Water Security in South Asia, by Arnaud CauchoisGlobal Water Partnership
 
Steve Arakawa - Southern California Metropolitan Water District
Steve Arakawa - Southern California Metropolitan Water DistrictSteve Arakawa - Southern California Metropolitan Water District
Steve Arakawa - Southern California Metropolitan Water DistrictContract Cities
 
Celaep recursos hidricos y su calidad
Celaep recursos hidricos y su calidad Celaep recursos hidricos y su calidad
Celaep recursos hidricos y su calidad BERLYNAQUILESCALLECA
 
TERN Supersites and Carbon Monitoring_Mike Liddell
TERN Supersites and Carbon Monitoring_Mike LiddellTERN Supersites and Carbon Monitoring_Mike Liddell
TERN Supersites and Carbon Monitoring_Mike LiddellTERN Australia
 
Environmental Intelligence for Coastal Communities
Environmental Intelligence for Coastal CommunitiesEnvironmental Intelligence for Coastal Communities
Environmental Intelligence for Coastal CommunitiesChesapeake Bay Foundation
 
Global water challenges River Basin Management Opportunities and Risks
Global water challenges River Basin Management Opportunities and RisksGlobal water challenges River Basin Management Opportunities and Risks
Global water challenges River Basin Management Opportunities and RisksWater, Land and Ecosystems (WLE)
 
Climate Change Concerns and Emerging Challenges for Water and Food Security o...
Climate Change Concerns and Emerging Challenges for Water and Food Security o...Climate Change Concerns and Emerging Challenges for Water and Food Security o...
Climate Change Concerns and Emerging Challenges for Water and Food Security o...Global Water Partnership
 
Gina Lopez presentation - Conference on Mining's Impact on Philippine Economy...
Gina Lopez presentation - Conference on Mining's Impact on Philippine Economy...Gina Lopez presentation - Conference on Mining's Impact on Philippine Economy...
Gina Lopez presentation - Conference on Mining's Impact on Philippine Economy...Arangkada Philippines
 
Gina Lopez Presentation Conference on Mining's Impact on Philippine Economy a...
Gina Lopez Presentation Conference on Mining's Impact on Philippine Economy a...Gina Lopez Presentation Conference on Mining's Impact on Philippine Economy a...
Gina Lopez Presentation Conference on Mining's Impact on Philippine Economy a...No to mining in Palawan
 

Ähnlich wie Adaptation Strategies for 7 River Basins Under Climate Change (20)

Australian Showcase: Theme 1: Australia and Waterined_v3
Australian Showcase:Theme 1:Australia and Waterined_v3Australian Showcase:Theme 1:Australia and Waterined_v3
Australian Showcase: Theme 1: Australia and Waterined_v3
 
Hydro-Meteorology and Sustainable Development in the Caribbean
Hydro-Meteorology and Sustainable Development in the CaribbeanHydro-Meteorology and Sustainable Development in the Caribbean
Hydro-Meteorology and Sustainable Development in the Caribbean
 
Remote Sensing And GIS Application In Wetland Mapping
Remote Sensing And GIS Application In Wetland MappingRemote Sensing And GIS Application In Wetland Mapping
Remote Sensing And GIS Application In Wetland Mapping
 
Climate Change & Drought_Dr. Vinod K. Sharma, Sikkim SDMA_16October 2014
Climate Change & Drought_Dr. Vinod K. Sharma, Sikkim SDMA_16October 2014Climate Change & Drought_Dr. Vinod K. Sharma, Sikkim SDMA_16October 2014
Climate Change & Drought_Dr. Vinod K. Sharma, Sikkim SDMA_16October 2014
 
Climate change and water resources
Climate change and water resourcesClimate change and water resources
Climate change and water resources
 
John Richardson, UBC - Learning How to Protect Water for Environmental and Hu...
John Richardson, UBC - Learning How to Protect Water for Environmental and Hu...John Richardson, UBC - Learning How to Protect Water for Environmental and Hu...
John Richardson, UBC - Learning How to Protect Water for Environmental and Hu...
 
Aquaculture in a changing climate
Aquaculture in a changing climateAquaculture in a changing climate
Aquaculture in a changing climate
 
Vulnerability and Impact Assessment climate change
Vulnerability and Impact Assessment   climate changeVulnerability and Impact Assessment   climate change
Vulnerability and Impact Assessment climate change
 
ADB, Climate Change and Water Security in South Asia, by Arnaud Cauchois
ADB, Climate Change and Water Security in South Asia, by Arnaud CauchoisADB, Climate Change and Water Security in South Asia, by Arnaud Cauchois
ADB, Climate Change and Water Security in South Asia, by Arnaud Cauchois
 
Steve Arakawa - Southern California Metropolitan Water District
Steve Arakawa - Southern California Metropolitan Water DistrictSteve Arakawa - Southern California Metropolitan Water District
Steve Arakawa - Southern California Metropolitan Water District
 
Celaep recursos hidricos y su calidad
Celaep recursos hidricos y su calidad Celaep recursos hidricos y su calidad
Celaep recursos hidricos y su calidad
 
TERN Supersites and Carbon Monitoring_Mike Liddell
TERN Supersites and Carbon Monitoring_Mike LiddellTERN Supersites and Carbon Monitoring_Mike Liddell
TERN Supersites and Carbon Monitoring_Mike Liddell
 
Environmental Intelligence for Coastal Communities
Environmental Intelligence for Coastal CommunitiesEnvironmental Intelligence for Coastal Communities
Environmental Intelligence for Coastal Communities
 
Global water challenges River Basin Management Opportunities and Risks
Global water challenges River Basin Management Opportunities and RisksGlobal water challenges River Basin Management Opportunities and Risks
Global water challenges River Basin Management Opportunities and Risks
 
Global water challenges River Basin Management Opportunities and Risks
Global water challenges River Basin Management Opportunities and RisksGlobal water challenges River Basin Management Opportunities and Risks
Global water challenges River Basin Management Opportunities and Risks
 
Meine van Noordwijk - Sasumua: linking a landscape and institutional mosaic t...
Meine van Noordwijk - Sasumua: linking a landscape and institutional mosaic t...Meine van Noordwijk - Sasumua: linking a landscape and institutional mosaic t...
Meine van Noordwijk - Sasumua: linking a landscape and institutional mosaic t...
 
Climate Change Concerns and Emerging Challenges for Water and Food Security o...
Climate Change Concerns and Emerging Challenges for Water and Food Security o...Climate Change Concerns and Emerging Challenges for Water and Food Security o...
Climate Change Concerns and Emerging Challenges for Water and Food Security o...
 
Adaptation Strategies for Fisheries Management in Northeastern Minnesota, USA
Adaptation Strategies for Fisheries Management in Northeastern Minnesota, USAAdaptation Strategies for Fisheries Management in Northeastern Minnesota, USA
Adaptation Strategies for Fisheries Management in Northeastern Minnesota, USA
 
Gina Lopez presentation - Conference on Mining's Impact on Philippine Economy...
Gina Lopez presentation - Conference on Mining's Impact on Philippine Economy...Gina Lopez presentation - Conference on Mining's Impact on Philippine Economy...
Gina Lopez presentation - Conference on Mining's Impact on Philippine Economy...
 
Gina Lopez Presentation Conference on Mining's Impact on Philippine Economy a...
Gina Lopez Presentation Conference on Mining's Impact on Philippine Economy a...Gina Lopez Presentation Conference on Mining's Impact on Philippine Economy a...
Gina Lopez Presentation Conference on Mining's Impact on Philippine Economy a...
 

Mehr von International Water Management Institute (IWMI)

Mehr von International Water Management Institute (IWMI) (20)

ACDI VOCA: Experience with bundling innovations and services in ADVANCE I & I...
ACDI VOCA: Experience with bundling innovations and services in ADVANCE I & I...ACDI VOCA: Experience with bundling innovations and services in ADVANCE I & I...
ACDI VOCA: Experience with bundling innovations and services in ADVANCE I & I...
 
A compilation of presentations made at the 7th Small Scale Irrigation Multi-S...
A compilation of presentations made at the 7th Small Scale Irrigation Multi-S...A compilation of presentations made at the 7th Small Scale Irrigation Multi-S...
A compilation of presentations made at the 7th Small Scale Irrigation Multi-S...
 
ClimBeR – Governance for Resilience (G4R) - French version
ClimBeR – Governance for Resilience (G4R) - French versionClimBeR – Governance for Resilience (G4R) - French version
ClimBeR – Governance for Resilience (G4R) - French version
 
ClimBeR – Governance for Resilience (G4R)
ClimBeR – Governance for Resilience (G4R)ClimBeR – Governance for Resilience (G4R)
ClimBeR – Governance for Resilience (G4R)
 
Groundwater irrigation for building climate resilience in West Africa_ IWMI-E...
Groundwater irrigation for building climate resilience in West Africa_ IWMI-E...Groundwater irrigation for building climate resilience in West Africa_ IWMI-E...
Groundwater irrigation for building climate resilience in West Africa_ IWMI-E...
 
Systemic, adaptive approach for scaling groundwater irrigation in West Africa
Systemic, adaptive approach  for scaling groundwater  irrigation in West AfricaSystemic, adaptive approach  for scaling groundwater  irrigation in West Africa
Systemic, adaptive approach for scaling groundwater irrigation in West Africa
 
Groundwater and the Untapped Potential for Building Climate Resilience in W...
Groundwater and the Untapped  Potential for Building Climate  Resilience in W...Groundwater and the Untapped  Potential for Building Climate  Resilience in W...
Groundwater and the Untapped Potential for Building Climate Resilience in W...
 
Operationalizing farmer led irrigation development at scale
Operationalizing farmer led irrigation development at scaleOperationalizing farmer led irrigation development at scale
Operationalizing farmer led irrigation development at scale
 
Application of the water-energy-food (WEF) nexus concept to transboundary riv...
Application of the water-energy-food (WEF) nexus concept to transboundary riv...Application of the water-energy-food (WEF) nexus concept to transboundary riv...
Application of the water-energy-food (WEF) nexus concept to transboundary riv...
 
Develop and implement an incremental improvement plan: Module Five
Develop and implement an incremental improvement plan: Module Five Develop and implement an incremental improvement plan: Module Five
Develop and implement an incremental improvement plan: Module Five
 
Identify hazards, assess existing control measures, and assess exposure risks...
Identify hazards, assess existing control measures, and assess exposure risks...Identify hazards, assess existing control measures, and assess exposure risks...
Identify hazards, assess existing control measures, and assess exposure risks...
 
Identify hazards, assess existing control measures, and assess exposure risk...
Identify hazards, assess existing control measures, and assess  exposure risk...Identify hazards, assess existing control measures, and assess  exposure risk...
Identify hazards, assess existing control measures, and assess exposure risk...
 
Describe the existing sanitation system - Module Three of Governance and Reus...
Describe the existing sanitation system - Module Three of Governance and Reus...Describe the existing sanitation system - Module Three of Governance and Reus...
Describe the existing sanitation system - Module Three of Governance and Reus...
 
Prepare for Reuse/Sanitation Safety Plan - Module Two of Governance and Reuse...
Prepare for Reuse/Sanitation Safety Plan - Module Two of Governance and Reuse...Prepare for Reuse/Sanitation Safety Plan - Module Two of Governance and Reuse...
Prepare for Reuse/Sanitation Safety Plan - Module Two of Governance and Reuse...
 
Introduction to Reuse/Sanitation Safety Planning and Governance System - Modu...
Introduction to Reuse/Sanitation Safety Planning and Governance System - Modu...Introduction to Reuse/Sanitation Safety Planning and Governance System - Modu...
Introduction to Reuse/Sanitation Safety Planning and Governance System - Modu...
 
Water reuse in MENA: Status, prospects and challenges
Water reuse in MENA: Status, prospects and challenges Water reuse in MENA: Status, prospects and challenges
Water reuse in MENA: Status, prospects and challenges
 
Integration of circular economy approach into sanitation service delivery for...
Integration of circular economy approach into sanitation service delivery for...Integration of circular economy approach into sanitation service delivery for...
Integration of circular economy approach into sanitation service delivery for...
 
Irrigation development and agricultural water management in Africa: transitio...
Irrigation development and agricultural water management in Africa: transitio...Irrigation development and agricultural water management in Africa: transitio...
Irrigation development and agricultural water management in Africa: transitio...
 
Drought Challenges: Policy Options for Developing Countries
Drought Challenges: Policy Options for Developing CountriesDrought Challenges: Policy Options for Developing Countries
Drought Challenges: Policy Options for Developing Countries
 
Institutionalizing Water Accounting - Overview
Institutionalizing Water Accounting - Overview Institutionalizing Water Accounting - Overview
Institutionalizing Water Accounting - Overview
 

Kürzlich hochgeladen

1029 - Danh muc Sach Giao Khoa 10 . pdf
1029 -  Danh muc Sach Giao Khoa 10 . pdf1029 -  Danh muc Sach Giao Khoa 10 . pdf
1029 - Danh muc Sach Giao Khoa 10 . pdfQucHHunhnh
 
Introduction to ArtificiaI Intelligence in Higher Education
Introduction to ArtificiaI Intelligence in Higher EducationIntroduction to ArtificiaI Intelligence in Higher Education
Introduction to ArtificiaI Intelligence in Higher Educationpboyjonauth
 
Grant Readiness 101 TechSoup and Remy Consulting
Grant Readiness 101 TechSoup and Remy ConsultingGrant Readiness 101 TechSoup and Remy Consulting
Grant Readiness 101 TechSoup and Remy ConsultingTechSoup
 
Beyond the EU: DORA and NIS 2 Directive's Global Impact
Beyond the EU: DORA and NIS 2 Directive's Global ImpactBeyond the EU: DORA and NIS 2 Directive's Global Impact
Beyond the EU: DORA and NIS 2 Directive's Global ImpactPECB
 
A Critique of the Proposed National Education Policy Reform
A Critique of the Proposed National Education Policy ReformA Critique of the Proposed National Education Policy Reform
A Critique of the Proposed National Education Policy ReformChameera Dedduwage
 
Software Engineering Methodologies (overview)
Software Engineering Methodologies (overview)Software Engineering Methodologies (overview)
Software Engineering Methodologies (overview)eniolaolutunde
 
Interactive Powerpoint_How to Master effective communication
Interactive Powerpoint_How to Master effective communicationInteractive Powerpoint_How to Master effective communication
Interactive Powerpoint_How to Master effective communicationnomboosow
 
BASLIQ CURRENT LOOKBOOK LOOKBOOK(1) (1).pdf
BASLIQ CURRENT LOOKBOOK  LOOKBOOK(1) (1).pdfBASLIQ CURRENT LOOKBOOK  LOOKBOOK(1) (1).pdf
BASLIQ CURRENT LOOKBOOK LOOKBOOK(1) (1).pdfSoniaTolstoy
 
Q4-W6-Restating Informational Text Grade 3
Q4-W6-Restating Informational Text Grade 3Q4-W6-Restating Informational Text Grade 3
Q4-W6-Restating Informational Text Grade 3JemimahLaneBuaron
 
Nutritional Needs Presentation - HLTH 104
Nutritional Needs Presentation - HLTH 104Nutritional Needs Presentation - HLTH 104
Nutritional Needs Presentation - HLTH 104misteraugie
 
“Oh GOSH! Reflecting on Hackteria's Collaborative Practices in a Global Do-It...
“Oh GOSH! Reflecting on Hackteria's Collaborative Practices in a Global Do-It...“Oh GOSH! Reflecting on Hackteria's Collaborative Practices in a Global Do-It...
“Oh GOSH! Reflecting on Hackteria's Collaborative Practices in a Global Do-It...Marc Dusseiller Dusjagr
 
Accessible design: Minimum effort, maximum impact
Accessible design: Minimum effort, maximum impactAccessible design: Minimum effort, maximum impact
Accessible design: Minimum effort, maximum impactdawncurless
 
Advanced Views - Calendar View in Odoo 17
Advanced Views - Calendar View in Odoo 17Advanced Views - Calendar View in Odoo 17
Advanced Views - Calendar View in Odoo 17Celine George
 
Call Girls in Dwarka Mor Delhi Contact Us 9654467111
Call Girls in Dwarka Mor Delhi Contact Us 9654467111Call Girls in Dwarka Mor Delhi Contact Us 9654467111
Call Girls in Dwarka Mor Delhi Contact Us 9654467111Sapana Sha
 
Organic Name Reactions for the students and aspirants of Chemistry12th.pptx
Organic Name Reactions  for the students and aspirants of Chemistry12th.pptxOrganic Name Reactions  for the students and aspirants of Chemistry12th.pptx
Organic Name Reactions for the students and aspirants of Chemistry12th.pptxVS Mahajan Coaching Centre
 
CARE OF CHILD IN INCUBATOR..........pptx
CARE OF CHILD IN INCUBATOR..........pptxCARE OF CHILD IN INCUBATOR..........pptx
CARE OF CHILD IN INCUBATOR..........pptxGaneshChakor2
 

Kürzlich hochgeladen (20)

1029 - Danh muc Sach Giao Khoa 10 . pdf
1029 -  Danh muc Sach Giao Khoa 10 . pdf1029 -  Danh muc Sach Giao Khoa 10 . pdf
1029 - Danh muc Sach Giao Khoa 10 . pdf
 
Introduction to ArtificiaI Intelligence in Higher Education
Introduction to ArtificiaI Intelligence in Higher EducationIntroduction to ArtificiaI Intelligence in Higher Education
Introduction to ArtificiaI Intelligence in Higher Education
 
Grant Readiness 101 TechSoup and Remy Consulting
Grant Readiness 101 TechSoup and Remy ConsultingGrant Readiness 101 TechSoup and Remy Consulting
Grant Readiness 101 TechSoup and Remy Consulting
 
Beyond the EU: DORA and NIS 2 Directive's Global Impact
Beyond the EU: DORA and NIS 2 Directive's Global ImpactBeyond the EU: DORA and NIS 2 Directive's Global Impact
Beyond the EU: DORA and NIS 2 Directive's Global Impact
 
A Critique of the Proposed National Education Policy Reform
A Critique of the Proposed National Education Policy ReformA Critique of the Proposed National Education Policy Reform
A Critique of the Proposed National Education Policy Reform
 
Mattingly "AI & Prompt Design: The Basics of Prompt Design"
Mattingly "AI & Prompt Design: The Basics of Prompt Design"Mattingly "AI & Prompt Design: The Basics of Prompt Design"
Mattingly "AI & Prompt Design: The Basics of Prompt Design"
 
Software Engineering Methodologies (overview)
Software Engineering Methodologies (overview)Software Engineering Methodologies (overview)
Software Engineering Methodologies (overview)
 
TataKelola dan KamSiber Kecerdasan Buatan v022.pdf
TataKelola dan KamSiber Kecerdasan Buatan v022.pdfTataKelola dan KamSiber Kecerdasan Buatan v022.pdf
TataKelola dan KamSiber Kecerdasan Buatan v022.pdf
 
Interactive Powerpoint_How to Master effective communication
Interactive Powerpoint_How to Master effective communicationInteractive Powerpoint_How to Master effective communication
Interactive Powerpoint_How to Master effective communication
 
BASLIQ CURRENT LOOKBOOK LOOKBOOK(1) (1).pdf
BASLIQ CURRENT LOOKBOOK  LOOKBOOK(1) (1).pdfBASLIQ CURRENT LOOKBOOK  LOOKBOOK(1) (1).pdf
BASLIQ CURRENT LOOKBOOK LOOKBOOK(1) (1).pdf
 
Q4-W6-Restating Informational Text Grade 3
Q4-W6-Restating Informational Text Grade 3Q4-W6-Restating Informational Text Grade 3
Q4-W6-Restating Informational Text Grade 3
 
Nutritional Needs Presentation - HLTH 104
Nutritional Needs Presentation - HLTH 104Nutritional Needs Presentation - HLTH 104
Nutritional Needs Presentation - HLTH 104
 
Staff of Color (SOC) Retention Efforts DDSD
Staff of Color (SOC) Retention Efforts DDSDStaff of Color (SOC) Retention Efforts DDSD
Staff of Color (SOC) Retention Efforts DDSD
 
“Oh GOSH! Reflecting on Hackteria's Collaborative Practices in a Global Do-It...
“Oh GOSH! Reflecting on Hackteria's Collaborative Practices in a Global Do-It...“Oh GOSH! Reflecting on Hackteria's Collaborative Practices in a Global Do-It...
“Oh GOSH! Reflecting on Hackteria's Collaborative Practices in a Global Do-It...
 
Mattingly "AI & Prompt Design: Structured Data, Assistants, & RAG"
Mattingly "AI & Prompt Design: Structured Data, Assistants, & RAG"Mattingly "AI & Prompt Design: Structured Data, Assistants, & RAG"
Mattingly "AI & Prompt Design: Structured Data, Assistants, & RAG"
 
Accessible design: Minimum effort, maximum impact
Accessible design: Minimum effort, maximum impactAccessible design: Minimum effort, maximum impact
Accessible design: Minimum effort, maximum impact
 
Advanced Views - Calendar View in Odoo 17
Advanced Views - Calendar View in Odoo 17Advanced Views - Calendar View in Odoo 17
Advanced Views - Calendar View in Odoo 17
 
Call Girls in Dwarka Mor Delhi Contact Us 9654467111
Call Girls in Dwarka Mor Delhi Contact Us 9654467111Call Girls in Dwarka Mor Delhi Contact Us 9654467111
Call Girls in Dwarka Mor Delhi Contact Us 9654467111
 
Organic Name Reactions for the students and aspirants of Chemistry12th.pptx
Organic Name Reactions  for the students and aspirants of Chemistry12th.pptxOrganic Name Reactions  for the students and aspirants of Chemistry12th.pptx
Organic Name Reactions for the students and aspirants of Chemistry12th.pptx
 
CARE OF CHILD IN INCUBATOR..........pptx
CARE OF CHILD IN INCUBATOR..........pptxCARE OF CHILD IN INCUBATOR..........pptx
CARE OF CHILD IN INCUBATOR..........pptx
 

Adaptation Strategies for 7 River Basins Under Climate Change

  • 1. International assessment of adaptation Water, Food and Environment under Climate Change Chu Thai Hoanh International Water Management Institute (IWMI)
  • 2. Consultative Group on International Agricultural Research (CGIAR) 16 Centers (Institutes) Penang, Malaysia Nov-03
  • 3. ADAPT Water, Climate, Food and Environment under Climate Change in Seven River Basins Nov-03
  • 4. Adaptation in seven river basins 1. Goal 2. Basins & major issues 3. Collaborators 4. Methodologies 5. Climate changes 6. Adaptation strategies 7. Lessons learnt Nov-03
  • 5. Goal Downscaling CC from global to regional level: Develop & evaluate adaptation strategies for river basins under climate change & climate variability
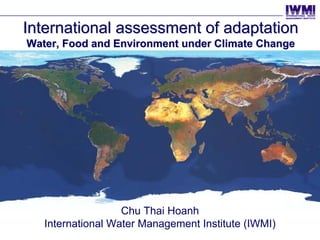
  • 6. Seven basins & major issues Nov-03
  • 7. ADAPT Basins dry / wet areas & developed / developing regions Rhine, EU Syr Darya, CA 185,000 km2, wet 400,000 km2, dry Sacramento, US 70,000 km2, dry Mekong, SEA Zayandeh Ruh, Iran 800,000 km2, wet 42,000 km2, dry Volta, WA Walawe, SL 400,000 km2, dry 2,400 km2, wet Nov-03
  • 8. Sacramento Sacramento Agriculture, wetland & fisheries Nov-03
  • 9. Rhine Flood control Rhine & urban + industry demand Nov-03
  • 10. Volta Volta Hydropower Nov-03
  • 11. Syr Darya Syr Darya Lowering of Aral sea level Nov-03
  • 12. Zayandeh Ruh Zayandeh Ruh Agriculture vs industry & urban demand Nov-03
  • 13. Walawe Walawe Agriculture Nov-03
  • 14. Mekong Mekong Agriculture & flood control Nov-03
  • 15. Collaborators 1. Institute for Environmental Studies (IVM), Netherlands 2. International Water Management institute (IMWI), Sri Lanka 3. International Food Policy Institute (IFPRI), USA 4. FAO, Italy 5. Institute of Infra-structural Hydrological & Environmental Engineering (IHE), Netherlands 6. Institute for Geo-information and earth Observation (ITC), Netherlands 7. Irrigation Department (ID), Sri Lanka 8. Mekong River Commission (MRC) Cambodia 9. Moscow State University (MSU), Russia 10. SEI-Boston, USA 11. Tarbiat Modarres University (TMU), Iran 12. Water Research Institute (WRI), Ghana 13. Wageningen University & Research (WUR), Netherlands 14. Center for Development Research (ZEF), Germany http://www.geo.vu.nl/users/ivmadapt Nov-03
  • 17. Changes: Current !Future Nov-03
  • 18. Socio-Economic Socio & Climate Drivers Derived from DPSIR approach (Driving forces Pressures Pressures State Impact ‘Issues & Problems’ Response) Adaptation strategies ‘State’ Changes Stakeholders Impacts Impacts Nov-03
  • 19. Adaptation strategies to: Enhance environmental quality Secure food production Enhance industrial capacity Environment Environment (Human) (ecosystems) Food Industry Health security habitat waterquality Quantity Security Hydropower Transport pcb people ha floodplain BOD Salmon Farm income Kw produced # days at risk forest Yield Un-navigable NaCl Fertilizer Variation in ha upstream tons of Farm income forest River fish % lateral freedom % longitudinal freedom Indicators Nov-03
  • 20. Drivers Population growth Climate change & variability Current situation: - CRU data (Climatic Research Unit, University of East Anglia, UK) - IPCC SRES data (Special Report on Emission Scenarios). - Observed data Future situation: SRES A2 and B2 storylines 2010-2039 & 2070-2099 Temperature & Precipitation Nov-03
  • 21. Climate vs Development? Population: changes in mean Climate change: changes in extremes & frequency Vörösmarty, C.J., P. Green, J. Salisbury, R.B. Lammers. 2000. Global Water Resources: Vulnerability from Climate Change and Population Growth. Science 289: 284-288. Nov-03
  • 22. Climate change in seven basins Nov-03
  • 23. Syr Darya Climate 1961-90 Mean Annual Temperature (oC) Mean Annual Precipitation (mm) HadCM3-A2: 2070-99 HadCM3-B2: dTMP=5-6oC dTMP=4-5oC xPRE=1.06 xPRE=1.28 Nov-03
  • 24. Mekong precipitation Precipitation (mm/month) 600 500 400 A2 300 200 100 0 1961 1971 1981 1991 2001 2011 2021 2031 2041 2051 2061 2071 2081 2091 Year Precipitation (mm/month) 600 500 400 B2 300 200 100 0 1961 1971 1981 1991 2001 2011 2021 2031 2041 2051 2061 2071 2081 2091 Year Nov-03
  • 25. Mekong temperature Mean temperature (oC) 35 30 25 A2 20 15 1961 1971 1981 1991 2001 2011 2021 2031 2041 2051 2061 2071 2081 2091 Year Mean temperature (oC) 35 30 B2 25 20 15 1961 1971 1981 1991 2001 2011 2021 2031 2041 2051 2061 2071 2081 2091 Year Nov-03
  • 26. Volta climate - HadCM3 A2 34 32 1961- 2010- 2070- Temperature (oC) Period 1990 2039 2099 30 Temperature (oC) 27.3 28.5 31.8 28 Std (oC) 0.5 0.5 0.8 CV (%) 1.7 1.7 2.5 26 24 Precip. (mm y-1) 1079 1161 1147 CRU GCM 1961- 2010- 2070- Std (mm y-1) 115 105 123 1990 2039 2099 CV (%) 10.7 9.0 10.7 2000 Precipitation (mm y-1) 1600 1200 800 400 CRU GCM 1961- 2010- 2070- 1990 2039 2099 Nov-03
  • 27. Mekong 2500 B2 2000 CRU 1500 Extreme dry year [mm] 1000 500 Extreme wet year 0 61 65 69 73 77 81 85 89 70 74 78 82 86 90 94 98 19 19 19 19 19 19 19 19 20 20 20 20 20 20 20 20 Year Sacramento 2400 1800 CRU B2 Extreme dry year [mm] 1200 600 Extreme wet year 0 61 65 69 73 77 81 85 89 70 74 78 82 86 90 94 98 19 19 19 19 19 19 19 19 20 20 20 20 20 20 20 20 Year Walawe 3600 3000 CRU B2 Extreme dry year 2400 [mm] 1800 1200 Extreme wet year 600 0 61 65 69 73 77 81 85 89 70 74 78 82 86 90 94 98 19 19 19 19 19 19 19 19 20 20 20 20 20 20 20 20 Year Nov-03
  • 28. Extreme years of precipitation in the Rhine Basin 1400 1200 1000 [mm] 800 600 Extreme dry year 400 200 0 Extreme wet year 61 65 69 73 77 81 85 89 70 74 78 82 86 90 94 98 19 19 19 19 19 19 19 19 20 20 20 20 20 20 20 20 Year Extreme years of precipitation in the Syr Darya Basin 700 600 500 [mm] 400 300 Extreme dry year 200 100 Extreme wet year 0 61 65 69 73 77 81 85 89 70 74 78 82 86 90 94 98 19 19 19 19 19 19 19 19 20 20 20 20 20 20 20 20 Year Extreme years of precipitation in the Volta Basin 2000 1500 Extreme dry year [mm] 1000 Extreme wet year 500 0 61 65 69 73 77 81 85 89 70 74 78 82 86 90 94 98 19 19 19 19 19 19 19 19 20 20 20 20 20 20 20 20 Year Nov-03
  • 29. Extreme years of precipitation in the Zayandeh Rud Basin 600 400 [mm] Extreme dry year 200 0 Extreme wet year 61 65 69 73 77 81 85 89 70 74 78 82 86 90 94 98 19 19 19 19 19 19 19 19 20 20 20 20 20 20 20 20 Year Nov-03
  • 30. Changes in crop yield & water resources Nov-03
  • 31. Changes in crop yield & water resources Use models & expert knowledge Hydrological models Food production models (dif. Scales) Nov-03
  • 32. SWAP model at field scale Irrigation Precipitation Transpiration Evaporation Surface runoff Unsaturated zone Transport: - water - heat - solutes Drainage/ Saturated subsurface zone infiltration Properties: Deep groundwater - water retention - hydraulic conductivity Nov-03
  • 33. Food production models Yield Walawe / Sri Lanka Nov-03
  • 34. Yield BAU, HADCM3_A2 Zay_Wheat Zay_Rice Wal_Vege Wal_Rice Vol_Maize Vol-Rice Syr_Wheat Syr_Cotton Sac_Tomato Sac_Rice Rhi_Wheat Rhi_SugB Mek_Maize 2010-2039 2070-2099 Mek_Rice -60% -40% -20% 0% 20% 40% 60% Changes in Yield (%) Nov-03
  • 35. Effective temperature for rice 30 temperature sum (oC) Daily increase in 25 20 15 10 5 0 0 10 20 30 40 50 Daily average temperature (oC) Nov-03
  • 36. Max, min & average temperature Maximum temperature (oC) 45 40 35 30 25 20 Minimum temperature (oC) 1961 1971 1981 1991 2001 2011 2021 2031 2041 2051 2061 2071 2081 2091 30 Year 25 A2 20 15 10 Mean temperature 5 (oC) 35 1961 1971 1981 1991 2001 2011 2021 2031 2041 2051 2061 2071 2081 2091 Year 30 25 20 15 1961 1971 1981 1991 2001 2011 2021 2031 2041 2051 2061 2071 2081 2091 Year Nov-03
  • 37. Food production – Syr Darya Wheat Production 2070-99 (mln t) 6 A2: less water less food 5 4 A2 B2 3 Average Farm Income 2070-99 (USD/farm) 2 5000 1 0 4000 1961-90 NA E F I M 3000 A2 B2 2000 Cotton Production 2070-99 (mln t) 1000 3 0 1961-90 NA E F I M A2 2 B2 1 B2: more water more food 0 1961-90 NA E F I M Nov-03
  • 38. Walawe - Impact on Food Security 60% 1961-1990 2010-2030 50% 2070-2099 40% Low Yield Years 30% 20% 10% 0% 0.95 0.90 0.85 0.80 0.75 0.70 Threshold Value Number of years with low yields, defined as a year where total rice production is lower than the 5 years moving average considering a Nov-03 defined Threshold Value.
  • 40. SLURP model Mekong river sub-basins Area Sub-basin Raster 0.5 degree (km2) Mun 60,912 Chi 55,985 Chi-Mun 4,175 Lancang 225,562 Nam Ou 30,708 Nam Ngum 8,886 Mekong 1 156,509 Mekong 2 20,558 Sekong 28,601 Srepok 48,318 Mekong 3 27,701 Tonlesap 86,594 China Delta 40,492 Total 795,000 Myanmar Vietnam Lao PDR ThailandMEKONG BASIN Cambodia Climate station with long records Nov-03
  • 41. Changes in Mekong flow Monthly Q - A2 - Mekong 3 Q (m3/s) Monthly Q - A2 - Delta Q (m3/s) 70,000 70,000 60,000 60,000 50,000 50,000 40,000 40,000 30,000 30,000 20,000 20,000 10,000 10,000 0 0 1961 1971 1981 1991 2001 2011 2021 2031 2041 2051 2061 2071 2081 2091 1961 1971 1981 1991 2001 2011 2021 2031 2041 2051 2061 2071 2081 2091 Month Month Q (m3/s) Q (m3/s) Monthly Q - B2 - Delta Monthly Q - B2 - Mekong 3 70,000 70,000 60,000 60,000 50,000 50,000 40,000 40,000 30,000 30,000 20,000 20,000 10,000 10,000 0 0 1961 1971 1981 1991 2001 2011 2021 2031 2041 2051 2061 2071 2081 2091 1961 1971 1981 1991 2001 2011 2021 2031 2041 2051 2061 2071 2081 2091 Month Month Nov-03
  • 42. RHINEFLOW-2 model Discharge Rhine Basin Current vs A2 scenario Current 2010-2039 2070-2099 Nov-03
  • 43. Mekong - changes in water resources Higher flood and more droughts in A2, 2010-39 Nov-03
  • 45. Four Adaptation Strategies Environmental focused Food focused Industry/Energy Focused Mix of the above Nov-03
  • 46. Measures Adaptation Strategies ‘E’: Environmental measures Mekong Rhine Volta Field / Management/policy scale: 1. Side path Salmon Env. adaptation Env. adaptation Env. adaptation 2. Open reservoir in dry period strategy strategy strategy 3. Use less fertilizer 4. Develop sewage treatment plants 1 E3, E4, E5, E7 E3, E4, E6 E2, E4, E8 5. Develop dikes & protection 6. Construct flood regulation area F6 F7 F1 7. Regulate mangrove lodging 8. Protect wetlands (RAMSAR) Food adaptation Food adaptation Food adaptation strategy strategy strategy 2 E4 E6 E4 ‘F’: Food security measures F2, F5, F9 F1, F2, F3, F5 F1, F2, F3, F5 Farmers/manager/policy scale: 1. Rainfed to irrigation ETC 2. Increase crop intensity Ind. adaptation Ind. adaptation Ind. adaptation 3. Salinity control strategy strategy strategy 4. Increase water storage capacity 5. Re-use waste water 3 F4 E6 F7 6. Desalinisation I1 I2 I3 7. Water pricing 8. Water rights 9. Insurance arrangements Mixed adaptation Mixed adaptation Mixed adaptation strategy strategy strategy 1. ‘I’:. Industrial measures Built new reservoirs 4 E3, E4, E5 E4, E6 E2, E4 2. Develop sluice / barrages F1, F2, F3 F2, F5 F1, F2 3. Sell Kw for Food I1 I2 I3 Nov-03
  • 47. Scenarios for Mekong No. Scenario Objective Agriculture Reforestation development 1 Baseline Current trend Developed for Current without CC food 2 CC-NoAgri Effects of CC Current Current 3 CC-Agri Effects of CC & Developed for Current agriculture food 4 CC-AgriFor Effects of CC, Developed for Reforestation of agriculture & food all shrub land forestry (17.7%) by mixed forest Nov-03
  • 48. Scenario CC-NoAgri: higher flood, deeper salinity intrusion Monthly discharge (m3/s) % change Daily discharge (m3/s) % change Sub-basin Mekong 3 Delta Mekng 3 Delta Mekong 3 Delta Mekng 3 Delta Max 61_90 40,995 45,681 54,829 51,161 Min 61_90 560 1,857 Ave 61_90 12,894 15,459 Scenario A2 Max 10_39 46,635 45,091 14 -1 57,387 50,294 5 -2 Min 10_39 574 1,726 2 -7 Ave 10_39 12,940 15,399 0 0 Max 70_99 57,659 54,269 41 19 74,055 66,439 35 30 Min 70_99 424 1,370 -24 -26 Ave 70_99 15,147 17,698 17 14 Scenario B2 Max 10_39 45,163 45,271 10 -1 54,016 50,188 -1 -2 Min 10_39 592 1,588 6 -15 Ave 10_39 12,973 15,397 1 0 Max 70_99 55,168 53,181 35 16 62,118 58,696 13 15 Min 70_99 466 1,311 -17 -29 Ave 70_99 13,672 16,140 6 4 Nov-03
  • 49. Scenario CC-Agri: higher flood, deeper salinity intrusion Monthly discharge (m3/s) % change Daily discharge (m3/s) % change Sub-basin Mekong 3 Delta Mekng 3 Delta Mekong 3 Delta Mekng 3 Delta Max 61_90 40,995 45,681 54,829 51,161 Min 61_90 560 1,857 Ave 61_90 12,894 15,459 Scenario A2 Max 10_39 46,646 45,446 14 -1 57,629 50,533 5 -1 Min 10_39 574 1,726 2 -7 Ave 10_39 12,843 15,230 0 -1 Max 70_99 57,723 54,497 41 19 74,178 66,648 35 30 Min 70_99 424 1,370 -24 -26 Ave 70_99 14,967 17,439 16 13 Scenario B2 Max 10_39 45,504 45,264 11 -1 53,979 50,165 -2 -2 Min 10_39 592 1,484 6 -20 Ave 10_39 12,884 15,245 0 -1 Max 70_99 55,106 53,138 34 16 62,070 58,655 13 15 Min 70_99 466 1,305 -17 -30 Ave 70_99 13,512 15,902 5 3 Nov-03
  • 50. Scenario CC-AgriFor: less severe flood Monthly discharge (m3/s) % change Daily discharge (m3/s) % change Mekong Mekong Sub-basin Mekong 3 Delta 3 Delta Mekong 3 Delta 3 Delta Max 61_90 40,995 45,681 54,829 51,161 Min 61_90 560 1,857 Ave 61_90 12,894 15,459 Scenario A2 Max 10_39 42,376 43,190 3 -5 57,410 49,928 5 -2 Min 10_39 508 1,634 -9 -12 Ave 10_39 11,905 14,119 -8 -9 Max 70_99 53,370 52,770 30 16 71,874 64,245 31 26 Min 70_99 412 1,356 -26 -27 Ave 70_99 13,809 16,103 7 4 Scenario B2 Max 10_39 44,536 41,725 9 -9 53,068 48,221 -3 -6 Min 10_39 533 1,423 -5 -23 Ave 10_39 11,942 14,132 -7 -9 Max 70_99 54,967 52,735 34 15 66,124 59,099 21 16 Min 70_99 394 1,149 -30 -38 Nov-03
  • 51. Conclusions on basin CC Adjust GCM data to regional conditions => improve regional projections CC has a clear impact on food & water in all basins. However, not all changes cause negative impacts in Env. and/or Food. Nov-03
  • 52. Socio-Economic Socio & Climate Drivers What we have done? Pressures 1. Described ‘Pressures, issues, problems’ ‘Issues & Problems’ 2. Development of Drivers (population & CC/CV) Adaptation strategies ‘State’ Changes 3. Simulation of Changes (food / hydrology) Stakeholders 4. Development and evaluation of Adaptation str. Impacts Impacts What to be done? 5. Cost benefit analysis 6. Link basin to global scale 7. Stakeholder involvement Nov-03
  • 53. Link basin strategies to global developments….. Change in suitability for rain-fed wheat (HadCM3-A1FI, 2080s). Fisher et al. 2002 Global Water and Agricultural: Climate Variability and Change Assessment Global model: Mark Rosegrant (IFPRI) / Ken Strzspek (Univ. Colorado) Nov-03
  • 54. World market Market Food Prices Influenced by Climate Change changes World food prices under climate 8 P rices R elative to C u rren t P rices 7 6 MaxPlank B2 2020 MaxPlank B2 2080 5 Hadley A1 2020 4 Hadley A1 2080 Hadley B2 2020 3 Hadley B2 2080 2 1 Rice Wheat Maize Other Grain Soy Cassava and R&T Crop Nov-03
  • 55. ! - Yes, but also White House effects Another challenge: adaptation to adaptation strategies Applied by others, including natural & human systems (Ex. people in delta have to adapt to local CC and also adapt to strategies of upstream people => may we agree a common strategies for the whole basin?) Nov-03
  • 56. THANK YOU FOR YOUR ATTENTION