SlideShare ist ein Scribd-Unternehmen logo
1 von 6
Downloaden Sie, um offline zu lesen
Prioritization Matrices

This tool can help you decide what to do after key actions, criteria or Critical-To-Quality (CTQ)
characteristics have been identified, but their relative importance (priority) is not known with
certainty. Prioritization matrices are especially useful if problem-solving resources, such as people,
time or money, are limited, or if the identified problem-solving actions or CTQs are strongly
interrelated.

To create a matrix, you must judge the relative ability of each possible action to effectively deliver the
results you want compared to every other identified action. The product of your work is a weighted
ranking of all the possible actions you are considering. The finished matrix can help a team make an
overall decision or determine the sequence in which to attack a problem or work toward an objective.

Prioritization matrices are especially useful in the project bounding and analyze phases of Lean Six
Sigma quality.

What can it do for you?
You should consider creating a prioritization matrix if:
    You cannot do everything at once,
    You are uncertain about the best use of your resources or energy or
    You are looking toward specific improvement goals.

This tool can also help you make a decision in situations where the criteria for a good solution are
known or accepted, but their relative importance is either unknown or disputed. For example, a
prioritization matrix might be used to help decide the purchase of a major piece of equipment or the
selection of a single-source supplier. Depending on how much time you have and how complex your
problem is, there are a number of options for constructing a prioritization matrix.

How do you do it?
1. The first step in applying the Full Analytical Criteria Method is to ensure that the people working
   on the matrix agree on the ultimate goal they are trying to achieve.

2. Next, create a list of criteria or characteristics needed to achieve the goal or meet the objective.
   (The idea is simply to list the criteria without considering their relative importance. That happens
   later.) The team can do this by discussion or brainstorming. The purpose is to list all of the criteria
   that might be applied to all of the options. For example, if the team is considering which
   improvement step to attack first, some of their criteria might be:
            a. Low investment cost
            b. Maximum use of existing technology                         Note the way the criteria
            c. High potential dollar savings                              are worded. They should
            d. High improvement potential for process speed              clearly convey the desired
            e. High improvement potential for defect reduction                  outcome. “Low
            f. High customer satisfaction potential                          investment cost” is a
            g. Minimum impact on other processes                           much clearer criterion
            h. Ease of implementation                                       than “cost” would be.
            i. High probability of quick results
Criteria being compared to                                                                                   Row


                                                                                                         Minimal impact


                                                                                                                                      Quick Results
                                                                                          Satisfaction
                                         technology


                                                                              Decreased


                                                                                                                          implement
                                                                                           Customer
                                                                  Increased


                                                                                                                                                      Total
                              Low cost


                                                      Potential
                                                      Savings


                                                                                                                            Easy to
                                                                               defects
                                           Use of


                                                                    speed


                                                                                                                                                              %
         Criteria             a.           b.           c.          d.          e.            f.         g.                 h.          i.

  a. Low Cost                               5
  b. Use of Technology        0.2
  c. Potential Saving
  d. Increased Speed
  e. Decreased Defects
  f. Cutomer Satisfaction
  g. Minimum Impact
  h. Easy to Implement
  i. Quick Results

   Column Total

   3. Once the total list is developed, the next step is to judge the relative importance of each
      criterion compared to every other criterion. To do that, make an L-shaped matrix with all the
      criteria listed on both the horizontal and the vertical legs of the L.

Compare the importance of each criterion on the vertical side of the matrix to each criterion listed
along the horizontal side using these numeric weightings:

       1.0      = The criterion being considered is equally important or equally preferred when judged
                   against the criterion you are comparing it to.
       5.0      = The criterion being considered is significantly more important or more preferred.
       10.0     = The criterion is extremely more important or more preferred.
       0.2      = It is significantly less important or preferred.
       0.1      = It is extremely less important or preferred.

Although these specific numeric ratings are to some extent arbitrary, by applying them consistently in
a prioritization matrix, you will generate a valid understanding of relative importance. When
completing or interpreting the matrix, read across the rows (not down the columns). For example, if
criterion a was significantly more important than criterion b, where row a intersects column b write 5.
Remember that, if criterion a is significantly more important that criterion b, criterion b must be
significantly less important than criterion a. Where row b intersects column a write 0.2.

Continuing in a similar manner, compare each criterion to every other criterion, reach a decision about
relative importance, and enter the appropriate values. Do this until the matrix is full. Remember that,
whenever you compare two criteria, you should mark the rating where the row of the criterion being
compared intersects the column of the criterion you are comparing it to. The inverse of this value
should be entered where the column of the criterion being compared intersects the row of the criterion
you are comparing it to. That is, you should enter 1 and 1, 5 and 0.2, or 10 and 0.1 for each
comparison.
Add the values recorded in each column; then add the column totals to get the grand total.

  For Criterion:                            Option being compared to                                                                                    Row


                                            Equipment A


                                                          Equipment B


                                                                        Equipment C


                                                                                      Equipment D


                                                                                                                            Cellularize


                                                                                                                                          Cellularize
  c. High Money Saving


                                                                                                    Procedure

                                                                                                                Barcoding
                                 Proofing


                                                                                                                             Option 1


                                                                                                                                           Option 2
                                  Error


                                                                                                                                                        Total
                                                                                                       New
                                                New


                                                              New


                                                                            New


                                                                                          New


                                                                                                                                                                 %
  Potential


              Option               a.          b.            c.            d.            e.            f.       g.             h.            i.
     a.   Error Proofing                       5            1              5           10             1         0.2           5             1             28.2   16.7%
     b.   New Equipment A         0.2                      0.2             1            1            0.2        0.1          0.2            1              3.9    2.3%
     c.   New Equipment B          1           5                           5            5             5         0.2           5             1             27.2   16.2%
     d.   New Equipment C         0.2          1           0.2                         0.2           0.2        0.1           1            0.2             3.1    1.8%
     e.   New Equipment D         0.1          1           0.2             5                          1         0.1           5            0.2            12.6    7.5%
     f.   New Procedures           1           5           0.2             5            1                        1            1             1             15.2    9.0%
     g.   Barcoding                5          10            5             10           10              1                      5             5               51   30.3%
     h.   Cellularize Option 1    0.2          5           0.2             1           0.2             1        0.2                        0.2               8    4.8%
     i.   Cellularize Option 2     1           1            1              5            5              1        0.2            5                          19.2   11.4%

      Column Total                8.7         33             8            37          32.4          10.4        2.1         27.2           9.6           168.4 100.0%


Add the values recorded in each row, then add the row totals to get the grand total. The grand total
across the columns should agree with the grand total down the rows. If it does not, check your work.
Divide each row total by the grand total. This percentage is the weighting that shows the relative
importance of each criterion.

      4. Now that you know the relative importance of each criterion, the next step is to evaluate how
         well each of your possible choices meet each of the weighted criteria. Those possible choices
         could be such things as which improvement steps to take first, which piece of equipment to buy
         or which supplier to use.

To complete this step, make a new L-shaped matrix with all your possible choices on both the
horizontal and the vertical legs. If you are considering which improvement steps to take, your possible
choices might look something like this:

A.        Error prevention training                                                   F.       Rewrite procedures for clarity
B.        Purchase new equipment A                                                    G.       Implement bar-coding
C.        Purchase new equipment B                                                    H.       Cellularize operation 1
D.        Refurbish existing equipment C                                              I.       Cellularize operation 2
E.        Refurbish existing equipment D

      5. Pick the first criterion you wish to consider and compare each possible choice with every other
         possible choice by asking how well it will deliver that criterion or characteristic. For example,
         if the first criterion you were considering was high potential dollar savings, you would
         compare each option with every other option, in terms of its potential to deliver high monetary
savings. Build the matrix as you did when initially evaluating the relative importance of the
         criteria by putting numeric values in the matrix intersections:

   1.0            = The choice being considered is equally able to deliver the desired criterion or equally
                    preferred when judged against the choice you are comparing it to.
   5.0            = The choice being considered is significantly more important or more preferred.
   10.0           = The choice is extremely more important or more preferred.
   0.2            = It is significantly less important or preferred.
   0.1            = It is extremely less important or preferred. Complete the matrix; add the rows and
                    columns and calculate the percentages as you did with the criteria matrix.


                                            Criteria being compared to                                                                      Row


                                                                                             Satisfaction
                                            technology


                                                                                 Decreased


                                                                                                                      implement
                                                                                              Customer
                                                                     Increased


                                                                                                                                            Total
                                 Low cost


                                                         Potential
                                                         Savings


                                                                                                            Minimal


                                                                                                                                  Results
                                                                                                                        Easy to
                                                                                  defects


                                                                                                            impact
                                              Use of


                                                                       speed


                                                                                                                                   Quick


                                                                                                                                                     %
           Criteria              a.           b.           c.          d.          e.            f.          g.         h.          i.
  a.   Low Cost                                5          0.1         0.2         0.1          0.2            1          5          1         12.6    7.5%
  b.   Use of Technology        0.2                       0.2         0.2         0.2          0.2            5          1          1            8    4.8%
  c.   Potential Saving         10            5                        5           5            5            10         10          1           51   30.3%
  d.   Increased Speed           5            5           0.2                      1            1             1          5          1         19.2   11.4%
  e.   Decreased Defects        10            5           0.2          1                        1             5          5          1         28.2   16.7%
  f.   Cutomer Satisfaction      5            5           0.2          1           1                          5          5          5         27.2   16.2%
  g.   Minimum Impact            1           0.2          0.1          1          0.2          0.2                       1         0.2         3.9    2.3%
  h.   Easy to Implement        0.2           1           0.1         0.2         0.2          0.2            1                    0.2         3.1    1.8%
  i.   Quick Results             1            1            1           1           1           0.2            5          5                    15.2    9.0%

   Column Total                 32.4        27.2          2.1         9.6         8.7            8           33         37        10.4       168.4 100.0%


The example above is what a matrix comparing the possible choices for high potential for dollar
savings might look like.

   6. In the same way; complete a matrix comparing each of the possible choices for each of the
      remaining criteria. If we did that for all our criteria, we would have to create a total of nine
      matrices comparing every combination of possible choices for its relative ability to deliver on
      each of the identified criteria.

You may choose to simplify this process by eliminating some criteria that had a very low percentage
weighting. (In our example, we limited ourselves to the five highest-ranking criteria. Besides the
matrix for high potential dollar savings, we would create additional matrices for high improvement
potential for process speed, high improvement potential for defect reduction, high customer
satisfaction potential and high probability of quick results. These additional matrices are not shown
here.)

   7. The final step in the Full Analytical Criteria Method is to merge the relative ability of a
      possible choice to deliver a desired criterion with the relative weighting of that criterion. To do
this, make a new L-shaped matrix with all the options or possible choices on the vertical leg
          and all the criteria considered on the horizontal leg. Make the columns fairly wide to allow
          some calculation.

Again, in our example, we eliminated some of the criteria to make things simpler.

         Under each criterion, in the weight row, note the percentage weighting you got from your first
          matrix, the one that compared each criterion with every other criterion.
         In each criterion column, enter the percentage numbers you got when you compared each
          option with every other option for that criterion. (The actual matrices for criteria d, e, f and i
          are not shown.) Enter these numbers as the first numbers in each column of the completed
          prioritization matrix.
         Multiply each option percentage by the criterion percentage weight for that criterion. (The
          results are the second numbers, the ones after the equal signs in our example.)
         Add the results of your multiplication down each column. The result for each column should
          be approximately the same as that criterion’s percentage weight (the number in the weight
          row).


                                                                  Criteria   High
                                                                                                                       Row
                                High potential


                                                                                                       Quick Results
                                                  Highpotential


                                                                                     satisfaction
                                                                     decrease of


                                                                                      Customer
                                   savings


                                                                       defects
                                                     speed


                                                                                                                       Total

                                                                                                                                %
                                                       d.
                                      c.


                                                                                           f.


                                                                                                             i.
                                                                   e.


                                Weight             Weight           Weight            Weight          Weight
          Options               .303 X             .114 X           .167 X            .162 X          .090 X
  a.   Error Proofing         .167 = .051        .111 = .013      .074 = .012       .169 = .027     .167 = .018        0.121   14.4%
  b.   New Equipment A        .023 = .007        .131 = .015      .060 = .010       .041 = .007     .028 = .003        0.042    5.0%
  c.   New Equipment B        .162 = .049        .091 = .010      .089 = .015       .153 = .025     .096 = .009        0.108   12.9%
  d.   New Equipment C        .018 = .005        .223 = .025      .087 = .015       .113 = .018     .079 = .007        0.070    8.4%
  e.   New Equipment D        .075 = .023        .184 = .021      .173 = .029       .274 = .044     .224 = .020        0.137   16.3%
  f.   New Procedures         .090 = .027        .029 = .003      .214 = .036       .029 = .005     .091 = .008        0.079    9.4%
  g.   Barcoding              .303 = .092        .037 = .004      .101 = .017       .147 = .024     .063 = .006        0.143   17.1%
  h.   Cellularize Option 1   .048 = .015        .104 = .012      .093 = .016       .044 = .007     .175 = .016        0.066    7.9%
  i.   Cellularize Option 2   .114 = .035        .090 = .010      .109 = .018       .030 = .005     .047 = .004        0.072    8.6%

   Column Total                  0.304             0.113            0.168             0.162           0.091            0.838   100.0%


         Add the column total row to come up with a grand total.
         Now, add the results of your multiplication across each row, and add the row total column. The
          result should be the same as the grand total you got by adding the column total row.
         Divide each row total by the grand total to get the percentage for each option. (Add the
          percentage scores as a check. The sum should be approximately 100 %.) This is the answer to
          your question.
         These numbers show the relative value of a number of options or possible choices when
          considered against a collection of independent criteria or critical to quality (CTQ)
          characteristics.
Now what?
Any time a choice must be made, some form of prioritization occurs. Those responsible for making the
choice may play a hunch, take a vote or analyze for some specific impact they think is important, but
they will decide what they think is best, most important or should be done first. If the prioritization
process is incomplete or arbitrary, chances of success are lessened.

The discipline of a prioritization matrix allows you to avoid setting arbitrary priorities that have less
likelihood of helping you reach your desired objectives. The Full Analytical Method does take
considerable time and effort, however, and should be used only if the risks or potential benefits make
it worthwhile.

                      Steven Bonacorsi is the President of the International Standard for Lean Six
                      Sigma (ISLSS) and Certified Lean Six Sigma Master Black Belt instructor and
                      coach. Steven Bonacorsi has trained hundreds of Master Black Belts, Black
                      Belts, Green Belts, and Project Sponsors and Executive Leaders in Lean Six
                      Sigma DMAIC and Design for Lean Six Sigma process improvement
                      methodologies.
                                                    Author for the Process Excellence Network (PEX
                                                    Network / IQPC). FREE Lean Six Sigma and BPM
                                                    content

                       International Standard for Lean Six Sigma
                       Steven Bonacorsi, President and Lean Six Sigma Master Black Belt
                       47 Seasons Lane, Londonderry, NH 03053, USA
                       Phone: + (1) 603-401-7047
                       Steven Bonacorsi e-mail
                       Steven Bonacorsi LinkedIn
                       Steven Bonacorsi Twitter
                       Lean Six Sigma Group

Weitere ähnliche Inhalte

Mehr von Steven Bonacorsi

Improve phase lean six sigma tollgate template
Improve phase   lean six sigma tollgate templateImprove phase   lean six sigma tollgate template
Improve phase lean six sigma tollgate templateSteven Bonacorsi
 
Measure phase lean six sigma tollgate template
Measure phase   lean six sigma tollgate templateMeasure phase   lean six sigma tollgate template
Measure phase lean six sigma tollgate templateSteven Bonacorsi
 
Lean six sigma tollgate checklists
Lean six sigma tollgate checklistsLean six sigma tollgate checklists
Lean six sigma tollgate checklistsSteven Bonacorsi
 
Control phase lean six sigma tollgate template
Control phase   lean six sigma tollgate templateControl phase   lean six sigma tollgate template
Control phase lean six sigma tollgate templateSteven Bonacorsi
 
Bringing program excellence to process excellence
Bringing program excellence to process excellenceBringing program excellence to process excellence
Bringing program excellence to process excellenceSteven Bonacorsi
 
14th Annual Asian Lean Six Sigma And Process Improvement Summit
14th Annual Asian Lean Six Sigma And Process Improvement Summit14th Annual Asian Lean Six Sigma And Process Improvement Summit
14th Annual Asian Lean Six Sigma And Process Improvement SummitSteven Bonacorsi
 
Advanced Performance Measurement Workshop Develop Measures That Drive Perform...
Advanced Performance Measurement Workshop Develop Measures That Drive Perform...Advanced Performance Measurement Workshop Develop Measures That Drive Perform...
Advanced Performance Measurement Workshop Develop Measures That Drive Perform...Steven Bonacorsi
 
Performance Strategy & Change Management Brochure 11 13 2012
Performance Strategy & Change Management Brochure 11 13 2012Performance Strategy & Change Management Brochure 11 13 2012
Performance Strategy & Change Management Brochure 11 13 2012Steven Bonacorsi
 
Is There Any Strategy In Your Strategic Plan
Is There Any Strategy In Your Strategic PlanIs There Any Strategy In Your Strategic Plan
Is There Any Strategy In Your Strategic PlanSteven Bonacorsi
 
Make Performance Improvement Strategic
Make Performance Improvement StrategicMake Performance Improvement Strategic
Make Performance Improvement StrategicSteven Bonacorsi
 
Improve Your Performance News
Improve Your Performance NewsImprove Your Performance News
Improve Your Performance NewsSteven Bonacorsi
 
Bsci Strategic Management Maturity Model
Bsci Strategic Management Maturity ModelBsci Strategic Management Maturity Model
Bsci Strategic Management Maturity ModelSteven Bonacorsi
 
Using The Balanced Scorecard To Align
Using The Balanced Scorecard To AlignUsing The Balanced Scorecard To Align
Using The Balanced Scorecard To AlignSteven Bonacorsi
 
Ultimate Bsc Sports Metaphor
Ultimate Bsc Sports MetaphorUltimate Bsc Sports Metaphor
Ultimate Bsc Sports MetaphorSteven Bonacorsi
 
Technology Company Balanced Scorecard Systems 06222010 Final
Technology Company Balanced Scorecard Systems 06222010 FinalTechnology Company Balanced Scorecard Systems 06222010 Final
Technology Company Balanced Scorecard Systems 06222010 FinalSteven Bonacorsi
 
Build Innovation Into Your Strategy
Build Innovation Into Your StrategyBuild Innovation Into Your Strategy
Build Innovation Into Your StrategySteven Bonacorsi
 
IGrafx Performance Management Whitepaper
IGrafx Performance Management WhitepaperIGrafx Performance Management Whitepaper
IGrafx Performance Management WhitepaperSteven Bonacorsi
 
IGrafx Multinational Case Study
IGrafx Multinational Case StudyIGrafx Multinational Case Study
IGrafx Multinational Case StudySteven Bonacorsi
 

Mehr von Steven Bonacorsi (20)

Improve phase lean six sigma tollgate template
Improve phase   lean six sigma tollgate templateImprove phase   lean six sigma tollgate template
Improve phase lean six sigma tollgate template
 
Measure phase lean six sigma tollgate template
Measure phase   lean six sigma tollgate templateMeasure phase   lean six sigma tollgate template
Measure phase lean six sigma tollgate template
 
Lean six sigma tollgate checklists
Lean six sigma tollgate checklistsLean six sigma tollgate checklists
Lean six sigma tollgate checklists
 
Control phase lean six sigma tollgate template
Control phase   lean six sigma tollgate templateControl phase   lean six sigma tollgate template
Control phase lean six sigma tollgate template
 
Bringing program excellence to process excellence
Bringing program excellence to process excellenceBringing program excellence to process excellence
Bringing program excellence to process excellence
 
14th Annual Asian Lean Six Sigma And Process Improvement Summit
14th Annual Asian Lean Six Sigma And Process Improvement Summit14th Annual Asian Lean Six Sigma And Process Improvement Summit
14th Annual Asian Lean Six Sigma And Process Improvement Summit
 
Advanced Performance Measurement Workshop Develop Measures That Drive Perform...
Advanced Performance Measurement Workshop Develop Measures That Drive Perform...Advanced Performance Measurement Workshop Develop Measures That Drive Perform...
Advanced Performance Measurement Workshop Develop Measures That Drive Perform...
 
Performance Strategy & Change Management Brochure 11 13 2012
Performance Strategy & Change Management Brochure 11 13 2012Performance Strategy & Change Management Brochure 11 13 2012
Performance Strategy & Change Management Brochure 11 13 2012
 
Is There Any Strategy In Your Strategic Plan
Is There Any Strategy In Your Strategic PlanIs There Any Strategy In Your Strategic Plan
Is There Any Strategy In Your Strategic Plan
 
Make Performance Improvement Strategic
Make Performance Improvement StrategicMake Performance Improvement Strategic
Make Performance Improvement Strategic
 
Improve Your Performance News
Improve Your Performance NewsImprove Your Performance News
Improve Your Performance News
 
A Balancing Act
A Balancing ActA Balancing Act
A Balancing Act
 
Bsci Strategic Management Maturity Model
Bsci Strategic Management Maturity ModelBsci Strategic Management Maturity Model
Bsci Strategic Management Maturity Model
 
Using The Balanced Scorecard To Align
Using The Balanced Scorecard To AlignUsing The Balanced Scorecard To Align
Using The Balanced Scorecard To Align
 
Ultimate Bsc Sports Metaphor
Ultimate Bsc Sports MetaphorUltimate Bsc Sports Metaphor
Ultimate Bsc Sports Metaphor
 
Themes Of Confusion
Themes Of ConfusionThemes Of Confusion
Themes Of Confusion
 
Technology Company Balanced Scorecard Systems 06222010 Final
Technology Company Balanced Scorecard Systems 06222010 FinalTechnology Company Balanced Scorecard Systems 06222010 Final
Technology Company Balanced Scorecard Systems 06222010 Final
 
Build Innovation Into Your Strategy
Build Innovation Into Your StrategyBuild Innovation Into Your Strategy
Build Innovation Into Your Strategy
 
IGrafx Performance Management Whitepaper
IGrafx Performance Management WhitepaperIGrafx Performance Management Whitepaper
IGrafx Performance Management Whitepaper
 
IGrafx Multinational Case Study
IGrafx Multinational Case StudyIGrafx Multinational Case Study
IGrafx Multinational Case Study
 

Kürzlich hochgeladen

Merck Moving Beyond Passwords: FIDO Paris Seminar.pptx
Merck Moving Beyond Passwords: FIDO Paris Seminar.pptxMerck Moving Beyond Passwords: FIDO Paris Seminar.pptx
Merck Moving Beyond Passwords: FIDO Paris Seminar.pptxLoriGlavin3
 
Generative AI for Technical Writer or Information Developers
Generative AI for Technical Writer or Information DevelopersGenerative AI for Technical Writer or Information Developers
Generative AI for Technical Writer or Information DevelopersRaghuram Pandurangan
 
DSPy a system for AI to Write Prompts and Do Fine Tuning
DSPy a system for AI to Write Prompts and Do Fine TuningDSPy a system for AI to Write Prompts and Do Fine Tuning
DSPy a system for AI to Write Prompts and Do Fine TuningLars Bell
 
Passkey Providers and Enabling Portability: FIDO Paris Seminar.pptx
Passkey Providers and Enabling Portability: FIDO Paris Seminar.pptxPasskey Providers and Enabling Portability: FIDO Paris Seminar.pptx
Passkey Providers and Enabling Portability: FIDO Paris Seminar.pptxLoriGlavin3
 
"ML in Production",Oleksandr Bagan
"ML in Production",Oleksandr Bagan"ML in Production",Oleksandr Bagan
"ML in Production",Oleksandr BaganFwdays
 
The State of Passkeys with FIDO Alliance.pptx
The State of Passkeys with FIDO Alliance.pptxThe State of Passkeys with FIDO Alliance.pptx
The State of Passkeys with FIDO Alliance.pptxLoriGlavin3
 
The Ultimate Guide to Choosing WordPress Pros and Cons
The Ultimate Guide to Choosing WordPress Pros and ConsThe Ultimate Guide to Choosing WordPress Pros and Cons
The Ultimate Guide to Choosing WordPress Pros and ConsPixlogix Infotech
 
New from BookNet Canada for 2024: Loan Stars - Tech Forum 2024
New from BookNet Canada for 2024: Loan Stars - Tech Forum 2024New from BookNet Canada for 2024: Loan Stars - Tech Forum 2024
New from BookNet Canada for 2024: Loan Stars - Tech Forum 2024BookNet Canada
 
SALESFORCE EDUCATION CLOUD | FEXLE SERVICES
SALESFORCE EDUCATION CLOUD | FEXLE SERVICESSALESFORCE EDUCATION CLOUD | FEXLE SERVICES
SALESFORCE EDUCATION CLOUD | FEXLE SERVICESmohitsingh558521
 
How to write a Business Continuity Plan
How to write a Business Continuity PlanHow to write a Business Continuity Plan
How to write a Business Continuity PlanDatabarracks
 
WordPress Websites for Engineers: Elevate Your Brand
WordPress Websites for Engineers: Elevate Your BrandWordPress Websites for Engineers: Elevate Your Brand
WordPress Websites for Engineers: Elevate Your Brandgvaughan
 
The Fit for Passkeys for Employee and Consumer Sign-ins: FIDO Paris Seminar.pptx
The Fit for Passkeys for Employee and Consumer Sign-ins: FIDO Paris Seminar.pptxThe Fit for Passkeys for Employee and Consumer Sign-ins: FIDO Paris Seminar.pptx
The Fit for Passkeys for Employee and Consumer Sign-ins: FIDO Paris Seminar.pptxLoriGlavin3
 
TeamStation AI System Report LATAM IT Salaries 2024
TeamStation AI System Report LATAM IT Salaries 2024TeamStation AI System Report LATAM IT Salaries 2024
TeamStation AI System Report LATAM IT Salaries 2024Lonnie McRorey
 
Use of FIDO in the Payments and Identity Landscape: FIDO Paris Seminar.pptx
Use of FIDO in the Payments and Identity Landscape: FIDO Paris Seminar.pptxUse of FIDO in the Payments and Identity Landscape: FIDO Paris Seminar.pptx
Use of FIDO in the Payments and Identity Landscape: FIDO Paris Seminar.pptxLoriGlavin3
 
Anypoint Exchange: It’s Not Just a Repo!
Anypoint Exchange: It’s Not Just a Repo!Anypoint Exchange: It’s Not Just a Repo!
Anypoint Exchange: It’s Not Just a Repo!Manik S Magar
 
Gen AI in Business - Global Trends Report 2024.pdf
Gen AI in Business - Global Trends Report 2024.pdfGen AI in Business - Global Trends Report 2024.pdf
Gen AI in Business - Global Trends Report 2024.pdfAddepto
 
Ensuring Technical Readiness For Copilot in Microsoft 365
Ensuring Technical Readiness For Copilot in Microsoft 365Ensuring Technical Readiness For Copilot in Microsoft 365
Ensuring Technical Readiness For Copilot in Microsoft 3652toLead Limited
 
What is DBT - The Ultimate Data Build Tool.pdf
What is DBT - The Ultimate Data Build Tool.pdfWhat is DBT - The Ultimate Data Build Tool.pdf
What is DBT - The Ultimate Data Build Tool.pdfMounikaPolabathina
 
Moving Beyond Passwords: FIDO Paris Seminar.pdf
Moving Beyond Passwords: FIDO Paris Seminar.pdfMoving Beyond Passwords: FIDO Paris Seminar.pdf
Moving Beyond Passwords: FIDO Paris Seminar.pdfLoriGlavin3
 
What's New in Teams Calling, Meetings and Devices March 2024
What's New in Teams Calling, Meetings and Devices March 2024What's New in Teams Calling, Meetings and Devices March 2024
What's New in Teams Calling, Meetings and Devices March 2024Stephanie Beckett
 

Kürzlich hochgeladen (20)

Merck Moving Beyond Passwords: FIDO Paris Seminar.pptx
Merck Moving Beyond Passwords: FIDO Paris Seminar.pptxMerck Moving Beyond Passwords: FIDO Paris Seminar.pptx
Merck Moving Beyond Passwords: FIDO Paris Seminar.pptx
 
Generative AI for Technical Writer or Information Developers
Generative AI for Technical Writer or Information DevelopersGenerative AI for Technical Writer or Information Developers
Generative AI for Technical Writer or Information Developers
 
DSPy a system for AI to Write Prompts and Do Fine Tuning
DSPy a system for AI to Write Prompts and Do Fine TuningDSPy a system for AI to Write Prompts and Do Fine Tuning
DSPy a system for AI to Write Prompts and Do Fine Tuning
 
Passkey Providers and Enabling Portability: FIDO Paris Seminar.pptx
Passkey Providers and Enabling Portability: FIDO Paris Seminar.pptxPasskey Providers and Enabling Portability: FIDO Paris Seminar.pptx
Passkey Providers and Enabling Portability: FIDO Paris Seminar.pptx
 
"ML in Production",Oleksandr Bagan
"ML in Production",Oleksandr Bagan"ML in Production",Oleksandr Bagan
"ML in Production",Oleksandr Bagan
 
The State of Passkeys with FIDO Alliance.pptx
The State of Passkeys with FIDO Alliance.pptxThe State of Passkeys with FIDO Alliance.pptx
The State of Passkeys with FIDO Alliance.pptx
 
The Ultimate Guide to Choosing WordPress Pros and Cons
The Ultimate Guide to Choosing WordPress Pros and ConsThe Ultimate Guide to Choosing WordPress Pros and Cons
The Ultimate Guide to Choosing WordPress Pros and Cons
 
New from BookNet Canada for 2024: Loan Stars - Tech Forum 2024
New from BookNet Canada for 2024: Loan Stars - Tech Forum 2024New from BookNet Canada for 2024: Loan Stars - Tech Forum 2024
New from BookNet Canada for 2024: Loan Stars - Tech Forum 2024
 
SALESFORCE EDUCATION CLOUD | FEXLE SERVICES
SALESFORCE EDUCATION CLOUD | FEXLE SERVICESSALESFORCE EDUCATION CLOUD | FEXLE SERVICES
SALESFORCE EDUCATION CLOUD | FEXLE SERVICES
 
How to write a Business Continuity Plan
How to write a Business Continuity PlanHow to write a Business Continuity Plan
How to write a Business Continuity Plan
 
WordPress Websites for Engineers: Elevate Your Brand
WordPress Websites for Engineers: Elevate Your BrandWordPress Websites for Engineers: Elevate Your Brand
WordPress Websites for Engineers: Elevate Your Brand
 
The Fit for Passkeys for Employee and Consumer Sign-ins: FIDO Paris Seminar.pptx
The Fit for Passkeys for Employee and Consumer Sign-ins: FIDO Paris Seminar.pptxThe Fit for Passkeys for Employee and Consumer Sign-ins: FIDO Paris Seminar.pptx
The Fit for Passkeys for Employee and Consumer Sign-ins: FIDO Paris Seminar.pptx
 
TeamStation AI System Report LATAM IT Salaries 2024
TeamStation AI System Report LATAM IT Salaries 2024TeamStation AI System Report LATAM IT Salaries 2024
TeamStation AI System Report LATAM IT Salaries 2024
 
Use of FIDO in the Payments and Identity Landscape: FIDO Paris Seminar.pptx
Use of FIDO in the Payments and Identity Landscape: FIDO Paris Seminar.pptxUse of FIDO in the Payments and Identity Landscape: FIDO Paris Seminar.pptx
Use of FIDO in the Payments and Identity Landscape: FIDO Paris Seminar.pptx
 
Anypoint Exchange: It’s Not Just a Repo!
Anypoint Exchange: It’s Not Just a Repo!Anypoint Exchange: It’s Not Just a Repo!
Anypoint Exchange: It’s Not Just a Repo!
 
Gen AI in Business - Global Trends Report 2024.pdf
Gen AI in Business - Global Trends Report 2024.pdfGen AI in Business - Global Trends Report 2024.pdf
Gen AI in Business - Global Trends Report 2024.pdf
 
Ensuring Technical Readiness For Copilot in Microsoft 365
Ensuring Technical Readiness For Copilot in Microsoft 365Ensuring Technical Readiness For Copilot in Microsoft 365
Ensuring Technical Readiness For Copilot in Microsoft 365
 
What is DBT - The Ultimate Data Build Tool.pdf
What is DBT - The Ultimate Data Build Tool.pdfWhat is DBT - The Ultimate Data Build Tool.pdf
What is DBT - The Ultimate Data Build Tool.pdf
 
Moving Beyond Passwords: FIDO Paris Seminar.pdf
Moving Beyond Passwords: FIDO Paris Seminar.pdfMoving Beyond Passwords: FIDO Paris Seminar.pdf
Moving Beyond Passwords: FIDO Paris Seminar.pdf
 
What's New in Teams Calling, Meetings and Devices March 2024
What's New in Teams Calling, Meetings and Devices March 2024What's New in Teams Calling, Meetings and Devices March 2024
What's New in Teams Calling, Meetings and Devices March 2024
 

Prioritization matrices

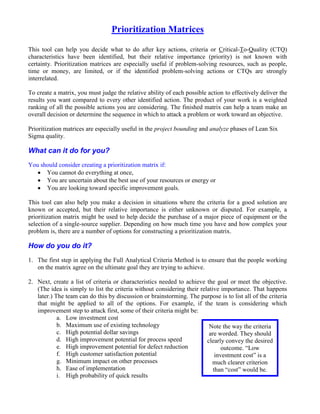
  • 1. Prioritization Matrices This tool can help you decide what to do after key actions, criteria or Critical-To-Quality (CTQ) characteristics have been identified, but their relative importance (priority) is not known with certainty. Prioritization matrices are especially useful if problem-solving resources, such as people, time or money, are limited, or if the identified problem-solving actions or CTQs are strongly interrelated. To create a matrix, you must judge the relative ability of each possible action to effectively deliver the results you want compared to every other identified action. The product of your work is a weighted ranking of all the possible actions you are considering. The finished matrix can help a team make an overall decision or determine the sequence in which to attack a problem or work toward an objective. Prioritization matrices are especially useful in the project bounding and analyze phases of Lean Six Sigma quality. What can it do for you? You should consider creating a prioritization matrix if:  You cannot do everything at once,  You are uncertain about the best use of your resources or energy or  You are looking toward specific improvement goals. This tool can also help you make a decision in situations where the criteria for a good solution are known or accepted, but their relative importance is either unknown or disputed. For example, a prioritization matrix might be used to help decide the purchase of a major piece of equipment or the selection of a single-source supplier. Depending on how much time you have and how complex your problem is, there are a number of options for constructing a prioritization matrix. How do you do it? 1. The first step in applying the Full Analytical Criteria Method is to ensure that the people working on the matrix agree on the ultimate goal they are trying to achieve. 2. Next, create a list of criteria or characteristics needed to achieve the goal or meet the objective. (The idea is simply to list the criteria without considering their relative importance. That happens later.) The team can do this by discussion or brainstorming. The purpose is to list all of the criteria that might be applied to all of the options. For example, if the team is considering which improvement step to attack first, some of their criteria might be: a. Low investment cost b. Maximum use of existing technology Note the way the criteria c. High potential dollar savings are worded. They should d. High improvement potential for process speed clearly convey the desired e. High improvement potential for defect reduction outcome. “Low f. High customer satisfaction potential investment cost” is a g. Minimum impact on other processes much clearer criterion h. Ease of implementation than “cost” would be. i. High probability of quick results
  • 2. Criteria being compared to Row Minimal impact Quick Results Satisfaction technology Decreased implement Customer Increased Total Low cost Potential Savings Easy to defects Use of speed % Criteria a. b. c. d. e. f. g. h. i. a. Low Cost 5 b. Use of Technology 0.2 c. Potential Saving d. Increased Speed e. Decreased Defects f. Cutomer Satisfaction g. Minimum Impact h. Easy to Implement i. Quick Results Column Total 3. Once the total list is developed, the next step is to judge the relative importance of each criterion compared to every other criterion. To do that, make an L-shaped matrix with all the criteria listed on both the horizontal and the vertical legs of the L. Compare the importance of each criterion on the vertical side of the matrix to each criterion listed along the horizontal side using these numeric weightings: 1.0 = The criterion being considered is equally important or equally preferred when judged against the criterion you are comparing it to. 5.0 = The criterion being considered is significantly more important or more preferred. 10.0 = The criterion is extremely more important or more preferred. 0.2 = It is significantly less important or preferred. 0.1 = It is extremely less important or preferred. Although these specific numeric ratings are to some extent arbitrary, by applying them consistently in a prioritization matrix, you will generate a valid understanding of relative importance. When completing or interpreting the matrix, read across the rows (not down the columns). For example, if criterion a was significantly more important than criterion b, where row a intersects column b write 5. Remember that, if criterion a is significantly more important that criterion b, criterion b must be significantly less important than criterion a. Where row b intersects column a write 0.2. Continuing in a similar manner, compare each criterion to every other criterion, reach a decision about relative importance, and enter the appropriate values. Do this until the matrix is full. Remember that, whenever you compare two criteria, you should mark the rating where the row of the criterion being compared intersects the column of the criterion you are comparing it to. The inverse of this value should be entered where the column of the criterion being compared intersects the row of the criterion you are comparing it to. That is, you should enter 1 and 1, 5 and 0.2, or 10 and 0.1 for each comparison.
  • 3. Add the values recorded in each column; then add the column totals to get the grand total. For Criterion: Option being compared to Row Equipment A Equipment B Equipment C Equipment D Cellularize Cellularize c. High Money Saving Procedure Barcoding Proofing Option 1 Option 2 Error Total New New New New New % Potential Option a. b. c. d. e. f. g. h. i. a. Error Proofing 5 1 5 10 1 0.2 5 1 28.2 16.7% b. New Equipment A 0.2 0.2 1 1 0.2 0.1 0.2 1 3.9 2.3% c. New Equipment B 1 5 5 5 5 0.2 5 1 27.2 16.2% d. New Equipment C 0.2 1 0.2 0.2 0.2 0.1 1 0.2 3.1 1.8% e. New Equipment D 0.1 1 0.2 5 1 0.1 5 0.2 12.6 7.5% f. New Procedures 1 5 0.2 5 1 1 1 1 15.2 9.0% g. Barcoding 5 10 5 10 10 1 5 5 51 30.3% h. Cellularize Option 1 0.2 5 0.2 1 0.2 1 0.2 0.2 8 4.8% i. Cellularize Option 2 1 1 1 5 5 1 0.2 5 19.2 11.4% Column Total 8.7 33 8 37 32.4 10.4 2.1 27.2 9.6 168.4 100.0% Add the values recorded in each row, then add the row totals to get the grand total. The grand total across the columns should agree with the grand total down the rows. If it does not, check your work. Divide each row total by the grand total. This percentage is the weighting that shows the relative importance of each criterion. 4. Now that you know the relative importance of each criterion, the next step is to evaluate how well each of your possible choices meet each of the weighted criteria. Those possible choices could be such things as which improvement steps to take first, which piece of equipment to buy or which supplier to use. To complete this step, make a new L-shaped matrix with all your possible choices on both the horizontal and the vertical legs. If you are considering which improvement steps to take, your possible choices might look something like this: A. Error prevention training F. Rewrite procedures for clarity B. Purchase new equipment A G. Implement bar-coding C. Purchase new equipment B H. Cellularize operation 1 D. Refurbish existing equipment C I. Cellularize operation 2 E. Refurbish existing equipment D 5. Pick the first criterion you wish to consider and compare each possible choice with every other possible choice by asking how well it will deliver that criterion or characteristic. For example, if the first criterion you were considering was high potential dollar savings, you would compare each option with every other option, in terms of its potential to deliver high monetary
  • 4. savings. Build the matrix as you did when initially evaluating the relative importance of the criteria by putting numeric values in the matrix intersections: 1.0 = The choice being considered is equally able to deliver the desired criterion or equally preferred when judged against the choice you are comparing it to. 5.0 = The choice being considered is significantly more important or more preferred. 10.0 = The choice is extremely more important or more preferred. 0.2 = It is significantly less important or preferred. 0.1 = It is extremely less important or preferred. Complete the matrix; add the rows and columns and calculate the percentages as you did with the criteria matrix. Criteria being compared to Row Satisfaction technology Decreased implement Customer Increased Total Low cost Potential Savings Minimal Results Easy to defects impact Use of speed Quick % Criteria a. b. c. d. e. f. g. h. i. a. Low Cost 5 0.1 0.2 0.1 0.2 1 5 1 12.6 7.5% b. Use of Technology 0.2 0.2 0.2 0.2 0.2 5 1 1 8 4.8% c. Potential Saving 10 5 5 5 5 10 10 1 51 30.3% d. Increased Speed 5 5 0.2 1 1 1 5 1 19.2 11.4% e. Decreased Defects 10 5 0.2 1 1 5 5 1 28.2 16.7% f. Cutomer Satisfaction 5 5 0.2 1 1 5 5 5 27.2 16.2% g. Minimum Impact 1 0.2 0.1 1 0.2 0.2 1 0.2 3.9 2.3% h. Easy to Implement 0.2 1 0.1 0.2 0.2 0.2 1 0.2 3.1 1.8% i. Quick Results 1 1 1 1 1 0.2 5 5 15.2 9.0% Column Total 32.4 27.2 2.1 9.6 8.7 8 33 37 10.4 168.4 100.0% The example above is what a matrix comparing the possible choices for high potential for dollar savings might look like. 6. In the same way; complete a matrix comparing each of the possible choices for each of the remaining criteria. If we did that for all our criteria, we would have to create a total of nine matrices comparing every combination of possible choices for its relative ability to deliver on each of the identified criteria. You may choose to simplify this process by eliminating some criteria that had a very low percentage weighting. (In our example, we limited ourselves to the five highest-ranking criteria. Besides the matrix for high potential dollar savings, we would create additional matrices for high improvement potential for process speed, high improvement potential for defect reduction, high customer satisfaction potential and high probability of quick results. These additional matrices are not shown here.) 7. The final step in the Full Analytical Criteria Method is to merge the relative ability of a possible choice to deliver a desired criterion with the relative weighting of that criterion. To do
  • 5. this, make a new L-shaped matrix with all the options or possible choices on the vertical leg and all the criteria considered on the horizontal leg. Make the columns fairly wide to allow some calculation. Again, in our example, we eliminated some of the criteria to make things simpler.  Under each criterion, in the weight row, note the percentage weighting you got from your first matrix, the one that compared each criterion with every other criterion.  In each criterion column, enter the percentage numbers you got when you compared each option with every other option for that criterion. (The actual matrices for criteria d, e, f and i are not shown.) Enter these numbers as the first numbers in each column of the completed prioritization matrix.  Multiply each option percentage by the criterion percentage weight for that criterion. (The results are the second numbers, the ones after the equal signs in our example.)  Add the results of your multiplication down each column. The result for each column should be approximately the same as that criterion’s percentage weight (the number in the weight row). Criteria High Row High potential Quick Results Highpotential satisfaction decrease of Customer savings defects speed Total % d. c. f. i. e. Weight Weight Weight Weight Weight Options .303 X .114 X .167 X .162 X .090 X a. Error Proofing .167 = .051 .111 = .013 .074 = .012 .169 = .027 .167 = .018 0.121 14.4% b. New Equipment A .023 = .007 .131 = .015 .060 = .010 .041 = .007 .028 = .003 0.042 5.0% c. New Equipment B .162 = .049 .091 = .010 .089 = .015 .153 = .025 .096 = .009 0.108 12.9% d. New Equipment C .018 = .005 .223 = .025 .087 = .015 .113 = .018 .079 = .007 0.070 8.4% e. New Equipment D .075 = .023 .184 = .021 .173 = .029 .274 = .044 .224 = .020 0.137 16.3% f. New Procedures .090 = .027 .029 = .003 .214 = .036 .029 = .005 .091 = .008 0.079 9.4% g. Barcoding .303 = .092 .037 = .004 .101 = .017 .147 = .024 .063 = .006 0.143 17.1% h. Cellularize Option 1 .048 = .015 .104 = .012 .093 = .016 .044 = .007 .175 = .016 0.066 7.9% i. Cellularize Option 2 .114 = .035 .090 = .010 .109 = .018 .030 = .005 .047 = .004 0.072 8.6% Column Total 0.304 0.113 0.168 0.162 0.091 0.838 100.0%  Add the column total row to come up with a grand total.  Now, add the results of your multiplication across each row, and add the row total column. The result should be the same as the grand total you got by adding the column total row.  Divide each row total by the grand total to get the percentage for each option. (Add the percentage scores as a check. The sum should be approximately 100 %.) This is the answer to your question.  These numbers show the relative value of a number of options or possible choices when considered against a collection of independent criteria or critical to quality (CTQ) characteristics.
  • 6. Now what? Any time a choice must be made, some form of prioritization occurs. Those responsible for making the choice may play a hunch, take a vote or analyze for some specific impact they think is important, but they will decide what they think is best, most important or should be done first. If the prioritization process is incomplete or arbitrary, chances of success are lessened. The discipline of a prioritization matrix allows you to avoid setting arbitrary priorities that have less likelihood of helping you reach your desired objectives. The Full Analytical Method does take considerable time and effort, however, and should be used only if the risks or potential benefits make it worthwhile. Steven Bonacorsi is the President of the International Standard for Lean Six Sigma (ISLSS) and Certified Lean Six Sigma Master Black Belt instructor and coach. Steven Bonacorsi has trained hundreds of Master Black Belts, Black Belts, Green Belts, and Project Sponsors and Executive Leaders in Lean Six Sigma DMAIC and Design for Lean Six Sigma process improvement methodologies. Author for the Process Excellence Network (PEX Network / IQPC). FREE Lean Six Sigma and BPM content International Standard for Lean Six Sigma Steven Bonacorsi, President and Lean Six Sigma Master Black Belt 47 Seasons Lane, Londonderry, NH 03053, USA Phone: + (1) 603-401-7047 Steven Bonacorsi e-mail Steven Bonacorsi LinkedIn Steven Bonacorsi Twitter Lean Six Sigma Group