Sustainable Soil Fertility Management: Emerging Issues and Future Challenges

1) The document lists the work experience of Cherukumalli Srinivasa Rao from 1992 to 2009 at various institutes including the National Academy of Agricultural Research and Management, Indian Institute of Soil Science, Indian Institute of Pulses Research, Central Research Institute for Dryland Agriculture, and the International Crops Research Institute for the Semi-Arid Tropics. 2) It then provides an outline for a presentation on sustainable soil fertility management and emerging issues and future challenges. The outline includes topics on potassium nutrition, nutrient deficiencies in rainfed agriculture, carbon sequestration strategies, and soil fertility management strategies from an African context. 3) Yield stagnation in grain legumes may

Empfohlen
Empfohlen
Weitere ähnliche Inhalte
Was ist angesagt?
Was ist angesagt? (19)
Andere mochten auch
Andere mochten auch (18)
Mehr von International Institute of Tropical Agriculture
Mehr von International Institute of Tropical Agriculture (20)
Kürzlich hochgeladen
Kürzlich hochgeladen (20)
Sustainable Soil Fertility Management: Emerging Issues and Future Challenges
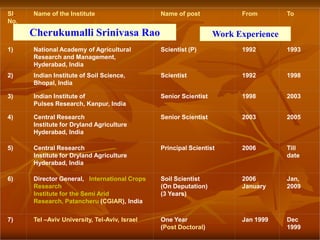
- 1. Sl. Name of the Institute Name of post From To No. Cherukumalli Srinivasa Rao Work Experience 1) National Academy of Agricultural Scientist (P) 1992 1993 Research and Management, Hyderabad, India 2) Indian Institute of Soil Science, Scientist 1992 1998 Bhopal, India 3) Indian Institute of Senior Scientist 1998 2003 Pulses Research, Kanpur, India 4) Central Research Senior Scientist 2003 2005 Institute for Dryland Agriculture Hyderabad, India 5) Central Research Principal Scientist 2006 Till Institute for Dryland Agriculture date Hyderabad, India 6) Director General, International Crops Soil Scientist 2006 Jan, Research (On Deputation) January 2009 Institute for the Semi Arid (3 Years) Research, Patancheru (CGIAR), India 7) Tel –Aviv University, Tel-Aviv, Israel One Year Jan 1999 Dec (Post Doctoral) 1999
- 2. Sustainable Soil Fertility Management: Emerging Issues and Future Challenges Cherukumalli Srinivasa Rao Central Research Institute for Dryland Agriculture, Hyderabad, Andhra Pradesh, India At International Institute for Tropical Agriculture Ibadan, Nigeria On 30-4-2009
- 3. Out Line Potassium nutrition of crop plants. Why to include nonexchangeable potassium in soil testing ? Whether nutrient management can break yield stagnation in grain legumes. Emerging nutrient deficiencies in rainfed agriculture! Are dryland soils are not only thirsty but also hungry ? Carbon sequestration strategies: Trends from long term manurial trials CGIAR Experiences Strategies for soil fertility management – from African context- Way forward !
- 4. I) Potassium nutrition of crop plants. Why to include nonexchangeable potassium in soil testing ? Nutrient uptake in long-term fertilizer experiments under intensive cropping systems in India Cropping Soil Yield Nutrient uptake (kg/ha/year) type (t/ha) N P K Total Maize- Incepti 6.8+0.6 240 45 250 535 wheat- sols cowpea (F) Maize- Molliso 9.5+1.9 260 65 295 620 wheat- ls cowpea (F) Soybean- Vertisol 6.3 285 44 225 554 wheat s Soybean- Alfisols 4.2 220 35 170 425 wheat
- 5. Fertilizer consumption ratios in India Consu 1960 1970 1980 1990 2001 2004 2005 mption -61 -71 -81 -91 -02 -05 -06 N 1.4 9.0 21 43 59 62 67 P2O5 0.4 3.3 7 17 23 24 27 K2O 0.2 1.4 4 7 9 11 13 Total 2 14 32 68 90 97 107 P2O5:K2 0.37: 0.37: 0.33: 0.40: 0.37: 0.39: 0.40: O 0.16 0.16 0.17 0.17 0.14 0.18 0.18 (N=1.0) Food Production in India Sub Continent 50 220 Million Tonnes
- 6. An illustrative balance sheet of NPK in Indian Agriculture (2001) (balance „000) Nutrient Additions Removal Balance N 10,933 9,613 1,310 P2O5 4,188 3,702 486 K2O 1,454 11,657 -10,202 Total 16,565 24,971 -8,406 Net Balance of K is Negative
- 7. Exchangeable and Nonexchangeable Potassium Status in Different Soil Types of India Exchangeable K in different soil types of India Nonexchagneable K in different soil types of India Surface Surface 140 Sub-surface 1200 Exchangeable K (mg kg ) Sub-surface ) -1 -1 Nonexchangeable K (mg kg 120 1000 100 800 80 600 60 40 400 20 200 0 0 Inceptisols Vertisols Alfisols Inceptisols Vertisols Alfisols Acidic red and lateritic soils, light textured and acidic alluvial and shallow black soils are deficient in K Srinivasa Rao et al., Soil Science (2001)
- 8. Cumulative K release from Bangalore profile Cumulative K release from Solapur profile under finger millet production system under rabi sorghum based production system 400 0-15 3000 0-15 Cum ulative K release Cum ulative K release 350 15-30 2500 15-30 300 30-45 30-45 (m g/kg) (m g/kg) 45-60 2000 250 45-60 60-75 1500 200 75-90 60-75 1000 75-90 150 90-105 500 90-105 100 I II III IV V VI VII VIII I II III IV V VI VII VIII Extraction No Extraction No Cumulative K release from Hoshiarpur profile under maize based production system Greater 2550 Srinivasa Rao et cumulative K release variations in K 0-15 al. Indian Soc. 2050 15-30 status (mg/kg) 1550 30-45 Soil Sci (2006) mineralogically 45-60 1050 different soil 60-75 550 types I II III IV V VI VII VIII 75-90 90-105 Extraction No
- 9. X-Ray diffraction intensity ratio of the peak heights of 001/002 basal reflection in the silt and clay fraction of some A.P.soils Soil Series Taxonomy Parent Size Fraction Material 50-2 um <2 um Kasireddipalli Vertisol Deccan 1.56 1.04 basalt Patancheru Alfisol Granite 1.77 1.80 gneiss Nalgonda Alfisol Granite 2.00 1.87 gneiss Mica or illite content in clay or silt fraction of soil is important factor for K supplying power of particular soil Srinivasa Rao et al. J. Plant Nutrition and Soil Sci. 1998
- 10. Exchangeable K (mg/kg) 350 300 250 Continues cropping reduces soil 200 K to minimum levels Vertisol 150 100 50 0 I 1 2 3 4 5 6 7 8 Successive Crops 2.5 1980 1994 K Buffering Power 2 20 years of cropping reduced K 1.5 buffering capacity of soils in Inceptisol 1 0.5 0 C N NP NPK NPK+FYM Srinivasa Rao et al. Australian J. Soil Sci. (1999) Srinivasa Rao et al. Communications in Soil Pl. An (2001) Srinviasa Rao et al. J. Plant Nutri. Soil Sci. (1994)
- 11. 4000 3500 K Removal 3000 Change in Soil K kg K ha-1 2500 Change in soil reserve K is in 2000 tune of crop K uptake 1500 1000 500 0 C N NP NPK NPK+FYM Nonexchangeable K fraction in soil and its release rate is utmost important Srinivasa Rao et al. Nutrient Cycling in Agroecosystems (2001)
- 12. Nonexchangeable K release rate constants of Inceptisols as influenced by 14 years of Rice-Rice cropping, fertilization and manuring in 0.01 M citric acid (Zero order X 102)(Hyderabad) Treatment 1980 1994 0-73 h 0-217 h 0-73 h 0-217 h Control 53 29 33 22 100% N 40 26 33 20 100% NP 36 23 29 16 100% NPK 63 32 52 25 100% NPK+FYM 75 37 53 28 Drastic reductions in K release rates from Inceptisol after 14 years of cropping Srinivasa Rao et al. Australian J. Soil Sci. (1999)
- 13. Severe potassium depletion results in soil clay degradation in rhizosphere of cereals X Ray Diffractogram of soil clay before and after potassium depletion
- 14. Categorization of soils based on soil K reserves and K recommendations for different rainfed regions in India Cate Exchangeable Non- Locations Recommendation gory K exchangeable K 1 Low Low Bangalore, Inclusion of K in fertilization is must as Anantapur fingermillet based production system at Bangalore is K exhaustive and soil K status is low 2 Low Medium S.K.Nagar, K fertilization is essential as maize and Ballowal-Saunkri, pearlmillet systems are K exhaustive and Rakh-Dhiansar soil K levels are low. 3 Low High Agra, Ranchi, K additions at critical stages of crops Varanasi improve yield levels. 4 Medium Low Akola Continuous cotton system needs K addition at critical stages as nonexchangeable K fraction does not contribute to plant K nutrition substantially. 5 Medium Medium Phulbani As soils are light textured, maintenance doses of K may be required for upland rice systems 6 Medium High Hisar, Arjia, Crops may not need immediate K Faizabad additions. 7 High Low Bijapur Long term sorghum system would need K additions after few years 8 High Medium Rajkot, Kovilpatti, K application is not required Bellary, Solapur, immediately. Indore 9 High High Jhansi, Rewa K application is not required. Srinivasa Rao et al. Australian J. Soil Research (2007)
- 15. K content in healthy and affected banana leaves and corresponding soil test K in soils of Krishna district Location Healthy Affected Range Mean Range Mean K content (%) Nujvid 3.00-3.55 3.25 1.00-1..65 1.25 Vijayawada 2.25-3.50 3.10 1.62-1.85 1.73 Soil Test K (kg/ha) Nujvid 250-330 286 117-196 145 Vijayawada 319-418 395 220-286 234 Drastic reductions in K content of banana in K deficient soils
- 16. Cassava tuber yield response to major nutrients Treatm Puthiragoundanpal Paravakkadu ents ayam Yield Yield Yield Yield Increase Increase (t/ha) (%) (t/ha) (%) Kc80 (1:1:1) 37.9 - 34.9 - K160 (1:1:2) 43.0 14 42.9 23 K240 52.4 38 48.1 38 (1:1:2.5) K320 48.2 27 46.8 34 (1:1:2.5) C.D (5%) 4.5 3.3 cCommon doses: 90 kg N, 90 kg P2O5, 47 kg Ca, 40 kg S, 6 kg Zn, and 1 kg B/ha Kamaraj et al (2008)
- 17. K Deficiency •Therefore, nonexchangeable K content in soil should be included in soil testing. •Method for estimation standardized •Results into efficient utilization of costly input which is completely imported Awards International Potash Institute, Switzerland Indian Council of Agricultural Research National Academy of Agricultural Sciences Indian Science Congress Association Indian Society of Soil Science Indian Science Congress
- 18. II) Whether nutrient management can break yield stagnation in grain legumes ? 25 20 15 Area (m ha) 10 Production (m t) 5 0 1964 1974 1984 1994 2004 2007 Productivity = around 0.6 t ha-1 (Remained Same) Population in India increased to 1030 millions Per capita grain legume availability decreased from 60 g in 1951 to 28 grams in 2005 ?
- 19. II) Whether nutrient management can break yield stagnation in grain legumes ? Constraints in Grain Legume Production Grain legumes continued to be rainfed crops Cultivation on marginal lands Neglect of input application Poor crop management Biotic stresses Lack of extension programme
- 20. Fig. 1 : Emerging nutrient deficiences as a result of increased production Production (mt) 250 200 Food Production Pulse Production 150 100 50 0 Nutrient Defic iencies 1950 1960 1970 1980 1990 2000 N N N N N N Fe Fe Fe Fe Fe P P P P Zn Zn Zn Zn K K K K S S S Mn Mn Mn B B ? Srinivasa Rao et al. IIPR Bulletin (2003)
- 21. Available nitrogen content in different soil types in food legume growing regions 0-15cm 300 15-30cm Available N (kg ha ) -1 250 200 150 100 50 0 Delhi Ranchi Varanasi Sehore Faizabad Gulbarga Hyderabad Bangalore Kanpur Raipur N Deficiency in Chickpea and Fieldpea
- 22. Available P status in different soil types in food legume growing regions of India 50 45 0-15cm Available P (kg ha -1) 40 15-30cm 35 30 25 20 15 10 5 0 Delhi Ranchi Varanasi Sehore Faizabad Gulbarga Bangalore Hyderabad Kanpur Raipur P Deficiency in Chickpea in Greenhouse and Field Conditions Won International Plant Nutrition Institute Prize
- 23. Available S status in different soil types in chickpea growing regions of India 0-15cm 30 15-30cm 25 Available S (kg ha -1) 20 15 10 5 0 ad r r i e re ad i a hi ch as pu pu or rg el lo ab ab an an an eh ai ba D ga R iz er R ar K S ul an Fa yd G V B H Sulphur Deficiency in Lentil and Fieldpea
- 24. Available zinc status in different soil types in food legume growing regions 1 0-15cm 0.9 15-30cm Zinc status (mg kg-1) 0.8 0.7 0.6 0.5 0.4 0.3 0.2 0.1 0 Delhi Ranchi Varanasi Sehore Faizabad Gulbarga Bangalore Hyderabad Kanpur Raipur Zn Deficiency in Chickpea Initial-Later Stages
- 25. Available iron status of different soil types in food legume growing regions 30 0-15cm 15-30cm 25 Iron status (mg kg-1) 20 15 10 5 0 Delhi Ranchi Varanasi Sehore Faizabad Gulbarga Hyderabad Bangalore Raipur Kanpur Iron Deficiency in Chickpea and Lentil
- 26. Iron Deficiency in Pigeonpea Genotypic Variations in Iron Deficiency in Chickpea Srinivasa Rao et al. IIPR Bulletin (2003)
- 27. Contribution of different soil layers to available nitrogen Contribution of different soil layers to available P in content in different soil types different soil types 100% 100% 80% 80% 60% 60% 40% 40% 20% 20% 0% Delhi Ranchi Faizabad Gulbarga Hydearabad 0% Raipur Sehore Bangalore Kanpur Varanasi Delhi Ranchi Faizabad Gulbarga Hydearabad Raipur Sehore Bangalore Kanpur Varanasi 0-15cm 0-15cm 15-30cm 15-30cm 30-45cm 30-45cm Contribution of different soil layers to available K in Contribution of different soil layers to available S in dffiernt different soil types soil types 100% 100% Contribution 80% 80% Contribution 60% 60% 40% 40% 20% 20% 0% 0% hi d e i ur r ad a re 0-15cm si ch 0-15cm hi pu d e i ur r ad a re ba or si ch rg el pu np ho ba or na rg el ab np ho an na al D ai ba ab ra an al D ai ba ra ra Ka Se ng R iz R ra Ka Se ea ng ul R iz R 15-30cm ea 15-30cm ul Fa Va Fa Va Ba G yd Ba G yd H H 30-45cm 30-45cm Deep rooted crops such as chickpea and pigeonpea can extract nutrients from sub-soil layers also Srinivasa Rao et al. Indian J.Fertilizers (2004)
- 28. Genotypic variations in P use efficiency in chickpea * Substantial area of chickpea cultivation in India is concentrated on marginal and sub marginal lands having limited nutrient supply. * Low soil fertility, particularly phosphorus deficiency, is one of the major constraints in increasing chickpea productivity. * Some genotypes are known to mine the insoluble soil P and utilize it more efficiently while others utilize applied P in a better manner. * Selecting genotypes with high P uptake efficiency is one of the alternative approaches to manage P deficient soils.
- 29. Srinivasa Rao et al. J. Plant Nutrition (2006)
- 30. Srinivasa Rao et al. J. Plant Nutrition (2006)
- 31. Shoot Drymatter Yield of Chickpea Genotypes at Different Levels of Applied P on multi-nutrient deficient Inceptisol 9 Control 8 Shoot Yield (g/pot) 13.5 mg/kg 7 6 27mg/kg 5 4 3 2 1 0 GPF 2 GCP 101 GCP 105 GNG 663 DCP 92-3 KPG 59 RSG 888 JG 315 Phule G-5 Pant G- BG 413 BG 256 HK 94-134 Pusa 209 Radhey K 850 Vikash Sadabahar SAK 1- Vijay Genotype Srinivasa Rao et al., J. Plant Nutrition (2006)
- 32. •Based on these criteria, BG-256 can be recommended under P deficient conditions. •Further, it can be a good source in chickpea breeding program for evolving high P efficient genotypes.
- 33. Relationship between root dry weight and P Relationship between P influx and Zn uptake in chickpea genotypes at different concentration in chickpea (n=60) levels of added P Control 24 Zn concentration (ug/g shoot) 30 13.5 mg/kg 22 25 27mg/kg 20 P uptake (mg/pot) 20 18 15 16 10 14 12 5 10 0 0 0.05 0.1 0.15 0.2 0 1 2 3 4 5 P influx (m g P/g DW/Day) Root dry w eight (g/pot) Better root growth is essential for optimum P nutrition in grain legumes P induced Zn deficiency occurs only at higher levels of P application
- 34. Effect of P application on Cu concentration in Effect of P application on Zn concentration in chickpea shoot chickpea shoot 6 Cu concentration (ug/g 30 Zn concentration (ug/g 5 25 4 20 shoot) shoot) 15 3 10 2 5 1 0 0 0 13.5 27 0 13.5 27 Applied P (m g/kg soil) Applied P (mg/kg soil) Effect of P application on Fe concentration in Effect of P application on Mn concentration chickpea shoot in chickpea shoot 520 300 Fe concentration (ug/g Mn concentration (ug/g 290 500 280 shoot) shoot) 480 270 460 260 250 440 240 420 230 0 13.5 27 0 13.5 27 Applied P (m g/kg soil) Applied P (m g/kg soil) Zn and Cu have positive interaction at lower P levels Fe has negative relation with P levels Mn has positive interaction with P Srinivasa Rao et al. Indian J Food Legumes (2007)
- 35. Integrated sulphur management in Maize-Chickpea cropping sequence Four years of sulphur management experiment in maize-chickpea sequence FYM and elemental sulphur were the sources Fractionation of sulphur Sulphur use efficiency was studied 20 kg S/ha was recommended on large number of frontline demonstrations and All India Coordinated Research programe on grain legumes Srinivasa Rao et al., Communications in Soil Science and Plant Analysis (2004a) Srinivasa Rao et al., Communications in Soil Science and Plant Analysis (2004b) Srinivasa Rao et al., Indian Journal of Food Legumes (2003)
- 36. Root Architecture and Nutrient Acquisition in Faba beans @ Largest aeroponics laboratory at Tel-Aviv University, Tel-Aviv, Israel @ Effects of root pruning: at least 50 % lateral roots along with half tap root is essential for optimum plant growth @ Salinity effected more lateral roots @ Low P concentration affected lateral roots @ K uptake by young root types studied Tap and lateral root volume of faba beans at different Surface area of tap and lateral roots of faba beans at levels of P different levels of P b b c 1.8 0.02mM c 25 0.02mM 1.6 b b 0.2mM Surface area (cm 2) 0.2mM 20 1.4 Volume (cm 3) 1mM 1mM 1.2 a 1 15 0.8 b b 10 a 0.6 0.4 a 5 a 0.2 0 0 Tap Laterals Tap Laterals Srinivasa Rao et al. J. Indian Soc. Soil Sci (2002. 2003, 2005); Eshel and Srinivasarao Plant and Soil (2001).
- 37. Conclusions @ Rhizobium inoculation, FYM application, N= 20kg/ha, P2O5=60-80 kg/ha, S= 20 kg/ha; Zn, B and K = depending upon soil test. @Efficient genotypes for low and high input conditions identified
- 38. Awards @ International Plant Nutrition Institute- Fertilizer Association of India Award-2006 @IPNI Prize-2008 @Fellow of Indian Society of Pulses Research and Development
- 39. III) Emerging nutrient deficiencies in rainfed agriculture! Are dryland soils are not only thirsty but also hungry ? Maintaining soil and crop productivity in the long term in continuous cropping is a major challenge in rainfed production systems. These regions are characterized by low rainfall, sparse vegetation and poor soil fertility. The productivity of these soils regions depends on the content of organic carbon (SOC), which is a critical component of soil quality (Chander et al. 1997). However, due to high temperature and low rainfall, organic matter rapidly decomposes. Regular additions of organic matter is essential to improve soil organic carbon!
- 41. Srinivasa Rao and Vittal, Indian J.Fertilizers (2007)
- 42. Emerging Nutrient Deficiencies in Different Soil Types under Rainfed Production Systems of India Location Limiting Nutrient (Low/Deficient) Varanasi N, Zn, B Faizabad N Phulbani N, Ca, Mg, Zn, B Ranchi Mg, B Rajkot N, P, S, Zn, Fe, B Anantapur N, K, Mg, Zn, B Indore N Rewa N, Zn Akola N, P, S, Zn, B Kovilpatti N, P Bellary N, P, Zn, Fe Bijapur N, Zn, Fe Jhansi N Solapur N, P, Zn Agra N, K, Mg, Zn, B Hisar N, Mg, B SK.Nagar N, K, S, Ca, Mg, Zn, B Bangalore N, K, Ca, Mg, Zn, B Arjia N, Mg, Zn, B Ballowal-Saunkri N, K, S, Mg, Zn Rakh-Dhiansar N, K, Ca, Mg, Zn, B Srinivasa Rao and Vittal, Indian J.Fertilizers (2007)
- 43. Carbon stocks in soils under diverse rainfed production systems 450.00 Organic Carbon (Mg/ha) 400.00 Inorganic Carbon (Mg/ha) 350.00 Total Carbon (Mg/ha) Carbon (Mg/ha) 300.00 250.00 200.00 150.00 100.00 50.00 0.00 ce um n ze n t et et nu ea tto Ri ill i ll ai h d yb lm m M Co rg un er So ar So ro ng Pe G bi Fi Ra Srinivasa Rao et al., Communications in Soil Science & Plant Analysis (2009)
- 44. IV) How to improve soil fertility and soil organic carbon in dryland soil ? Availability of biomass is a major problem as it has competitive usage. Residue left over or recycling in the field is minimal (only root biomass) Fertilizer additions are low: varied between 30-50 kg/ha in rainfed agriculture as against above 100 kg/ha in irrigated agriculture in India Thus, yield levels are stabilized, factor productivity is less, soils are degraded and resulted in multi-nutrient deficiencies. Thus maintaining and improving soil organic carbon became major challenge in rainfed agriculture !
- 45. Details of location, soil type and production system of studied location Production AICRPDA State Latitude, Soil type Climate Average SNo system Centre Longitude and Annual based Altitude Rainfall (mm) 1 Groundnut Anantapur Andhra 14 42’ N, 77 40’ E, Alfisols Arid 566 Pradesh 350 m 2 Rabi Sorghum Solapur Maharashtra 17 51’N, 75 32’E, Vertisols Semi- 723 480m arid 3 Finger millet Bangalore Karnataka 12 46’ N, 77 11’ E, Alfisols Semi- 768 810m arid 4 Soybean Indore Madhya 22 51’N, 75 51’E, Vertisols Semi- 900-1000 Pradesh 530m arid 5 Rice Varanasi Uttar Pradesh 25 11’N, 82 51’E. Inceptisols Sub- 1080 hum id 6 Pearlmillet SK Nagar Gujarat 24 30’N, 72 13’E, Entisols Arid 550 152.5m
- 46. Selected treatments in permanent manurial trials in the studied locations Treatmental details Location Anantapur T1=Control (no fertilizer), Groundnut T2=100% recommended dose of fertilizer (RDF) (20:40:40 N, P2O5, K2O), 21 years old T3=50% RDF+ 4t groundnut shells (GNS) ha-1, (1985-2005) T4= 50% RDF+ 4 t FYM ha-1 T5=100% organic (5t FYM ha-1). Bangalore T1-Control Fingermillet T2- FYM @ 10 t/ha 26 years old T3- FYM@ 10 t/ha + 50 % NPK (1978-2005) T4-FYM @ 10 t/ha + 100 % NPK T5- Rec.NPK (25:50 : 25 kg NPK /ha – groundnut; 50: 50:25 Kg NPK/ha – fingermillet Solapur T1-Control Rabi Sorghum T2-25 kg N/ha –Urea 21 years old T3-50 kg N/ha – Urea (1985-2006) T4-25 kg N/ha – CR T5-25 kg N/ha – FYM T6-25 kg N/ha -CR+25 kg N/ha-Urea T7-25 kg N/ha -FYM+25 kg N/ha-Urea T8-25 kg N/ha -CR+25 kg N/ha-Leucaena T9-25 kg N/ha – Leucaena T10-25 kg N/ha -Leucaena +25 kg N/ha-Urea
- 47. S.K. Nagar T1-Control; Pearlmillet T2-100% recommended dose of N; 18 years T3-50% recommended dose of N (fertilizer); (1988-2006) T4-50% recommended N (FYM); T5-50% recommended N (fertilizer) + 50% recommended N (FYM); T6 –Farmers method (5 t of FYM/ha once in 3 years) Indore T1-Control; Soybean T2-20 Kg N+ 13 Kg P; 15 years old T3-30 Kg N+ 20 Kg; (1992-2007) T4-40 Kg N+ 26 Kg; T5-60 Kg N+ 35 kg P; T6-FYM 6t/ha+ N20P13; T7-Soybean residue 5t/ha+N20P13; T8-FYM@6t/ha; T9-Crop residues of Soybean @ 5t/ha. Varanasi T1-Control; Upland Rice T2-100% RDF (inorganic); 21 years old T3-50% RDF (inorganic); (1986-2007) T4-100% organic (FYM); T5-50% organic (FYM); T6-50% RDF+ 50%(foliar); T7-50% organic (FYM)+ 50%RDF; T8-Farmers practice
- 48. Mean annual and seasonal rainfall in relation mean pod yields of groundnut across the treatments during 20 years (1985-2005) Srinivasa Rao et al. (2009)
- 49. Trends in yield levels of groundnut (Alfisol) due to different integrated nutrient management under rainfed conditions (moving averages)
- 50. 0-20cm 20-40cm 40-60cm 60-80cm 80-100cm 0-20cm 20-40cm 40-60cm 60-80cm 80-100cm 180.0 280 kg/ha 35.0 160.0 30.0 140.0 Available N (kg/ha) Available P (kg/ha) 25.0 120.0 100.0 20.0 80.0 15.0 60.0 10.0 40.0 5.0 20.0 0.0 0.0 Control 100%RDF 50%RDF+4t gnut 50%RDF+4t FYM 5 t FYM /ha Control 100%RDF 50%RDF+4t gnut 50%RDF+4t FYM 5 t FYM /ha shells shells Treatment Treatment Effect of 20 years of cropping, fertilization, groundnut Effect of 20 years of cropping, fertilization, shells and FYM addition on Available N of Alfisol groundnut shells and FYM addition on Available P profile of Alfisol profile * After 20 years manuring and fertilization, available N was still low in all the treatments. * However available P reached to medium to high range
- 51. 0-20cm 20-40cm 40-60cm 60-80cm 80-100cm 0-20cm 20-40cm 40-60cm 60-80cm 80-100cm 180.0 16.0 160.0 14.0 Available K (kg/ha) 140.0 12.0 Ex. Ca (me/100g) 120.0 10.0 100.0 8.0 80.0 60.0 6.0 40.0 4.0 20.0 2.0 0.0 0.0 Control 100%RDF 50%RDF+4t 50%RDF+4t 5 t FYM/ha Control 100%RDF 50%RDF+4t gnut 50%RDF+4t FYM 5 t FYM /ha gnut shells FYM shells Treatment Treatment 0-20cm 20-40cm 40-60cm 60-80cm 80-100cm 0-20cm 20-40cm 40-60cm 60-80cm 80-100cm 3.5 35.0 3.0 30.0 Ex. Mg (me/100g) Available S (kg/ha) 2.5 25.0 2.0 20.0 1.5 15.0 1.0 10.0 0.5 5.0 0.0 0.0 Control 100%RDF 50%RDF+4t gnut 50%RDF+4t FYM 5 t FYM /ha Control 100%RDF 50%RDF+4t 50%RDF+4t 5 t FYM/ha shells gnut shells FYM Treatment Treatment Even after 20 years of manuring, available K, Ca, Mg and S are in the medium range
- 52. 0-20cm 20-40cm 40-60cm 60-80cm 80-100cm 0-20cm 20-40cm 40-60cm 60-80cm 80-100cm 0.80 0.40 0.70 0.35 Available Zn (mg/kg) Available B (mg/kg) 0.60 0.30 0.50 0.25 0.40 0.20 0.30 0.15 0.20 0.10 0.10 0.05 0.00 0.00 Control 100%RDF 50%RDF+4t gnut 50%RDF+4t FYM 5 t FYM /ha Control 100%RDF 50%RDF+4t gnut 50%RDF+4t FYM 5 t FYM /ha shells shells Treatment Treatment Available Zn Available B Twenty years of integrated nutrient management options followed have not improved available Zn and B contents above critical limits
- 53. Organic Carbon in Alfisol Profile after 20 Years of Cropping and Manuring 0.7 0.6 0.5 Organic Carbon, % 0-20cm 0.4 20-40cm 40-60cm 0.3 60-80cm 80-100cm 0.2 0.1 0 Cont rol 100%RDF 50%RDF+4t 50%RDF+4t 5 t FYM / ha gnut shells FYM Treatment
- 54. Microbial Biomass Carbon and POC in Alfisol Profile after 20 Years of Cropping and Manuring 160 0.45 140 0.40 0.35 120 0-20cm 0-20cm MBC(ug/g soil) 0.30 100 20-40cm POC (%) 20-40cm 0.25 40-60cm 80 40-60cm 0.20 60-80cm 60-80cm 60 80-100cm 0.15 80-100cm 40 0.10 20 0.05 0 0.00 Cont rol 100%RDF 50%RDF+4t 50%RDF+4t 5 t FYM / ha Cont rol 100%RDF 50%RDF+4t 50%RDF+4t 5 t FYM / ha gnut shells FYM gnut shells FYM Treatment Treatment MBC POC Srinivasa Rao et al. (2007)
- 55. 0-20cm 20-40cm 40-60cm 60-80cm 80-100cm 0-20cm 20-40cm 40-60cm 60-80cm 80-100cm 45 8 Dehydrgenage (ug TPF/g soil/24 hr) Aryl Sulfatase (ugPNF/g soil/hr) 40 7 35 6 30 5 25 4 20 3 15 2 10 5 1 0 0 Control 100%RDF 50%RDF+4t gnut 50%RDF+4t FYM 5 t FYM /ha Control 100%RDF 50%RDF+4t gnut 50%RDF+4t FYM 5 t FYM /ha shells shells Treatment Treatment 0-20cm 20-40cm 40-60cm 60-80cm 80-100cm 25.0 Effect of 20 years of cropping, Urease (ug NH4/g soil/hr) 20.0 fertilization, groundnut shells and 15.0 FYM addition on a) dehydrogenase, 10.0 b) Aryl sulfatase, c) Urease activity of Alfisol profile at Anantapur 5.0 0.0 Control 100%RDF 50%RDF+4t gnut 50%RDF+4t FYM 5 t FYM /ha shells Treatment
- 56. Build up of organic carbon in Alfisol (0-20 cm) after 20 years of cropping, fertilization and manuring 0.7 Organic carbon (%) 0.6 0.5 Buildup 0.4 Initial 0.3 0.2 0.1 0 Control 1 RDF 50%RDF+4t 50%RDF+4t 5 t FYM/ha 00% gnut shells FYM Treatment
- 57. Bangalore: Long Term Manurial Experiment in Acid Alfisol (1978-2005)