1. Year
World
Tourist
Arrivals
Tourist
Arrivals in
India
Tourist Arrivals
in Andhra
Pradesh
Share of
India in
World
Tourism
Share of
Andhra
Pradesh in
World
Tourism
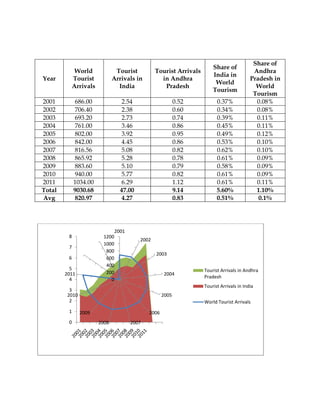
2001 686.00 2.54 0.52 0.37% 0.08%
2002 706.40 2.38 0.60 0.34% 0.08%
2003 693.20 2.73 0.74 0.39% 0.11%
2004 761.00 3.46 0.86 0.45% 0.11%
2005 802.00 3.92 0.95 0.49% 0.12%
2006 842.00 4.45 0.86 0.53% 0.10%
2007 816.56 5.08 0.82 0.62% 0.10%
2008 865.92 5.28 0.78 0.61% 0.09%
2009 883.60 5.10 0.79 0.58% 0.09%
2010 940.00 5.77 0.82 0.61% 0.09%
2011 1034.00 6.29 1.12 0.61% 0.11%
Total 9030.68 47.00 9.14 5.60% 1.10%
Avg 820.97 4.27 0.83 0.51% 0.1%
2001
2002
2003
2004
2005
2006
20072008
2009
2010
2011
0
200
400
600
800
1000
1200
0
1
2
3
4
5
6
7
8
Tourist Arrivals in Andhra
Pradesh
Tourist Arrivals in India
World Tourist Arrivals
2. Year
World
Tourist
Arrivals
Tourist
Arrivals in
New York
City
Tourist
Arrivals in
Malaysia
Share of
New York
City in
World
Tourism
Share of
Malaysia in
World Tourism
2001 686.00 35.2 12.78 5.13% 1.86%
2002 706.40 35.3 13.29 5.00% 1.88%
2003 693.20 37.8 10.58 5.45% 1.53%
2004 761.00 39.9 15.70 5.24% 2.06%
2005 802.00 42.7 16.43 5.32% 2.05%
2006 842.00 43.8 17.55 5.20% 2.08%
2007 816.56 46 20.97 5.63% 2.57%
2008 865.92 47.1 22.05 5.44% 2.55%
2009 883.60 45.8 23.65 5.18% 2.68%
2010 940.00 48.8 24.58 5.19% 2.61%
2011 1034.00 50.9 24.71 4.92% 2.39%
Total 9030.68 473.3 202.29 57.7% 24.26%
Avg 820.97 43.03 18.39 5.25% 2.21%
0
200
400
600
800
1000
1200
20012002200320042005200620072008200920102011
World Tourist Arrivals
Tourist Arrivals in New York
City
Tourist Arrivals in Malaysia
3. NYC Statistics
New York City offers incomparable museums, attractions, restaurants, hotels, theaters,
entertainment and shopping. Read below for interesting facts and statistics about the greatest city in
the world.
Total visitors to NYC 2000-2011*
Visitors (international and domestic) to New York City in 2011:
50.9 million
Visitors (international and domestic) to New York City in 2010:
48.8 million
Visitors (international and domestic) to New York City in 2009:
45.8 million
Visitors (international and domestic) to New York City in 2008:
47.1 million
Visitors (international and domestic) to New York City in 2007:
46 million
Visitors (international and domestic) to New York City in 2006:
43.8 million
Visitors (international and domestic) to New York City in 2005:
42.7 million
Visitors (international and domestic) to New York City in 2004:
39.9 million
Visitors (international and domestic) to New York City in 2003:
37.8 million
Visitors (international and domestic) to New York City in 2002:
35.3 million
Visitors (international and domestic) to New York City in 2001:
35.2 million
Visitors (international and domestic) to New York City in 2000:
36.2 million
*numbers may not add up due to rounding
Domestic Visitors to NYC 2000–2011
Domestic visitors in 2011: 40.3 million
Domestic visitors in 2010: 39.1 million
4. Domestic visitors in 2009: 37.0 million
Domestic visitors in 2008: 37.6 million
Domestic visitors in 2007: 37.1 million
Domestic visitors in 2006: 36.5 million
Domestic visitors in 2005: 35.8 million
Domestic visitors in 2004: 33.8 million
Domestic visitors in 2003: 33.0 million
Domestic visitors in 2002: 30.2 million
Domestic visitors in 2001: 29.5 million
Domestic visitors in 2000: 29.4 million
International Visitors to NYC 2000–2011
International visitors in 2011: 10.6 million
International visitors in 2010: 9.7 million
International visitors in 2009: 8.8 million
International visitors in 2008: 9.5 million
International visitors in 2007: 8.8 million
International visitors in 2006: 7.3 million
International visitors in 2005: 6.8 million
International visitors in 2004: 6.2 million
International visitors in 2003: 4.8 million
International visitors in 2002: 5.1 million
International visitors in 2001: 5.7 million
International visitors in 2000: 6.8 million
Direct Visitor Spending in NYC 2003–2011
Visitor spending (international and domestic) in 2011: $34.5 billion
Visitor spending (international and domestic) in 2010: $31.5 billion
Visitor spending (international and domestic) in 2009: $28.2 billion
Visitor spending (international and domestic) in 2008: $32.0 billion
Visitor spending (international and domestic) in 2007: $30.0 billion
Visitor spending (international and domestic) in 2006: $26.2 billion
Visitor spending (international and domestic) in 2005: $24.3 billion
Visitor spending (international and domestic) in 2004: $21.3 billion
Visitor spending (international and domestic) in 2003: $18.5 billion
New York City’s Top International Markets (2011 figures):
1. United Kingdom 1,055,000
2. Canada 1,033,000
3.Brazil 718,000
4.France 662,000
5.Germany 587,000
6.Australia 532,000
7.Italy 495,000
8.Scandinavia (Sweden, Finland, Norway, Denmark, Iceland) 445,000
9.All Middle East (incl. Israel) 436,000
10.PR China (excl. Hong Kong) 427,000
11. Spain 402,0000
5. 12. Mexico 376,000
13.Eastern Europe 367,000
14.BeNeLux (Belgium, Netherlands, Luxembourg) 329,000
15.Japan 299,000
16.South Korea 283,000
17.Argentina 235,000
18.Ireland 214,000
19.India 200,000
20. Russia 126,000
Economic Impact
2011
Total visitor spending from New York City tourism in 2011: $34.5 billion
Total wages generated by New York City tourism in 2011: $18.6 billion
Total NYC jobs supported by visitor spending in 2011: 324,605
Total taxes generated by visitor spending in 2011: $8.7 billion
Each New York City household benefited by an average of $1,350 in tax savings as a result of travel
and tourism
2010
Total visitor spending from New York City tourism in 2010: $31.5 billion
Total wages generated by New York City tourism in 2010: $17.3 billion
Total NYC jobs supported by visitor spending in 2010: 310,156
Total taxes generated by visitor spending in 2010: $8.1 billion
Each New York City household benefited by an average of $1,350 in tax savings as a result of travel
and tourism
2009
Total visitor spending from New York City tourism in 2009: $28.2 billion
Total wages generated by New York City tourism in 2009: $16.6 billion
Total NYC jobs supported by visitor spending in 2009: 303,649
Total taxes generated by visitor spending in 2009: $7.5 billion
Each New York City household benefited by an average of $1,200 in tax savings as a result of travel
and tourism
2008
Total visitor spending from New York City tourism in 2008: $32.1 billion
Total wages generated by New York City tourism in 2008: $17.19 billion
Total NYC jobs supported by visitor spending in 2008: 313,997
Total taxes generated by visitor spending in 2008: $8.26 billion
Each New York City household benefited by an average of $1,300 in tax savings as a result of travel
and tourism.
2007
Total visitor spending from New York City tourism in 2007: $28.85 billion
Total wages generated by New York City tourism in 2007: $17 billion
Total NYC jobs supported by visitor spending in 2007: 353,536
Total taxes generated by visitor spending in 2007: $6.45 billion
6. Each New York City household benefited by an average of $1,069 in tax savings as a result of travel
and tourism.
2006
Total visitor spending from New York City tourism in 2006: $24.71 billion
Total wages generated by New York City tourism in 2006: $16 billion
Total NYC jobs supported by visitor spending in 2006: 368,179
Total taxes generated by visitor spending in 2006: $6.24 billion
Each New York City household benefited by an average of $953 in tax savings as a result of travel
and tourism.
2005
Total visitor spending from New York City tourism in 2005: $22.8 billion
Total wages generated by New York City tourism in 2005: $14.2 billion
Total NYC jobs supported by visitor spending in 2005: 333,158
Total taxes generated by visitor spending in 2005: $5.44 billion
Each New York City household benefited by an average of $541 in tax savings as a result of travel
and tourism.
2004
Total visitor spending from New York City tourism in 2004: $21.07 billion
Total wages generated by New York City tourism in 2004: $12.91 billion
Total NYC jobs supported by visitor spending in 2004: 328,763
Total taxes generated by visitor spending in 2004: $5.4 billion
Each New York City household benefited by an average of $502 in tax savings as a result of travel
and tourism.
2003
Total visitor spending from New York City tourism in 2003: $18.49 billion
Total wages generated by New York City tourism in 2003: $11.58 billion
Total NYC jobs supported by visitor spending in 2003: 291,977
Total taxes generated by visitor spending in 2003: $4.9 billion
2002
Total NYC jobs supported by visitor spending in 2002: 226,100
Total taxes generated by visitor spending in 2002: $2.8 billion
2001
New York City taxes generated by visitor spending in 2001: $790 million
New York State taxes generated by NYC visitor spending in 2001: $769 million
Federal taxes generated by NYC visitor spending in 2001: $1.242 billion
Size
Central Park, total acres: 843
New York City, total area in square miles: 301
7. Manhattan, total area in square miles: 23.7
Manhattan, length: 13.4 miles (21.5 km) long
Manhattan, widest point: 2.3 miles (3.7 km)
Manhattan, narrowest point: 0.8 miles (1.3 km) at narrowest point
The Bronx, total area in square miles: 44
Brooklyn, total area in square miles: 81.8
Queens, total area in square miles: 112.2
Staten Island, total area in square miles: 60.2
Population
New York City: 8,224,910
Bronx: 1,392,002
Brooklyn: 2,532,645
Manhattan: 1,601,948
Queens: 2,247,848
Staten Island: 470,467
New York-Northern New Jersey-Long Island, NY-NJ-PA Metropolitan Statistical Area: 19,015,900
(July 2011)
Source: U.S. Census Bureau, 2010 Current Estimates Program
Climate
Average temperatures:
January
Low 27 degrees F, -3 degrees C High 38 degrees F; 3 degrees C
July
Low 69 degrees F; 21 degrees C High 84 degrees F; 29 degrees C
Average rainfall:
January 3.65 inches
July 4.60 inches
Average snowfall:
January 7 inches
July 0 inches
Hotels
NYC average hotel occupancy in 2011: 85.4%
NYC average hotel occupancy in 2010: 85.5%
NYC average hotel occupancy in 2009: 81.5%
NYC average hotel occupancy in 2008: 85.3%
NYC average hotel occupancy in 2007: 86.1%
NYC average hotel occupancy in 2006: 85.6%
NYC average hotel occupancy in 2005: 86.1%
NYC average hotel occupancy in 2004: 82.4%
NYC average hotel occupancy in 2003: 76.3%
NYC average hotel occupancy in 2002: 75.6%
NYC average hotel occupancy in 2001: 73.4%
NYC average hotel occupancy in 2000: 84.6%
8. NYC hotel average daily room rate (ADR): 2012: 281; 2011 - $273; 2010 - $261; 2009 - $237; 2008 -
$307; 2007 - $303; 2006 - $267; 2005 - $241; 2004 - $209; 2003 - $193; 2002 - $195; 2001 - $203;
2000 - $233
Source: PKF Consulting
Entertainment Production
Direct expenditures (2011): $7.1 billion
Entertainment production employment (2011): 130,000
The Mayor's Office of Film, Theatre & Broadcasting (tel. 212/489-6710)
Transportation
MTA New York City Transit, 718/330-3000
Airports
Airports serving New York City: three
John F. Kennedy International (JFK), LaGuardia (LGA), Newark Liberty International (EWR)
Passengers serviced at three NYC airports:
2011: 105.5 million
2010: 103.6 million
2009: 101.5 million
2008: 107.0 million
2007: 110.0 million
2006: 101.5 million
2005: 99.8 million
Flights at NYC airports:
2011: 1.01 million
2010: 1.16 million
2009: 1.18 million
2008: 1.25 million
2007: 1.36 million
2006: 1.22 million
2005: 1.19 million
Buses
Number of buses (2011): 5,600
Number of routes (2011): 235 local 4 Select Bus Service, and 71 express bus routes in the five
boroughs
Average Weekday riders (2011): 2.5 million
Yearly riders (2011): 784 million
MTA New York City Transit
Subway
Number of routes: 22
Subway cars (2011): Roughly 6,282
Subway stations: 468
9. Average weekday riders (2011): 5.3 million
Yearly riders (2011): 1.6 billion
Miles of track: more than 840
Source: MTA New York City Transit
Taxis
Licensed medallion yellow taxis: 13,270
Flat fare from JFK International to any point in Manhattan: $45 plus tolls & tip
Source: New York City Taxi & Limousine Commission, 212/676-1000
Ferry
Price of Staten Island Ferry: Free
Trips per day: 252 (incl. weekend trips)
Yearly Riders (2011): 20 million
Passengers per day (2011): 60,000 (excl. weekend days)
Source: The Staten Island Ferry
Dining Out
Average cost of a dinner in 2012 (drink, tax, tip included – Zagat Survey): $43.46
New restaurants in 2011 (Zagat Survey): 135