SlideShare a Scribd company logo
1 of 41
Download to read offline
A PROPOSAL TO REBUILD AMERICA
                            BY INVESTING IN TRANSPORTATION AND
                             ENVIRONMENTAL INFRASTRUCTURE
                                       December 12, 2008


$85 BILLION FOR INFRASTRUCTURE INVESTMENT

   The Rebuild America proposal provides $85 billion of infrastructure investment to enhance
    the safety, security, and efficiency of our highway, transit, rail, aviation, environmental, inland
    waterways, public buildings, and maritime transportation infrastructure. Specifically, the
    proposal provides:

              Highways and Bridges:                       $30.25 billion
               including Federal-aid Highway Formula ($30 billion) and National Park Road
               Funding ($250 million)


              Transit:                                       $12 billion
               including Transit Urban and Rural Formula ($7.5 billion), Transit Energy Formula
               ($2.0 billion), and New Starts Funding ($2.5 billion)


              Rail:                                          $5 billion
               including Amtrak ($1.5 billion), High-speed and Intercity Passenger Rail
               ($3.4 billion), and Short-Line Railroad Funding ($100 million)


              Aviation:                                   $5.25 billion
               including Airport Improvement Program ($5 billion) and Federal Aviation
               Administration Facilities & Equipment ($250 million).


              Environmental Infrastructure:                $14.275 billion
               including Clean Water State Revolving Fund ($12 billion), Alternative Water Source
               projects ($500 million), Nonpoint Source Management Program ($1 billion),
               National Estuary Program ($100 million), and Great Lakes Contaminated Sediment
               Remediation ($400 million), Brownfields ($275 million)


              U.S. Army Corps of Engineers:                  $7 billion
               including Construction ($3.0 billion), Operations & Maintenance ($3.2 billion), and
               Mississippi Rivers & Tributaries ($800 million)


              Federal Buildings:                              $10 billion
               including General Services Administration ($9.7 billion), Smithsonian Institution
               ($270 million), and Architect of the Capitol ($20 million)


              Economic Development Administration: $400 million


              Coast Guard:                                  $734 million
               including Great Lakes Icebreaker ($153 million), Shore Facilities ($100 million), and
               Bridge Alterations ($481 million)


              Maritime Administration:                       $55 million
               including Title XI loan guarantees ($45 million) and Maritime Education and Job
               Training ($10 million)


              St. Lawrence Seaway:                             $45 million
Page     2


    The proposal requires these funds to be invested in ready-to-go projects. Priority shall be
     given to projects that can award contracts within 90 days of enactment.


    The proposal creates green collar jobs and invests in projects that decrease our
     dependence on foreign oil and address global climate change. For Federal building
     renovation funds, priority shall be given to projects that include energy and water conservation
     elements, including installing photovoltaic roofs and geothermal technology. In addition, the
     proposal provides significant investment in public transit, Amtrak, and intercity and high-speed
     rail projects to provide alternatives to traveling by car, and assist transit and rail providers in
     converting to alternative fuel vehicles.


    The proposal requires the steel, iron, and manufactured goods for these projects to be
     manufactured in the United States.


    The proposal requires States, cities, public transit agencies, and other recipients of
     formula funds to certify State and local maintenance of effort and equitable distribution
     of funding to ensure that States, cities, public transit agencies, and other recipients continue
     their current investment levels and distribute funds equitably throughout the State and
     metropolitan areas. Recipients must submit a plan of projects for projects to be awarded
     contracts within 90 days, one year, and two years.


    Finally, the proposal ensures transparency and accountability by including regular
     reporting requirements to track the use of the funds, State investments, and the estimated
     number of jobs created or sustained. The Federal agencies administering these funds will
     provide periodic reports to Congress and the Economic Recovery Advisory Board (announced
     by President-elect Obama on November 26, 2008) on the amount of Federal funds
     apportioned, obligated, and outlayed; the status of bids, contracts, and construction; and the
     number of jobs created or sustained with the Federal investments. The report will also track
     State investment levels to ensure state maintenance of effort. The proposal requires six
     periodic reports: 30 days, 60 days, 120 days, 180 days, one year, and three years after the date of
     enactment.

READY-TO-GO INFRASTRUCTURE INVESTMENTS

    While certain infrastructure projects may require years of engineering and environmental
     analysis, followed by a lengthy contract award process, a subset of projects – such as projects
     involving rehabilitation and repair of existing infrastructure – can move much more quickly,
     with work beginning within 90 days. 1


    The proposal requires Rebuild America funds to be invested in ready-to-go projects. Priority
     will be given to projects that can award bids within 90 days. For instance, State Departments of
     Transportation (“DOTs”) have a tremendous backlog of highway resurfacing needs. State
     DOTs often have open-ended contracts in place for resurfacing projects, which means that
     work could begin immediately upon receipt of additional funds. Similarly, many State DOTs
     have bridge deck overlay projects, in which the top two or three inches of concrete on the
     surface of the bridge (e.g., the deck) is replaced, which are ready-to-go.


    Within seven days of the date of enactment, the U.S. Department of Transportation and
     Environmental Protection Agency will distribute formula funds to States, cities, and public
     transit agencies. State DOTs can immediately put out bids (typically for a period of 30 days)
     for ready-to-go projects. After receipt of the bids and contract award, work can begin on the
     project within an additional 30 days. In this way, the Rebuild America proposal can “put
     shovels in the ground” within 90 days of enactment.

 The Federal Highway Administration’s “August redistribution” of highway funds illustrates the ability of States to
1

obligate additional funds quickly when they become available. In August of each year, States that cannot use their entire
obligation authority return the unused authority to the Federal Highway Administration, which then redistributes it to
States that can use the funds prior to the end of the fiscal year on September 30.
Page     3

ECONOMIC IMPACT:                     MORE THAN 2.4 MILLION JOBS AND
                                     $439 BILLION OF ECONOMIC ACTIVITY


    The proposed $85 billion of Federal infrastructure investment will create or sustain more
     than 2.4 million jobs and $439 billion of economic activity. Each $1 billion of Federal
     funds invested in infrastructure creates or sustains approximately 34,779 jobs and $6.2 billion in
     economic activity. 2


    A national survey found that transportation construction contractors hire employees within
     three weeks of obtaining a project contract. These employees begin receiving paychecks within
     two weeks of hiring.


    In addition, this infrastructure investment will increase business productivity by reducing the
     costs of producing goods in virtually all industrial sectors of the economy. Increased
     productivity results in increased demand for labor, capital, and raw materials and generally leads
     to lower product prices and increased sales.


    The proposed investment will specifically help unemployed construction workers. The
     construction sector lost 261,000 jobs in 2007, and has lost an additional 513,000 jobs during the
     first 11 months of 2008 (through November). The unemployment rate in construction was
     12.7 percent in November 2008 – up 6.5 points since November 2007. This is the highest
     unemployment rate of any industrial sector. As of November 2008, there are 1,237,000
     unemployed construction workers in the nation – that’s 592,000 more unemployed
     construction workers than in November 2007. Within the overall construction sector, heavy
     and civil engineering construction employment is now the lowest it has been since February
     2005.


    In contrast to the economic stimulus effect from tax cuts, virtually all of the stimulus effect
     from public infrastructure investment will be felt in the United States. Not only would the
     construction work be done here, but most transportation construction materials and equipment
     are manufactured in the United States, as well. 3


MINORITY-OWNED AND WOMEN-OWNED BUSINESS IMPACT:

    This investment will also help address the disproportionate effect that the increase in
     unemployment has had on people of color. In November 2008, the rate of unemployment for
     African Americans was 11.2 percent – nearly twice the rate for whites. The unemployment rate
     for Hispanic or Latino Americans was 8.5 percent, 47 percent more than the rate for whites.


    Under existing highway, transit, and other infrastructure laws, as a general rule, States, cities,
     and infrastructure financing authorities are required to provide at least 10 percent of the
     amounts made available to Disadvantaged Business Enterprises (“DBEs”), including minority-
     and women-owned businesses.


  These estimates are based on 2007 Federal Highway Administration data on the correlation between highway
2

infrastructure investment and employment and economic activity, and assume a 20 percent state or local matching share
of project costs. Some infrastructure programs have slightly higher or lower estimates of the number of jobs created or
the economic activity generated per $1 billion of Federal funds invested. To enable easy comparisons among the
elements of the bill, this document presumes the FHWA model for employment and economic activity. In most cases,
the requirement for State or local matching funds would be waived under this proposal. Where appropriate, estimates of
employment and economic activity have been adjusted to reflect these match waivers.
3 Previous experience with using public infrastructure investment to stimulate the economy can be found with the Public

Works Acceleration Act (P.L. 87-658), signed by President Kennedy on September 14, 1962. Under this program, a
total investment of $1.8 billion ($880 million Federal investment and $920 million in local investment) generated 250,000
job-years.
Page        4

                                  HIGHWAYS AND BRIDGES – $30.25 BILLION

Infrastructure Needs: The cost of traffic congestion in our cities nationwide is a staggering $78
billion annually in wasted time (4.2 billion hours of delay) and fuel (2.9 billion gallons of excess fuel).

Data contained in the Department of Transportation’s 2006 Conditions and Performance Report
indicate that a total investment of $78.8 billion (in constant 2004 dollars) is needed annually to
maintain our highway and bridges in their current condition. To improve the overall condition of
highways and bridges, a combined investment of $131.7 billion (in constant 2004 dollars) is needed
each year. According to the Department of Transportation (“DOT”), the annual investment
gap is $8.5 billion to maintain our current systems and $61.4 billion to begin to improve
highway and bridges. 4

According to the U.S. Department of Transportation:
      Only 42.2 percent of travel on roads for which data are available occurred on pavements
       with “good” ride quality; and
      25.4 percent of highway bridges are structurally deficient (12.1 percent) or functionally
       obsolete (13.3 percent).


Ready-to-Go Projects: States and cities have many projects that are ready-to-go to construction
within 90 days if additional funding is made available. A December 2008 survey of State
Departments of Transportation by the American Association of State Highway and Transportation
Officials (“AASHTO”) identified 5,148 highway and bridge projects at a total cost of $64.3 billion
that are ready to go to construction within 180 days. See attached Table A. Similarly, a December
2008 survey of 427 cities by the U.S. Conference of Mayors identified 2,403 road and street projects
at a total cost of $17.4 billion that are ready to go to construction in 2009. 5

While major highway construction projects take time to plan and design and thus are not good
candidates for an economic stimulus package, every State DOT has a number of highway
resurfacing and minor reconstruction projects in the pipeline that could be brought to construction
with short notice. There is a pent-up demand for, and capacity to supply, these projects. Highway
resurfacing work has been in decline because of the increasing cost of materials, labor, and
equipment, coupled with the fixed budgets of state and local transportation agencies. According to
the National Asphalt Pavement Association, the production of hot-mix asphalt declined 9.5 percent
nationally from 2006 to 2007. At this time, the production of hot-mix asphalt is expected to decline
about another 20 percent nationally in 2008.

In addition, the National Park Service has identified 18 transportation projects in 15 States and the
District of Columbia that are ready to go, but unfunded. These projects have obtained
environmental clearance and can be underway within 180 days.


Proposal:

         1. Provide an additional $30.0 billion in funding for Federal-Aid Highway formula
            investments.

         2. Provide an additional $250 million in funding for National Park Roads.


Source: Appropriate funds from the General Fund.


Distribution: Distribute Federal-Aid Highway funds to States and cities pursuant to existing
statutory highway formula under the Safe, Accountable, Flexible, Efficient Transportation Equity
Act: A Legacy for Users (“SAFETEA-LU”). A percentage of these funds would be suballocated to
large metropolitan areas. Distribute National Park Road funds pursuant to existing Federal Highway
Administration administrative process.


  According to DOT's 2006 Conditions and Performance Report, Federal, State, and local capital expenditure for
4

highways and bridges totaled $70.3 billion in 2004. This is $8.5 billion less than the annual expenditure needed to
maintain highways and bridges, and $61.4 billion less than the annual expenditure needed to improve highways and
bridges.
5 MainStreet Economic Recovery, “Ready to Go” Jobs and Infrastructure Projects, U.S. Conference of Mayors, December 8, 2008.
Page   5

Prioritization: Prioritize funds on projects that are ready to go to construction and can be
underway within 90 days. Formula funds that are not obligated within 180 days of the date of
enactment of this Act shall be redistributed to States that are able to obligate the funds.


Shovel-Ready Deadlines: Require the Federal Highway Administration (“FHWA”), States,
and cities to award contracts for projects totaling at least $15 billion (50 percent) of these
funds within 90 days of the date of allocation. Require FHWA, States, and cities to award
contracts for all of the funding within one year of the date of enactment.


Economic Impact: Create more than 841,000 jobs and $150 billion of economic activity.


Equal Opportunity: Pursuant to SAFETEA-LU, as a general rule, States and cities are required to
provide at least 10 percent ($3.025 billion) of the amounts made available to Disadvantaged Business
Enterprises (“DBEs”), including minority- and women-owned businesses.
Page        6

                    TRANSIT URBAN AND RURAL FORMULA GRANTS – $7.5 BILLION

Infrastructure Needs: The cost of traffic congestion in our cities nationwide is a staggering $78
billion annually in wasted time (4.2 billion hours of delay) and fuel (2.9 billion gallons of excess fuel).

Data contained in the Department of Transportation’s 2006 Conditions and Performance Report
indicate that a total investment of $15.8 billion (in constant 2004 dollars) is needed annually to
maintain transit systems at their current condition and level of performance. To improve the overall
condition and performance of transit systems, a combined investment of $21.8 billion (in constant
2004 dollars) is needed each year. According to DOT, the annual investment gap is $3.2 billion
to maintain our transit systems and $9.2 billion to begin to improve our transit systems. 6

According to DOT’s 2006 Conditions and Performance Report:
      Over one-half of all urban rail transit stations are substandard;
      One-third of our nation’s bus maintenance facilities are substandard;
      16 percent of elevated transit structures and 13 percent of underground transit tunnels are
       substandard; and
      eight percent of transit track is substandard.


Ready-to-Go Projects: Public transit agencies have many projects that are ready to go to
construction within 90 days if additional funding is made available. As of December 2008, a survey
of public transportation agencies by the American Public Transportation Association (“APTA”)
identified 736 ready-to-go transit projects at a total cost of $12.2 billion. 7 In addition, APTA
estimates that an estimated $32.4 billion in transit investment projects could be underway within two
years. Similarly, a December 2008 survey of 427 cities by the U.S. Conference of Mayors identified
628 projects at a total cost of $7.1 billion that are ready to go to construction in 2009. 8


According to APTA, almost one in five buses (approximately 12,000 buses) is eligible for
replacement under Federal Transit Administration (“FTA”) regulations. Public transit agencies have
many existing options to purchases buses and rail vehicles, which could be exercised to purchase
these vehicles if additional funding is made available. According to APTA, public transit agencies
hold options for more than 10,000 buses, valued at $5 billion, which could be exercised immediately
without a new procurement process. Bus manufacturers and their suppliers have indicated that their
production rates could be increased 30 to 35 percent if orders indicated a sustained Federal
investment. 9 Similarly, public transit agencies hold options for more than 1,000 rail vehicles, valued
at more than $2 billion, based on existing designs for subway cars, light rail vehicles, streetcars, and
other rail vehicles. 10


Proposal: Provide $7.5 billion in transit capital and operating grants for ready-to-go
projects, including $6.75 billion of transit urban formula funds and $750 million of transit
rural formula funds.


Source: Appropriate funds from the General Fund.


Distribution: Distribute transit urban and rural formula funds to States, cities, and public transit
agencies pursuant to existing statutory transit formulas under 49 U.S.C. 5307 and 49 U.S.C. 5311.


Prioritization: Prioritize funds on projects that are ready to go to construction and can be
underway within 90 days.


  According to DOT's 2006 Conditions and Performance report, Federal, State, and local capital expenditure for transit
6

totaled $12.6 billion in 2004. This amount is $3.2 billion less than the annual expenditure needed to maintain transit
systems, and $9.2 billion less than the annual expenditure needed to improve transit systems.
7 The survey results are based on 216 public transportation agencies reporting of approximately 400 APTA members

who received the survey. APTA members serve over 90 percent of U.S. transit users.
8 MainStreet Economic Recovery, “Ready to Go” Jobs and Infrastructure Projects, U.S. Conference of Mayors, December 8, 2008.
9 American Public Transportation Association letter to Mortimer L. Downey, December 11, 2008.
10 Id.
Page       7

Shovel-Ready Deadlines: Require States, cities, and public transit agencies to award
contracts for at least $3.75 billion (50 percent) of these funds within 90 days of the date of
allocation. Require States, cities, and public transit agencies to award contracts for all of the
funding within one year of the date of enactment.


Economic Impact: Create more than 208,000 jobs and $37 billion of economic activity.


Equal Opportunity: Pursuant to SAFETEA-LU, as a general rule, States, cities, and public transit
agencies are required to provide at least 10 percent ($750 million) of the amounts made available to
DBEs, including minority- and women-owned businesses.
Page      8

                                  TRANSIT ENERGY FUNDING – $2.0 BILLION

Infrastructure Needs: The cost of fuel has skyrocketed, and the number of Americans choosing
to commute by transit to save money and reduce their reliance on foreign oil has surged. In 2007,
Americans took more than 10.3 billion trips on public transportation, the highest level in 50 years.

According to a recent study, the direct petroleum savings attributable to current public
transportation use in the United States is 1.4 billion gallons per year. When the secondary effects of
transit availability on travel are also taken into account, the equivalent of 4.2 billion gallons of
gasoline is saved annually – more than 11 million gallons of gasoline per day. 11 If Americans used
public transit at the same rate as Europeans – for roughly 10 percent of their daily travel needs – the
United States could reduce its dependence on imported oil by more than 40 percent, nearly equal to
the 550 million barrels of crude oil that we import from Saudi Arabia each year. 12


Ready-to-Go Projects: Public transportation authorities have many energy-related projects –
including the need to meet increased fuel costs and purchase clean fuel vehicles – that are ready-to-
go within 90 days if additional funding is made available. As of May 2008, a survey of public
transportation agencies by APTA had identified an increase in transit fuel costs of 166 percent in
just four years. These added costs translate to a sharp increase in the share of operating costs
dedicated to fuel, which is now almost 11 percent of public transit agencies’ total operating
budgets. 13


Proposal: Provide $2 billion in transit operating and capital grants to public transit agencies
to meet increased fuel costs and purchase clean fuel or alternative fuel vehicles.


Source: Appropriate funds from the General Fund.


Distribution: Distribute transit energy funds to States, cities, and public transit agencies pursuant
to existing statutory transit urban and rural formulas under SAFETEA-LU. See section 3 of H.R.
6052, the “Saving Energy Through Public Transportation Act of 2008”, as passed by the House on
June 26, 2008.


Prioritization: Prioritize funds on projects that are ready to go to construction and can be
underway within 90 days.


Shovel-Ready Deadlines: Require States, cities, and public transit agencies to award
contracts for projects totaling at least $1 billion (50 percent) of these funds within 90 days of
the date of allocation. Require States, cities, and public transit agencies to award contracts
for all of the funding within one year of the date of enactment.


Equal Opportunity: Pursuant to SAFETEA-LU, as a general rule, States, cities, and public transit
agencies are required to provide at least 10 percent ($200 million) of the amounts made available to
DBEs, including minority- and women-owned businesses.


   Public Transportation and Petroleum Savings in the U.S.: Reducing Dependence on Oil, ICF International, January 2007; The
11

Broader Connection between Public Transportation, Energy Conservation and Greenhouse Gas Reductions, ICF International, February
2008.
12 Conserving Energy and Preserving the Environment: The Role of Public Transportation, Shapiro, Hassett, and Arnold, 2002.
13 Survey results based on 96 public transportation agencies reporting. Survey was sent to just under 400 APTA

members. APTA members serve over 90 percent of U.S. transit users.
Page   9

                          TRANSIT NEW STARTS CONSTRUCTION – $2.5 BILLION

Infrastructure Needs: New Starts transit project delays are growing at an alarming rate. The
Department of Transportation has not signed any federal funding agreements for New Starts
projects during 2008, even though approximately 300 New Starts projects were authorized in
SAFETEA-LU.

Data from the Federal Transit Administration (“FTA”) indicate that more than $4 billion in existing
New Starts funding agreements are outstanding as of FY 2009. In addition, projects that already
have multi-year New Starts funding agreements have seen their yearly Federal commitments cut.
This delay and backtracking at the Federal level creates additional financial burdens for state and
local governments. One study shows that for each year of delay in major transportation
projects (those with total project costs of $1 billion or more), an additional $46 million is
added to the project cost. 14


Ready-to-Go Projects: Public transportation authorities have many New Starts projects that are
either currently in construction or ready-to-go to construction within 90 days if additional funding is
made available. FTA has documented more than $2.4 billion in pre-approved New Starts funding
that could immediately be advanced to 19 projects across the country to construct New Start and
Small Start projects. In addition, FTA has identified a New Starts funding shortfall of more than
$71.1 million that is required to be restored to 13 New Starts construction projects, and could also
be advanced immediately.


Proposal: Provide $2.5 billion in transit capital grants for New Starts construction projects.


Source: Appropriate funds from the General Fund.


Distribution: Distribute New Starts project construction funds to public transit agencies pursuant
to existing authority under SAFETEA-LU, FTA Full Funding Grant Agreements, and FTA Project
Construction Grant Agreements. The FAA would determine the distribution of funds through its
existing competitive process.


Prioritization: Prioritize funds on projects that are ready to go to construction and can be
underway within 90 days.


Shovel-Ready Deadlines: Require public transit agencies to award contracts for projects
totaling at least $625 million (25 percent) of these funds within 90 days of the date of grant
receipt. Require public transit agencies to award contracts for all of the funding within one
year of the date of enactment.


Economic Impact: Create more than 168,000 jobs and $30 billion of economic activity.

Furthermore, the additional $2.5 billion of New Starts funding will make available an
additional $5 billion of contingent commitment authority to enable FTA to sign additional
New Starts funding agreements for future transit construction projects.


Equal Opportunity: Pursuant to SAFETEA-LU, as a general rule, states, cities, and public transit
agencies are required to provide at least 10 percent ($250 million) of the amounts made available to
DBEs, including minority- and women-owned businesses.


14 What Causes Cost Overrun in Transport Infrastructure Projects?, Flyvbjerg, Holm and Buhl, January 2004.
Page 10


                                                     RAIL – $5 BILLION

Infrastructure Needs: Demand for intercity passenger rail has increased and Amtrak ridership is
higher than at any point in its history.

In 2007, the Passenger Rail Working Group of the National Surface Transportation Policy and
Revenue Study Commission reported that the total capital cost for re-establishing the national
intercity passenger rail network between now and 2050 is $357.2 billion, or an annualized cost of
$8.1 billion.

With respect to freight rail, DOT estimates that the demand for rail freight transportation –
measured in tonnage – will increase 88 percent by 2035. A study conducted by Cambridge
Systematics, Inc. estimates that an investment of $148 billion (in 2007 dollars) for rail infrastructure
expansion over the next 28 years is required to keep pace with economic growth and meet DOT’s
forecast demand. Of this amount, the short line and regional freight railroads’ share is projected to
be $13 billion, which includes $320 million for line expansion; $5 billion for major improvements to
tunnels, bridges, and clearances; and $7.23 billion for branch line upgrades.


Ready-to-Go Projects: Amtrak has identified at least $500 million in ready-to-go projects,
including car overhauls, replacement of aging equipment, fire and life safety improvements,
improvements to track, structures, electric traction, and communications and signals, and customer
and information technology enhancements, if additional funding is made available. Amtrak has
identified a total of $3.8 billion of projects that are ready to go to construction within two years.
Similarly, a December 2008 survey of 427 cities by the U.S. Conference of Mayors identified 41
Amtrak projects at a total cost of $1.1 billion that are ready to go to construction in 2009. 15
In addition, the States for Passenger Rail Coalition has identified $1.4 billion in ready-to-go intercity
passenger rail capital projects, including corridor development projects, station and terminal
improvements, improvements to track, siding, signal, and grade crossings, and the purchase of new
equipment. The States for Passenger Rail Coalition has identified a total of $9.4 billion of projects
that are ready to go to construction within two years. Similarly, the Midwest Interstate Passenger
Rail Commission has identified more than $815 million of high-speed and intercity passenger rail
projects that are ready to go to construction within 120 days.


The American Short Line and Regional Railroad Association has identified $511 million in ready-to-
go projects, including upgrades to rail and roadbed, bridges, tunnels, and intermodal terminals,
overhaul and replacement of existing locomotives to “green technology”, expansion of rail yards,
and grade crossing improvements.


Proposal:

            1. Provide $1.5 billion for capital grants to Amtrak;

            2. Provide $3.4 billion for high-speed and intercity passenger rail capital grants to
               States; and

            3. Provide $100 million for capital grants to short line and regional railroads.


Source: Appropriate funds from the General Fund.


Distribution: Distribute $1.5 billion of capital grants to Amtrak; distribute $3.4 billion of high-
speed intercity passenger rail capital grants to States through DOT competitive grant programs as
authorized by 49 U.S.C. 26106, as added by section 501 of the Passenger Rail Investment and
Improvement Act of 2008 (Division B of P.L. 110-432) and chapter 244 of Title 49, United States
Code, as added by section 301 of the Passenger Rail Investment and Improvement Act of 2008
(Division B of P.L. 110-432); and distribute $100 million of short line capital grants to regional and
short line railroads through a DOT competitive grant program as authorized by 49 U.S.C. 22301, as
amended by section 1112 of the Energy Independence and Security Act of 2007 (P.L. 110-140).


     MainStreet Economic Recovery, “Ready to Go” Jobs and Infrastructure Projects, U.S. Conference of Mayors, December 8, 2008.
15
Page 11


Prioritization: Prioritize funds on projects that are ready to go to construction and can be
underway within 90 days.
Page 12


Shovel-Ready Deadlines:

      1. Require Amtrak to award contracts for projects totaling at least $375 million (25
         percent) of these funds within 90 days of the date of grant receipt. Require
         Amtrak to award contracts for projects totaling at least $750 billion (50 percent) of
         these funds within one year of the date of enactment and award contracts for all
         of the funds within two years of the date of enactment;

      2. Require States to award contracts for projects totaling at least $850 million (25
         percent) of these funds within 90 days of the date of grant receipt. Require States
         to award contracts for projects totaling at least $1.7 billion (50 percent) of these
         funds within one year of the date of enactment and award contracts for all of the
         funds within two years of the date of enactment; and

      3. Require short line and regional railroads to award contracts for projects totaling
         at least $50 million (50 percent) of these funds within 90 days of the date of grant
         receipt. Require the railroads to award contracts for all of the funding within one
         year of the date of enactment.


Economic Impact: Create approximately 139,000 jobs and $25 billion of economic activity.
Page 13


                                       AVIATION
                        AIRPORT IMPROVEMENT PROGRAM – $5 BILLION

Infrastructure Needs: Increased investment in our airport infrastructure is necessary to maintain a
safe and efficient aviation system. The Federal Aviation Administration’s (“FAA”) recently-released
National Plan of Integrated Airport Systems (2009-2013) (“NPIAS”) estimates that there will be
$49.7 billion of Airport Improvement Program (“AIP”)-eligible projects during the next five years –
an increase of 21 percent compared to the last NPIAS that the FAA issued two years ago.
Additional funds are needed to allow the AIP program to keep pace with inflationary cost increases
and meet airport safety and capacity needs.


Ready-to-Go Projects: The FAA has identified at least $1.5 billion of ready-to-go AIP projects if
additional funding is made available. The FAA has identified a total of $5 billion of AIP projects
that are ready-to-go to construction within two years. These projects include runway or taxiway
rehabilitations, extensions, and widening; obstruction removal; apron construction, expansion or
rehabilitation; runway lighting improvements; signage improvements; security enhancements;
Airport Rescue and Firefighting equipment and facilities; and airside service or public access roads.


Proposal: Provide $5 billion for the Airport Improvement Program.


Source: Appropriate funds from the Airport and Airway Trust Fund.


Distribution: Distribute funds to airports through existing AIP Discretionary Grants program.
The FAA would determine the distribution of funds through its existing competitive process.


Prioritization: Prioritize funds on projects that are ready to go to construction and can be
underway within 90 days.

Shovel-Ready Deadlines: Require airports to award contracts for projects totaling at least $1
billion (20 percent) of these funds within 90 days of the date of grant receipt. Require
airports to award contracts for projects totaling at least $2.5 billion (50 percent) of these
funds within one year of the date of enactment and award contracts for all of the funds
within two years of the date of enactment.


Economic Impact: Create approximately 174,000 jobs and $31 billion of economic activity.
Page 14


                                          AVIATION
                          FAA FACILITIES & EQUIPMENT – $250 MILLION

Infrastructure Needs: The Federal Aviation Administration (“FAA”) has a significant backlog of
infrastructure projects needed to sustain or replace existing air traffic control facilities. In addition,
the FAA could accelerate the installation of runway safety technology and equipment at airports if
additional funding is made available. Runway incursions are an identified risk that can be mitigated
by installing systems such as the Airport Surface Detection Equipment Model X (“ASDE X”) and
Runway Status Lights. Accelerated installation of these systems would provide immediate economic
stimulus in the form of construction jobs, as well as increased safety to the public.


Ready-to-Go Projects: The FAA has identified at least $185 million in infrastructure projects and
$65 million in runway safety projects that are ready to go within 90 to 180 days, if additional funding
is made available.

The infrastructure projects include:
      Backup Power Systems: Fund backup power projects such as battery, engine generator and
       cable replacements, enroute traffic control center power improvements, and lightning
       protection ($40 million).
      Enroute Traffic Control Center Modernization/Sustainment: Fund modernization and
       sustainment of enroute traffic control centers ($40 million).
      Air Traffic Control Tower/Approach Control (“TRACON”) Facilities: Fund replacement
       of air traffic control towers and approach control facilities that are in poor condition.
       TRACON replacement projects have completed design and engineering, and contracts could
       be awarded within three or four months of receipt of funding ($80 million).
      Navigation and Landing/Unmanned Air Traffic Control facilities sustainment: Fund
       installation and sustainment of Instrument Landing Systems ($15 million).
      FAA Technical Center and Aeronautical Center: Fund facility sustainment of the FAA’s
       Technical Center and Aeronautical Center ($10 million).
The runway safety projects include:
      Accelerate Installation of ASDE X: Accelerate installation of ASDE X, which is a surface
       surveillance system that processes information from radar and other sources to provide
       location and aircraft identification information to air traffic controllers, at major airports.
       ASDE X provides controllers with a visual representation of the traffic situation on the
       airport surface and arrival corridors. The accelerated installation can be accomplished under
       the existing AXDE X contract ($15 million).
      Accelerate Installation of Runway Status Lights: Accelerate installation of Runway Status
       Light (“RWSL”) systems. Implementation includes construction of lighting equipment at
       airports equipped with ASDE X technology to share common runway status information
       with pilots. The accelerated installation can be accomplished under the existing RWSL
       contract ($50 million).


Proposal: Provide $250 million for the FAA’s Facilities and Equipment program.


Source: Appropriate funds from the Airport and Airway Trust Fund.


Distribution: Distribute funds through the FAA’s existing administrative processes.


Prioritization: Prioritize funds on projects that are ready to go to construction and can be
underway within 90 days.


Shovel-Ready Deadlines: Require the Federal Aviation Administration to award contracts
for projects totaling at least $125 million (50 percent) of these funds within 90 days of the
date of enactment. Require the FAA to award contracts for all of the funding within one
year of the date of enactment.


Economic Impact: Create approximately 7,000 jobs and $1.55 billion of economic activity.
Page 15


                                     ENVIRONMENTAL INFRASTRUCTURE
                                      CLEAN WATER SRF – $12 BILLION

Infrastructure Needs: High quality drinking water and wastewater treatment are critical to
protecting human health and the environment. The Congressional Budget Office estimates that
there is an annual investment need of between $11.6 billion and $20.1 billion to ensure a safe, clean
supply of drinking water, and an additional need for annual investment of between $13 billion and
$20.9 billion in wastewater treatment. Given current funding levels from all sources, there is an
annual investment gap for wastewater and drinking water infrastructure of at least $3 billion
and as much as $19.4 billion.

There are 772 communities in 33 states and the District of Columbia with a total of 9,471 identified
combined sewer overflow problems. Combined sewer overflows contribute to the ongoing
contamination of the nation’s waters by releasing approximately 850 million gallons of raw or
partially-treated sewage annually. In addition, the Environmental Protection Agency (“EPA”)
estimates that between 23,000 and 75,000 sanitary sewer overflows occur each year in the United
States, releasing between 3 to 10 billion gallons of sewage per year. The EPA estimates that more
than $50.6 billion is necessary to correct combined sewer overflow problems, and an additional
$88.5 billion to eliminate sanitary sewer overflows.

While the demand for Clean Water State Revolving Fund (“Clean Water SRF”) funds is increasing,
appropriations have declined significantly. The decreased funding has created a pent-up demand in
the States for project funding. Needs are driven by new treatment requirements that must be met
(e.g., to control nutrients, sewer overflows, stormwater and nonpoint sources), as well as aging
infrastructure that must be replaced or repaired to maintain current levels of pollution control.
There are additional needs to implement “green infrastructure” technologies, such as on-site source
controls to capture stormwater, stream buffers, and other water reuse technologies, that provide
equal or greater environmental benefit at a reduced cost, reduce wet-weather related “peak” loads,
and promote water conservation and reuse. Similarly, there is a significant need for energy-
efficiency improvements at publicly owned treatment works.


Ready-to-Go Projects: A recent survey by the Council of Infrastructure Financing Authorities and
the Association of State and Interstate Water Pollution Control Administrators (“ASIWPCA”)
identified $10 billion of Clean Water SRF projects (with only 30 States reporting) that are ready to
go to construction if additional funding is made available. For example, most wastewater treatment
utilities have small capital-related projects on the shelf that could be carried out very quickly, such as
pumps, compressors, bar screens, trucks, security measures, and polishing pond expansions.
Similarly, a December 2008 survey of 427 cities by the U.S. Conference of Mayors identified 2,536
water and wastewater treatment projects at a total cost of $15.4 billion that are ready to go to
construction in 2009. 16 Finally, American Rivers has identified 77 “green infrastructure” projects
(with only 13 States and the District of Columbia reporting) valued at more than $600 million that
could be obligated within six months of the date of enactment.

Proposal: Provide an additional $12 billion to construct, rehabilitate, and modernize the
nation’s wastewater infrastructure through the Clean Water SRF program. Within the
existing Clean Water SRF allocation to States, direct individual State infrastructure
financing authorities to: (1) utilize 40 percent of the capitalization grants for additional
subsidizations or grants to disadvantaged communities and communities with populations
of 50,000 individuals or fewer, and (2) utilize 15 percent of the capitalization grant for
investment in projects or technologies that use environmentally sensitive, and energy and
water efficient plans or components (i.e., green infrastructure).


Source: Appropriate funds from the General Fund.


Distribution: Distribute $12 billion for the Clean Water SRF pursuant to the existing Clean Water
Act distribution formula.

The Clean Water SRF serves communities of all sizes – 75 percent of loans have been made to
communities with a population of less than 10,000 and 45 percent of the funds have gone to
communities with a population of 100,000 or more. However, in 1987, Congress converted the

     MainStreet Economic Recovery, “Ready to Go” Jobs and Infrastructure Projects, U.S. Conference of Mayors, December 8, 2008.
16
Page 16


Clean Water Construction Grants program to the Clean Water SRF. As a result, Federal wastewater
infrastructure funding for most medium-sized and smaller communities (communities with
populations of 50,000 individuals or fewer) has come in the form of loans under the SRF rather than
grants. Under this proposal, State infrastructure financing authorities are required to utilize 40
percent of the capitalization grant for additional subsidizations or grants to communities with
populations of 50,000 individuals or fewer, thereby increasing the affordability of wastewater
infrastructure projects to many medium-sized and smaller communities.

In addition, this proposal requires State infrastructure financing authorities to utilize an additional 15
percent of the capitalization grant for “green technologies”, either through additional subsidizations,
grants, or other mechanisms that encourage investment in projects or technologies which utilize
environmentally sensitive, and energy and water efficient plans or components.


Prioritization: Prioritize funds on projects that are ready to go to construction and can be
underway within 90 days.


Shovel-Ready Deadlines: Require State infrastructure financing authorities to award
contracts for projects totaling at least $3 billion (25 percent) of these funds within 90 days of
the date of allocation. Require authorities to award contracts for projects totaling at least $6
billion (50 percent) of these funds within one year and award contracts for all of the funding
within two years of the date of enactment.


Economic Impact: Create approximately 334,000 jobs and $59 billion of economic activity.
Page 17


                             ENVIRONMENTAL INFRASTRUCTURE
                         ALTERNATIVE WATER SOURCE – $500 MILLION

Infrastructure Needs: In recent years, there has been increasing interest by communities across
the nation to ensure the availability of water sources to meet future water supply needs. Growth in
population, increased awareness of the impacts of global climate change, and increasing
environmental awareness are causing many communities to explore alternative water supplies
through reclamation, reuse, and conservation of water and wastewater.

Although alternative water source projects are eligible under the Clean Water Act SRF program,
most Clean Water SRF funding is used to finance traditional wastewater infrastructure projects, not
projects to enhance water supplies.

In 2000, Congress enacted the Estuaries and Clean Waters Act (P.L. 106-457), which created a
competitive grant pilot program for alternative water source projects (section 220 of the Clean
Water Act.)


Proposal: Provide an additional $500 million for the Environmental Protection Agency’s
(“EPA”) Alternative Water Source Program.


Source: Appropriate funds from the General Fund.


Distribution: Distribute funds to States, water resource development agencies, local government
agencies, private utilities, and nonprofit entities through EPA’s competitive grant process.


Prioritization: Prioritize funds on projects that are ready to go to construction and can be
underway within 90 days.


Shovel-Ready Deadlines: Require States, water resources development agencies, local
government agencies, private utilities, and nonprofit entities to award contracts for projects
totaling at least $125 million (25 percent) of these funds within 90 days of the date of grant
receipt. Require that authorities to award contracts totaling at least $250 million (50
percent) of these funds within one year and award contracts for all of the funding within two
years of the date of enactment.


Economic Impact: Create more than 13,900 jobs and $2.4 billion of economic activity.
Page 18


                          ENVIRONMENTAL INFRASTRUCTURE –
                   NONPOINT SOURCE MANAGEMENT PROGRAM – $1 BILLION

Infrastructure Needs: Over the past 30 years, the Clean Water Act has made great advances in
improving the quality of U.S. waters and controlling various sources of pollution, with one large
exception – nonpoint sources of pollution. Nonpoint source pollution refers to the polluting of
water by diffuse sources rather than single identifiable “point” sources. These diffuse sources are
usually associated with land use activities as opposed to end-of-pipe discharges. Examples of
common nonpoint source pollutants include: sediments, fertilizers, and pesticides from rural farms
and urban lawns; bacteria and viruses from livestock and pet waste; sediments and soil from
improperly managed construction sites and timber harvesting; oil and chemicals from urban runoff
flowing over streets, parking lots, and industrial facilities; and a variety of pollutants from airborne
pathways. After 36 years of Federal and state efforts to protect water quality, the single largest
remaining and uncontrolled contributor of pollutants to the nation’s waters is nonpoint sources. In
fact, EPA has estimated that 90 percent of the nation’s impaired waters are contaminated, in part, by
nonpoint sources of pollution.

In 1987, Congress amended the Clean Water Act to establish the section 319 Nonpoint Source
Management Program because it recognized the need for greater Federal leadership to help focus
State and local nonpoint source efforts. Under section 319 of the Clean Water Act, States,
Territories, and Indian Tribes receive grants which support a wide variety of activities including
technical assistance, financial assistance, education, training, technology transfer, demonstration
projects, and monitoring to assess the success of specific nonpoint source implementation projects.
Section 319 funds are allocated to each State according to the Environmental Protection Agency’s
(“EPA”) administrative allocation formula.

In fiscal year 2008, Congress appropriated $201 million for the Nonpoint Source Management
Program.

According to the most recent EPA Clean Water Needs Survey, total nonpoint source needs over the
next 20 years are $38 billion or $1.9 billion annually on average. However, this amount does not
include data from all States and all categories of nonpoint sources of pollution.

A recent report published by the Association of State and Interstate Water Pollution Control
Administrators (“ASIWPCA”), entitled “Call for Change”, notes that the current level of section 319
funding is not sufficient to run a comprehensive nonpoint source program. For example, according
to a State survey conducted by ASWIPCA, States in the Northeast have reported that they could
utilize 100 percent to 500 percent more section 319 funding than is currently allocated to these
States. These projections, however, are likely to be much larger for the agricultural-intensive
Midwestern States.


Proposal: Provide $1 billion for EPA’s Nonpoint Source Management Program.


Source: Appropriate funds from the General Fund.


Distribution: Distribute funds to States pursuant to EPA’s existing administrative allocation
formula. The allocation formula is contained in Appendix G of EPA’s 1997 Nonpoint Source
Guidance.


Prioritization: Prioritize funds on projects that are ready to go to construction and can be
underway within 90 days.


Shovel-Ready Deadlines: Require States to award contracts for projects totaling at least
$250 million (25 percent) of these funds within 90 days of the date of allocation. Require
States to award contracts for projects totaling at least $500 million (50 percent) of these
funds within one year and award contracts for all of the funding within two years of the date
of enactment.


Economic Impact: Create more than 27,800 jobs and $4.96 billion of economic activity.
Page 19


                              ENVIRONMENTAL INFRASTRUCTURE
                          NATIONAL ESTUARY PROGRAM – $100 MILLION

Infrastructure Needs: The National Estuary Program is intended to promote comprehensive
planning efforts to help protect nationally significant estuaries in the United States that are deemed
to be threatened by pollution, development, or overuse. Twenty-eight estuaries are currently
authorized by the Clean Water Act, including Chesapeake Bay, Long Island Sound, New York and
Connecticut; Narragansett Bay, Rhode Island; Puget Sound, Washington; San Francisco Bay,
California; and Galveston Bay, Texas.

National Estuary Program (“NEP”) offices are intended to utilize Federal funds, in part, to leverage
additional resources from state and local governments, and from public and private sector sources.
Over the past two decades, NEPs have attracted funding from a variety of sources and partnerships
including the Clean Water State Revolving Fund program, stormwater utility fees, municipal bond
funding, fines and settlements, and sales fees. According to the Environmental Protection Agency
(“EPA”), the National Estuary Program received a total of $85 million between fiscal years 2003 and
2007. However, the Program was able to leverage nearly $1.3 billion in funding from non-EPA
sources. This is a funding ratio of non-EPA to EPA funds of 15.5 to 1.

EPA exercises oversight authority over the local NEP programs, and provides technical assistance
(e.g., finance planning, smart growth, monitoring and assessment) and programmatic assistance
(policy development) to estuary management programs. For example, estuary management
programs are required to periodically monitor the effectiveness of their management activities to
address estuary-specific priority actions (as established through the Management Conference).


Ready-to-Go Projects: The Restore America’s Estuaries coalition, which represents 11 of the
nation’s 28 estuary management programs, conducted a study of a majority of all 28 estuaries and
identified $71.6 million in 121 ready-to-go projects, including projects to address stormwater runoff,
create tidal lagoons for habitat restoration, and restore wetlands.


Proposal: Provide $100 million for the National Estuary Program.


Source: Appropriate funds from the General Fund.


Distribution: Distribute funds to estuary management programs through EPA’s current
administrative process.


Prioritization: Prioritize funds on projects that are ready to go to construction and can be
underway within 90 days.


Shovel-Ready Deadlines: Require estuary management programs to award contracts for
projects totaling at least $50 million (50 percent) of these funds within 90 days of the date of
grant receipt. Require estuary management programs to award contracts for projects
totaling at least $75 million (75 percent) of these funds within one year and award contracts
for all of the funding within two years of the date of enactment.


Economic Impact: Create approximately 2,780 jobs and $500 million of economic activity.
Page 20


                         ENVIRONMENTAL INFRASTRUCTURE
      GREAT LAKES LEGACY CONTAMINATED SEDIMENT REMEDIATION – $400 MILLION

Infrastructure Needs: The Great Lakes Legacy Act authorizes funding to clean up contaminated
sediment sites in those areas of the U.S. Great Lakes that have areas of concern. This funding is
used for remediation, public outreach, and research. Legacy Act cleanup is primarily focused on
those sites that are not National Priorities List (i.e., Superfund) sites.

Thirty-one areas of concern – with multiple discrete hazardous waste sites eligible for Legacy Act
funding – exist in and around the Great Lakes. Sites with high concentrations of toxic substances
are often the historical, or legacy, remnants of former industrial pollution. While the discharge of
these pollutants has largely ceased, these historical pollutants remain in contaminated sediment in
those areas. Due, in part, to stagnant funding levels, only four discrete hazardous waste sites (within
U.S. areas of concern) have been remediated since the Legacy Act was enacted in 2002.

Legacy Act remediation projects are conducted through negotiated agreements between the
Environmental Protection Agency (“EPA”) and a non-Federal sponsor. Cleanup projects are cost-
shared, with the non-Federal sponsor being responsible for 100 percent of the operation and
maintenance costs. Projects are first monitored and evaluated by EPA to determine the nature and
extent of contamination. Pursuant to the Great Lakes Legacy Reauthorization Act of 2008 (P.L.
110-365), the Federal Government is responsible for 100 percent of initial site assessment costs.
After site assessment, the non-Federal sponsor enters into a cost-share agreement with the Federal
Government and remediation begins. When remediation is complete at a site, or project, in a given
area of concern and beneficial uses are no longer impaired, an area of concern can be delisted.

The Great Lakes Commission, which includes State-elected representatives from each of the eight
Great Lakes States, recommends an additional $250 million for Legacy Act projects for the
upcoming fiscal year.


Ready-to-Go Projects: The Environmental Protection Agency has identified $160 million of
Legacy Act ready-to-go projects. EPA has identified a total of $657 million of Legacy Act projects
that are ready-to-go to construction within two years.


Proposal: Provide $400 million for EPA’s Great Lakes Legacy Act Program.


Source: Appropriate funds from the General Fund.


Distribution: Distribute funds to Legacy Act projects through EPA’s current administrative
process.


Prioritization: Prioritize funds on projects that are ready to go to construction and can be
underway within 90 days.


Shovel-Ready Deadlines: Require non-Federal sponsors to award contracts for projects
totaling at least $100 million (25 percent) of these funds within 90 days of the date of grant
receipt. Require non-Federal sponsors to award contracts for projects totaling at least $200
million (50 percent) of these funds within one year and award contracts for all of the funding
within two years of the date of enactment.


Economic Impact: Create approximately 11,000 jobs and $2 billion of economic activity.
Page 21


                              ENVIRONMENTAL INFRASTRUCTURE
                                BROWNFIELDS – $275 MILLION

Infrastructure Needs: Brownfields are properties, the expansion, redevelopment, or reuse of
which may be complicated by the presence or potential presence of a hazardous substance,
pollutant, or contaminant. Types of brownfields include inactive factories, gas stations, salvage
yards, or abandoned warehouses. These sites drive down property values, provide little or no tax
revenue, and contribute to community blight. There are estimated to be between 450,000 to one
million brownfields sites in the United States. Redevelopment of these abandoned sites can
promote economic development, revitalize neighborhoods, enable the creation of public parks and
open space, or preserve existing properties, including undeveloped green spaces.

According to Environmental Protection Agency (“EPA”) statistics, Federal funding of brownfields
cleanup has a significant beneficial impact on state and local governments, in terms of returning
underutilized properties to productive use and local tax rolls, as well a proven track record of
leveraging additional public and private sector redevelopment funding and job creation. According
to EPA, since the enactment of EPA’s brownfields program in 2002, the Federal investment of
$593.7 million has leveraged more than $10.4 billion in cleanup and redevelopment funding and
helped create 47,201 jobs in cleanup, construction, and redevelopment. Given current Federal
funding levels (approximately $70 million per year), there is an annual investment gap of
approximately $280 million for backlogged applications for brownfield projects.


Ready-to-Go Projects: In fiscal year 2008, the Environmental Protection Agency received 845
proposals requesting funding, but announced that only 209 projects were selected to receive 314
assessment, revolving loan fund, and cleanup grants totaling $74 million. Fully funding these 845
proposals would require a total of $350 million.


Proposal: Provide $275 million for EPA’s Brownfields Discretionary Grant Program.


Source: Appropriate funds from the General Fund.


Distribution: Distribute funds to States, cities, and redevelopment agencies through existing EPA
Brownfields Discretionary Grant program for site assessments, remediation and cleanup grants, and
to capitalize state brownfield revolving loan programs as authorized under section 104(k) of the
Comprehensive Environmental Response, Compensation, and Liability Act of 1980, as amended by
the Brownfields Revitalization and Environmental Restoration Act of 2001 (P.L. 107-118).


Prioritization: Prioritize funds on projects that are ready to go to construction and can be
underway within 90 days.


Shovel-Ready Deadlines: Require States, cities, and redevelopment agencies to award
contracts for projects totaling at least $137.5 million (50 percent) of these funds within 90
days of the date of grant receipt. Require States, cities, and redevelopment agencies to
award contracts for all of the funding within one year of the date of enactment.


Economic Impact: Create more than 7,600 jobs and $1.4 billion of economic activity.
Page 22


                         U.S. ARMY CORPS OF ENGINEERS – $7 BILLION

Infrastructure Needs: Due to relatively flat funding for the U.S. Army Corps of Engineers’
(“Corps”) budget over the last 20 years, there has been an ever increasing backlog of unfunded or
underfunded flood control, navigation, and environmental restoration projects. This backlog has
resulted in increased timelines for project completion, tremendous cost overruns due to inflation,
and denied benefits to public safety, the environment, and the economy. The current total for the
backlog of authorized projects is estimated to be $60 billion.

Many existing Corps projects are advancing more slowly than they could be because of lack of
funding. For example, considering only those projects for which funding was requested in the
President’s FY 2009 Budget, the Corps could proceed with a total of $8 billion for these projects in
FY 2009. However, the President only requested $5.242 billion for the Corps, more than one-third
less than necessary to fund these FY 2009 projects at full capability. These figures do not include
any funding for projects authorized in the recent Water Resources Development Act of 2007 or
many other projects which were authorized in prior Water Resources Development Acts.


Ready-to-Go Projects: According to the Corps, additional funds could be used for the following
ready-to-go projects:
       substantially reduce the backlog of critical maintenance and repairs at approximately 360
        multiple purpose, flood control, hydropower, recreation, water supply, and navigation
        projects;
       repair several high-risk dam safety projects;
       rehabilitate and upgrade hydropower plants to achieve an industry standard of 98 percent
        plant availability;
       address the oldest and most at-risk projects on the inland waterways system;
       expedite the construction of critical environmental projects, returning critical ecosystems to
        a more natural state sooner than would otherwise be possible. Projects producing beneficial
        impacts on more than one million acres could be expedited. Of these outputs,
        approximately 90 percent are nationally significant and would contribute greatly to long-term
        environmental sustainability;
       dredge the nation’s 296 highest-use, deep-draft commercial ports to their authorized depths.
        Approximately 94 percent of the nation’s imports and exports are carried through these
        ports;
       dredge our inland waterways to authorized depth and width to facilitate the movement of
        approximately 750 million tons of freight per year, including the majority of the nation’s
        agricultural exports and bulk commodities such as iron ore, coal, fertilizer, and bulk road
        construction materials; and
       repair and upgrade critical flood damage reduction and hurricane and storm damage
        reduction projects that serve as a defense to key population centers.


Proposal:

       1. Provide an additional $3.0 billion for the Corps of Engineers Construction
          program;

       2. Provide an additional $3.2 billion for the Corps of Engineers Operations and
          Maintenance program; and

       3. Provide an additional $800 million for the Corps of Engineers Mississippi River
          and Tributaries program.


Source: Appropriate funds from the General Fund and the Harbor Maintenance Trust Fund.


Distribution: Distribute funds to the Corps of Engineers. The Corps would determine the
distribution of funds through its existing project selection process.
Page 23


Prioritization: Prioritize funds on projects that are ready to go to construction and can be
underway within 90 days.


Shovel-Ready Deadlines: Require the Corps of Engineers to award contracts for projects
totaling at least $1.4 billion (20 percent) of these funds within 90 days of the date of
enactment. Require the Corps to award contracts totaling at least $3.5 billion (50 percent) of
these funds within one year and award contracts for all of the funding within two years of
the date of enactment.


Economic Impact: Create approximately 147,000 jobs and $34 billion of economic activity.

According to the Corps, it is estimated that $7 billion of additional funding would create 147,000
new jobs. These new jobs would include almost 52,800 new private sector jobs with the average
income for workers in these jobs of $38,000 to $42,500. In addition, this funding would create an
additional 94,200 new jobs in industries supplying the construction and operation and maintenance
activities and the industries that sell goods and services to these new workers and their families.
Page 24


                                FEDERAL BUILDINGS – $9.7 BILLION

Infrastructure Needs: According to the General Services Administration (“GSA”), capital
reinvestment requirements to maintain existing Federal buildings exceed $7 billion. Federal building
infrastructure in the United States has long been neglected. Numerous studies indicate that the
nation’s ability to make efficient resource allocations for vital infrastructure is hampered by
entrenched obstacles that include competing interests, legal and budgetary limitations, and the bias
in the existing budget process against capital planning.

Moreover, Federal buildings have high energy cost requirements. Each year, GSA spends more than
$450 million on energy costs on the government-owned inventory of Federal buildings.
Renovations of Federal buildings include important energy and water conservation measures.
Pursuant to sections 431 and 433 of the Energy Independence and Security Act of 2007 (P.L. 110-
140) and Executive Order 13423, these renovations must reduce the energy cost of the building by
at least 20 percent and reduce the consumption of fossil fuel-generated electricity by 55 percent
below comparable buildings. For instance, GSA proposes to renovate the Federal building at 1800
F Street in Washington, D.C., which was constructed in 1917. The proposed renovation includes
installing a photovoltaic roof and geothermal technology to increase the efficiency of the chilled-
water plant on the site. Similarly, the construction of new Federal buildings with significant
renewable energy components, particularly photovoltaic systems, can provide Federal leadership to
reduce our nation’s dependence on foreign oil and address global climate change.


Ready-to-Go Projects: GSA has identified $4.88 billion of major repair and alteration and new
construction projects that are ready to go to construction within 90 to 120 days if additional funding
is made available. According to GSA, these ready-to-go Federal building, U.S. courthouse, and
border station projects include 29 major repair and alteration projects in 18 States and the District of
Columbia, at a cost of $3.15 billion. The renovations of these Federal buildings and U.S.
courthouses include important energy and water conservation elements. In addition, GSA has
identified $513 million of small ready-to-go repair projects nationwide under its non-prospectus and
energy and water conservation programs. Finally, GSA has identified 10 Federal buildings, U.S.
courthouses, and border stations in 10 States that are ready to go to construction, at a cost of $1.2
billion, within 120 days.

In addition, GSA has identified a total of $21.3 billion of major repair and alteration and new
construction projects that are ready to go to construction within two years if additional funding is
made available. These projects include 47 major repair and alteration projects in 24 States and the
District of Columbia, at a cost of $6.27 billion. In addition, GSA has identified $914 million of
small ready-to-go repair projects nationwide under its non-prospectus and energy and water
conservation programs. Finally, GSA has identified 107 new Federal buildings, U.S. courthouses,
and border stations across the country that are ready-to-go to construction, at a cost of $14.1 billion,
within two years.


Proposal:

        1. Provide $6 billion for repair and alteration of Federal buildings and U.S.
           courthouses; and

        2. Provide $3.7 billion for construction of Federal buildings, U.S. courthouses, and
           border stations

        3. Of the amounts provided, not less than $1 billion shall be available for the repair,
           alteration, and construction of U.S. courthouses. Funds are available for
           construction of a U.S. courthouse only if the design of the project provides
           courtroom space for senior judges for up to 10 years from senior status not to
           exceed one courtroom for every two senior judges.


Source: Appropriate funds from the General Fund.


Distribution: Distribute funds through existing GSA prospectus and non-prospectus programs.
GSA would determine the distribution of funds through its existing administrative processes.
Page 25


Prioritization: Prioritize funds on projects that are ready to go to construction and can be
underway within 90 days.


Shovel-Ready Deadlines: Require GSA to award contracts for projects totaling at least $2.43
billion (25 percent) of these funds within 90 days of the date of enactment. Require GSA to
award contracts for projects totaling at least $4.85 billion (50 percent) of these funds within
one year and award contracts for all of the funding within two years of the date of
enactment.


Economic Impact: Create approximately 270,000 jobs and $48 billion of economic activity.
Page 26


                           SMITHSONIAN INSTITUTION – $270 MILLION

Infrastructure Needs: According to the Smithsonian Institution, there is an urgent need for capital
investment in several of the Institution’s landmark facilities to maintain and upgrade these facilities.
Energy efficiency upgrades comprise about 50 percent of the capital funding needs.


Ready-to-Go Projects: The Smithsonian Institution has identified more than $403 million of
projects that are ready to go to construction in fiscal year 2009 if additional funding is made
available. These ready-to-go projects include repair and alteration of the Smithsonian Institution’s
Arts and Industries Building and National Zoo and construction of the Smithsonian Environmental
Research Center Mathias Laboratory.


Proposal: Provide $270 million for repair, alteration, and construction of Smithsonian
Institution facilities.


Source: Appropriate funds from the General Fund.


Distribution: Distribute funds through the Smithsonian Institution’s existing administrative
processes.


Prioritization: Prioritize funds on projects that are ready to go to construction and can be
underway within 90 days.


Shovel-Ready Deadlines: Require the Smithsonian Institution to award contracts for
projects totaling at least $135 million (50 percent) of these funds within 90 days of the date of
enactment. Require the Smithsonian Institution to award contracts for all of the funding
within one year of the date of enactment.


Economic Impact: Create more than 7,500 jobs and $1.3 billion of economic activity.
Page 27


                           ARCHITECT OF THE CAPITOL – $20 MILLION

Infrastructure Needs: According to the Architect of the Capitol (“AOC”), there is an urgent need
for capital investment in several AOC facilities to maintain and upgrade these facilities. These
projects include energy efficiency upgrades and life safety and security upgrades.


Ready-to-Go Projects: The AOC has identified eight projects that are ready to go to construction
within 90 to 120 days if additional funding is made available. These projects include roof
replacement, street repaving, security barrier replacement, and Capitol Power Plant infrastructure
maintenance.


Proposal: Provide $20 million for repair and alteration of U.S. Capitol Complex facilities
and grounds.


Source: Appropriate funds from the General Fund.


Distribution: Distribute funds through the Architect of the Capitol’s existing administrative
processes.


Prioritization: Prioritize funds on projects that are ready to go to construction and can be
underway within 90 days.


Shovel-Ready Deadlines: Require the Architect of the Capitol to award contracts for
projects totaling at least $10 million (50 percent) of these funds within 90 days of the date of
enactment. Require the Architect of the Capitol to award contracts for all of the funding
within one year of the date of enactment.


Economic Impact: Create more than 550 jobs and $99 million of economic activity.
Page 28


                 ECONOMIC DEVELOPMENT ADMINISTRATION – $400 MILLION

Infrastructure Needs: The Economic Development Administration (“EDA”) is uniquely
positioned to provide effective and timely job creation and economic development assistance to
economically distressed communities. EDA assistance is available to rural and urban areas of the
nation experiencing high unemployment, low income, or other severe economic distress.

EDA provides grants to construct and rehabilitate essential public infrastructure and facilities
necessary to generate or retain long-term private sector jobs and investments, attract private sector
capital, and promote regional competitiveness. Typical projects include investments in facilities such
as water and sewer systems, industrial access roads, industrial and business parks, port facilities,
distance learning facilities, skill-training facilities, business incubator facilities, brownfield
redevelopment, eco-industrial facilities, and telecommunications and broadband infrastructure
improvements necessary for business creation, retention, and expansion.


Ready-to-Go Projects: EDA’s local partners have a significant backlog of ready-to-go economic
development projects that have been stalled because of a lack of funds. According to the National
Association of Development Organizations, an informal survey of a small sample of its members
identified more than 200 projects with a total Federal cost of $885 million that are ready to go to
construction if additional funding is made available. These projects would leverage an estimated $3
billion in private investment.


Proposal: Provide $400 million for the Economic Development Administration.


Source: Appropriate funds from the General Fund.


Distribution: Distribute funds to local partners through EDA’s existing project selection
processes. Some of these funds should be specifically focused on addressing sudden and severe
economic dislocation caused by the downturn in U.S. automotive manufacturing.


Prioritization: Prioritize funds on projects that are ready to go to construction and can be
underway within 90 days.


Shovel-Ready Deadlines: Require EDA grant recipients to award contracts for projects
totaling at least $100 million (25 percent) of these funds within 90 days of the date of grant
receipt. Require EDA to award contracts for projects totaling at least $200 million (50
percent) of these funds within one year and award contracts for all of the funding within two
years of the date of enactment.


Economic Impact: Create approximately 11,000 jobs and $2 billion of economic activity.
Page 29


                                MARITIME TRANSPORTATION
                           GREAT LAKES ICEBREAKER – $153 MILLION

Infrastructure Needs: Additional icebreaking capacity is needed on the Great Lakes to provide for
safe navigation of ships supplying iron ore and other raw materials to U.S. heavy industries. During
the winter months, commercial ships transport more than $2 billion worth of materials to U.S.
industries.


Ready-to-Go Project: This proposal would fund construction of a sister icebreaker to the
MACKINAW. The Coast Guard has an existing contract with the shipyard that built the
MACKINAW. If funds are made available to construct another Great Lakes icebreaker, the
shipyard is expected to hire 50 workers within 30 days to begin construction. An additional Great
Lakes icebreaker would enable the Coast Guard to reassign the buoy tender ALDER, which
currently operates in the Great Lakes, to meet other buoy tending needs in the United States.


Proposal: Provide $153 million for a Coast Guard Great Lakes Icebreaker.


Source: Appropriate funds from the General Fund.


Distribution: Distribute funds through the Coast Guard’s existing administrative processes.


Prioritization: Prioritize funds on projects that are ready to go to construction and can be
underway within 90 days.


Economic Impact: Create more than 4,250 jobs (including 150-200 direct shipyard jobs) and
$750 million of economic activity.


Equal Opportunity: As a general rule, the Coast Guard is required to provide at least 10 percent
($15.3 million) of the amounts made available to DBEs, including minority- and women-owned
businesses.
Page 30


                                MARITIME TRANSPORTATION
                         COAST GUARD SHORE FACILITIES – $100 MILLION

Infrastructure Needs: The Coast Guard has a significant backlog of needed repairs for aging
Coast Guard shore facilities, including personnel housing, air stations, sector offices, small boat
stations, and the dormitory at the Coast Guard Academy.


Ready-to-Go Projects: The Coast Guard has more than $1 billion in deferred facility repair and
improvement projects. Many of these projects are ready to go to construction within 90 to 120 days
if additional funding is made available.


Proposal: Provide $100 million for the Coast Guard’s Acquisition, Construction, and
Improvements program to fund ready-to-go Coast Guard shore facility repair projects.


Source: Appropriate funds from the General Fund.


Distribution: Distribute funds through the Coast Guard’s existing administrative processes.


Prioritization: Prioritize funds on projects that are ready to go to construction and can be
underway within 90 days.


Shovel-Ready Deadlines: Require the Coast Guard to award contracts for projects totaling
at least $50 million (50 percent) of these funds within 90 days of the date of enactment.
Require the Coast Guard to award contracts for all of the funding within one year of the date
of enactment.


Economic Impact: Create approximately 2,780 jobs and $500 million of economic activity.


Equal Opportunity: As a general rule, the Coast Guard is required to provide at least 10 percent
($10 million) of the amounts made available to DBEs, including minority- and women-owned
businesses.
Page 31


                              MARITIME TRANSPORTATION
                     COAST GUARD BRIDGE ALTERATIONS – $481 MILLION

Infrastructure Needs: The Coast Guard bridge alteration program provides Federal funding to
remove or alter bridges that are a safety hazard to navigation and an unreasonable obstruction to
navigation. This program is normally funded at approximately $15 million per year. Increasing
funding for this program would help eliminate the $481 million backlog of unfunded projects and
create jobs across the United States.


Ready-to-Go Projects: The Coast Guard has 12 bridge alteration projects that are ready to go to
construction within 90 to 120 days if additional funding is made available.


Proposal: Provide $481 million for the Coast Guard's Alteration of Bridges program.


Source: Appropriate funds from the General Fund.


Distribution: Distribute funds through the Coast Guard’s existing administrative processes.


Prioritization: Prioritize funds on projects that are ready to go and can be underway within 90
days.


Shovel-Ready Deadlines: Require the Coast Guard to award contracts for projects totaling
at least $120 million (25 percent) of these funds within 90 days of the date of enactment.
Require the Coast Guard to award contracts for projects totaling at least $240 million (50
percent) of these funds within one year and award contracts for all of the funding within two
years of the date of enactment.


Economic Impact: Create approximately 13,380 jobs and $2.4 billion of economic activity.


Equal Opportunity: As a general rule, the Coast Guard is required to provide at least 10 percent
($48.1 million) of the amounts made available to DBEs, including minority- and women-owned
businesses.
Page 32


                              MARITIME TRANSPORTATION
                               SHORT SEA SHIPPING AND
                    RENEWABLE ENERGY LOAN GUARANTEES – $45 MILLION

Infrastructure Needs: Subtitle C of Title XI of the Energy Independence and Security Act of 2007
(P.L. 110-140) established within the Maritime Administration a program to identify and promote
short sea shipping in the United States. Short sea shipping is the transportation of goods and
passengers by water between U.S. ports. These projects can help eliminate truck traffic and reduce
highway congestion. In addition, the Maritime Administration has a loan guarantee program for the
construction of ocean renewable energy facilities (e.g., wind, wave, and tidal energy generators) along
the U.S. coast.


Proposal:

       1. Provide $15 million to finance $300 million of Title XI loan guarantees under
          chapter 537 of Title 46, United States Code, for construction of short sea ships in
          U.S. shipyards;

       2. Provide $15 million to finance $300 million of Title XI loan guarantees under
          chapter 537 of Title 46 for construction of shore-side terminals and the purchase
          of equipment necessary to accommodate short sea shipping; and

       3. Provide $15 million to finance $300 million of Title XI loan guarantees under
          chapter 537 of Title 46 for the ocean renewable energy program administered by
          the Maritime Administration.


Source: Appropriate funds from the General Fund.


Distribution: Distribute funds for loan guarantees through the Maritime Administration’s existing
administrative processes.


Prioritization: Prioritize funds on projects that are ready to go to construction and can be
underway within 90 days.


Economic Impact: The $900 million of Federal loan guarantees creates more than 25,000
jobs and $4.46 billion of economic activity.


Equal Opportunity: Maritime Administration contracts require contractors to maximize the use of
small and minority subcontractors.
Page 33


                                 MARITIME TRANSPORTATION
                          JOB CREATION AND TRAINING – $10 MILLION

Job Creation and Training Needs: The U.S. maritime industry is currently experiencing a
shortage of trained workers, particularly in the offshore energy and towing vessel industry. This
Maritime Administration program would fund educational loans for individuals seeking to attend
Coast Guard-approved maritime training courses (both entry-level courses and training to upgrade
licenses). Under the program, a student may receive up to $15,000 per year with a lifetime limit of
$60,000 in low-interest loans. Statutory authorization is required for this program.


Proposal: Provide $10 million to the Maritime Administration for a maritime educational
loan program. This funding will provide loans to more than 2,000 students for maritime education
and training programs.


Source: Appropriate funds from the General Fund.


Distribution: Distribute funds for educational loans through the Maritime Administration’s
administrative processes.


Equal Opportunity: These schools are prohibited from discriminating in their admission policies.
Page 34


           SAINT LAWRENCE SEAWAY DEVELOPMENT CORPORATION – $45 MILLION

Infrastructure Needs: Maritime commerce on the Great Lakes Seaway System affects 150,000
jobs and provides $9 million per day in business revenues for firms engaging in trade in the U.S.
Without renewed capital investment in the assets of the St. Lawrence Seaway, the reliability and
availability of the Seaway, and access to the communities and economies of the Great Lakes and
Midwestern regions, is in jeopardy.

The Saint Lawrence Seaway Development Corporation (“SLSDC”) has developed a ten-year U.S.
Asset Renewal Program (“ARP”) Capital Investment Plan (“CIP”) for navigation infrastructure and
facilities. The objectives of ARP/CIP include: lock operation upgrade and maintenance, waterway
management, tunnel and bridge maintenance and facility upgrade and maintenance. The ten-year
asset renewal program consists of 50 projects ranging in cost from $200,000 for upgrading and
replacing fire alarm protection systems, to $13.6 million for replacing the deck of the Seaway
International Bridge. The total cost of the ten-year asset renewal program is $164.6 million, which is
authorized pursuant to section 5015 of the Water Resources Development Act of 2007 (P.L. 110-
114).

Projects scheduled to begin in years 1 and 2 of ARP are currently ready for implementation and
construction. These projects include $5 million for installation of an ice flushing system in the Snell
Lock and $3 million for rehabilitation of downstream miter gates at both the Snell and Eisenhower
locks. In addition, other projects ready for implementation include $3 million for completion of the
deck replacement of the Seaway International Bridge. Work on these projects will be done by
contractors, by SLSDC staff, or by a combination of contractors and SLSDC staff.


Ready-to-Go Projects: Section 5015 of the Water Resources Development Act of 2007 authorizes
the SLSDC to undertake a ten-year asset renewal program. The SLSDC has identified $45 million in
projects that are ready to go to construction within the larger asset renewal program.


Proposal: Provide $45 million to begin the SLSDC’s ten-year asset renewal program.


Source: Appropriate funds from the Harbor Maintenance Trust Fund and the general fund of the
United States.


Distribution: Distribute funds pursuant to section 210 of the Water Resources Development Act
of 1986 (33 U.S.C. 2238)


Prioritization: Prioritize funds on projects that are ready to go to construction and can be
underway within 90 days.


Shovel-Ready Deadlines: Require SLSDC to award contracts for projects totaling at least
$11.25 million (25 percent) of these funds within 90 days of the date of enactment. Require
SLSDC to award contracts for projects totaling at least $22.5 million (50 percent) of these
funds within one year and award contracts for all of the funding within two years of the date
of enactment.


Economic Impact: Create approximately 1,250 jobs and $223 million of economic activity.
Table A

                  Results of December 2008
    AASHTO Survey of Ready-to-Go Highway & Bridge Projects

State                  Number of Projects   Dollar Value (in Millions)
Alabama                       16                      $877.0
Alaska                         4                      $139.3
Arizona                       72                     $1,091.5
Arkansas                      130                    $1,120.5
California                                           $5,000.0
Colorado                      113                    $1,154.0
Connecticut                    5                      $764.7
Delaware                                              $125.0
District of Columbia           3                       $56.0
Florida                       92                     $6,968.3
Georgia                       319                    $1,932.9
Hawaii                        51                      $417.9
Idaho                         126                     $805.0
Illinois                      245                     $783.3
Indiana                       109                     $501.2
Iowa                          41                      $221.2
Kansas                        107                     $357.0
Kentucky                      50                      $400.0
Louisiana                     58                      $423.0
Maine                         44                      $221.0
Maryland                                              $230.0
Massachusetts                 37                      $220.0
Michigan                      208                    $1,750.0
Minnesota                     200                     $950.0
Mississippi                   75                      $600.0
Missouri                      34                      $510.0
Montana                       158                     $350.0
Nebraska                      30                      $250.0
Nevada                        40                      $250.0
New Hampshire                 27                      $230.5
New Jersey                    153                    $1,640.0
New Mexico                    49                     $1,136.1
New York                      40                      $550.0
North Carolina                296                    $5,170.0
North Dakota                                          $300.0
Ohio                                                 $2,160.0
Oklahoma                      95                      $778.0
Oregon                        105                     $564.0
Pennsylvania                  319                    $1,030.0
Rhode Island                  40                      $100.0
South Carolina                51                      $850.0
South Dakota                  29                      $155.0
Tennessee                     120                     $400.0
Texas                         853                    $6,018.4
Utah                          136                   $10,800.0
Vermont                       22                       $94.7
Virginia                      40                      $680.4
Washington                    60                     $1,339.0
West Virginia                 181                    $1,134.4
Wisconsin                     60                      $320.0
Wyoming                       105                     $400.3
Total                                               $64,319.6
                             5,148
Infrastructure Investment Creates 2.4M Jobs

More Related Content

What's hot

Infrastracture Investment - 12th Plan (2012 - 2017)
Infrastracture Investment - 12th Plan (2012 - 2017)Infrastracture Investment - 12th Plan (2012 - 2017)
Infrastracture Investment - 12th Plan (2012 - 2017)NITI Aayog
 
24.03.2014, Public Private Partnership in Mongolia: Now and Future Prospects,...
24.03.2014, Public Private Partnership in Mongolia: Now and Future Prospects,...24.03.2014, Public Private Partnership in Mongolia: Now and Future Prospects,...
24.03.2014, Public Private Partnership in Mongolia: Now and Future Prospects,...The Business Council of Mongolia
 
Nj h2 dev_plan_041012
Nj h2 dev_plan_041012Nj h2 dev_plan_041012
Nj h2 dev_plan_041012Thomas Wolak
 
FY2014 Annual Plan Bronx Presentation (English)
FY2014 Annual Plan Bronx Presentation (English)FY2014 Annual Plan Bronx Presentation (English)
FY2014 Annual Plan Bronx Presentation (English)NYCHA Nyc-Housing
 
FY 2014 Annual Plan Brooklyn Presentation (Manhattan)
FY 2014 Annual Plan Brooklyn Presentation (Manhattan)FY 2014 Annual Plan Brooklyn Presentation (Manhattan)
FY 2014 Annual Plan Brooklyn Presentation (Manhattan)NYCHA Nyc-Housing
 
FY2014 Annual Plan Staten Island Presentation (English)
FY2014 Annual Plan Staten Island Presentation (English)FY2014 Annual Plan Staten Island Presentation (English)
FY2014 Annual Plan Staten Island Presentation (English)NYCHA Nyc-Housing
 
Vietnam - Wind Power - Moving towards completion - With the newly-proposed w...
 Vietnam - Wind Power - Moving towards completion - With the newly-proposed w... Vietnam - Wind Power - Moving towards completion - With the newly-proposed w...
Vietnam - Wind Power - Moving towards completion - With the newly-proposed w...Dr. Oliver Massmann
 
How JICA mobilizes private sector finance and investments for affordable and ...
How JICA mobilizes private sector finance and investments for affordable and ...How JICA mobilizes private sector finance and investments for affordable and ...
How JICA mobilizes private sector finance and investments for affordable and ...OECD Environment
 
20210101 sdg4 med action plan en
20210101 sdg4 med action plan en20210101 sdg4 med action plan en
20210101 sdg4 med action plan enMario Dogliani
 
Canada Mortgage and Housing Corporation's (CMHC) Municipal Infrastructure Len...
Canada Mortgage and Housing Corporation's (CMHC) Municipal Infrastructure Len...Canada Mortgage and Housing Corporation's (CMHC) Municipal Infrastructure Len...
Canada Mortgage and Housing Corporation's (CMHC) Municipal Infrastructure Len...MaRS Discovery District
 
Special Remarks Bokhwan Yu
Special Remarks Bokhwan YuSpecial Remarks Bokhwan Yu
Special Remarks Bokhwan YuOECD Environment
 
Transportation Management Conference: Critical Issues in Transportation
Transportation Management Conference: Critical Issues in TransportationTransportation Management Conference: Critical Issues in Transportation
Transportation Management Conference: Critical Issues in TransportationAASHTO
 
VIETNAM — MINING SECTOR — ON THE DOWN LOW — Lawyer in Vietnam Dr. Oliver Mas...
 VIETNAM — MINING SECTOR — ON THE DOWN LOW — Lawyer in Vietnam Dr. Oliver Mas... VIETNAM — MINING SECTOR — ON THE DOWN LOW — Lawyer in Vietnam Dr. Oliver Mas...
VIETNAM — MINING SECTOR — ON THE DOWN LOW — Lawyer in Vietnam Dr. Oliver Mas...Dr. Oliver Massmann
 
Financing the development of Lebanon's power sector
Financing the development of Lebanon's power sectorFinancing the development of Lebanon's power sector
Financing the development of Lebanon's power sectorJonas Feller
 
China Continues Investment in Middle East with Silk City in Kuwait
China Continues Investment in Middle East with Silk City in KuwaitChina Continues Investment in Middle East with Silk City in Kuwait
China Continues Investment in Middle East with Silk City in KuwaitDr. Ehsan Bayat
 
Renewable Energy Industry Review Allliedschools Jul09
Renewable Energy Industry Review Allliedschools Jul09Renewable Energy Industry Review Allliedschools Jul09
Renewable Energy Industry Review Allliedschools Jul09Allied Schools
 
Climate change and energy policy in the construction sector berlin-germany-...
Climate change and energy policy in the construction sector   berlin-germany-...Climate change and energy policy in the construction sector   berlin-germany-...
Climate change and energy policy in the construction sector berlin-germany-...Pierre Hnoud
 

What's hot (18)

Map 21 Outline
Map 21 OutlineMap 21 Outline
Map 21 Outline
 
Infrastracture Investment - 12th Plan (2012 - 2017)
Infrastracture Investment - 12th Plan (2012 - 2017)Infrastracture Investment - 12th Plan (2012 - 2017)
Infrastracture Investment - 12th Plan (2012 - 2017)
 
24.03.2014, Public Private Partnership in Mongolia: Now and Future Prospects,...
24.03.2014, Public Private Partnership in Mongolia: Now and Future Prospects,...24.03.2014, Public Private Partnership in Mongolia: Now and Future Prospects,...
24.03.2014, Public Private Partnership in Mongolia: Now and Future Prospects,...
 
Nj h2 dev_plan_041012
Nj h2 dev_plan_041012Nj h2 dev_plan_041012
Nj h2 dev_plan_041012
 
FY2014 Annual Plan Bronx Presentation (English)
FY2014 Annual Plan Bronx Presentation (English)FY2014 Annual Plan Bronx Presentation (English)
FY2014 Annual Plan Bronx Presentation (English)
 
FY 2014 Annual Plan Brooklyn Presentation (Manhattan)
FY 2014 Annual Plan Brooklyn Presentation (Manhattan)FY 2014 Annual Plan Brooklyn Presentation (Manhattan)
FY 2014 Annual Plan Brooklyn Presentation (Manhattan)
 
FY2014 Annual Plan Staten Island Presentation (English)
FY2014 Annual Plan Staten Island Presentation (English)FY2014 Annual Plan Staten Island Presentation (English)
FY2014 Annual Plan Staten Island Presentation (English)
 
Vietnam - Wind Power - Moving towards completion - With the newly-proposed w...
 Vietnam - Wind Power - Moving towards completion - With the newly-proposed w... Vietnam - Wind Power - Moving towards completion - With the newly-proposed w...
Vietnam - Wind Power - Moving towards completion - With the newly-proposed w...
 
How JICA mobilizes private sector finance and investments for affordable and ...
How JICA mobilizes private sector finance and investments for affordable and ...How JICA mobilizes private sector finance and investments for affordable and ...
How JICA mobilizes private sector finance and investments for affordable and ...
 
20210101 sdg4 med action plan en
20210101 sdg4 med action plan en20210101 sdg4 med action plan en
20210101 sdg4 med action plan en
 
Canada Mortgage and Housing Corporation's (CMHC) Municipal Infrastructure Len...
Canada Mortgage and Housing Corporation's (CMHC) Municipal Infrastructure Len...Canada Mortgage and Housing Corporation's (CMHC) Municipal Infrastructure Len...
Canada Mortgage and Housing Corporation's (CMHC) Municipal Infrastructure Len...
 
Special Remarks Bokhwan Yu
Special Remarks Bokhwan YuSpecial Remarks Bokhwan Yu
Special Remarks Bokhwan Yu
 
Transportation Management Conference: Critical Issues in Transportation
Transportation Management Conference: Critical Issues in TransportationTransportation Management Conference: Critical Issues in Transportation
Transportation Management Conference: Critical Issues in Transportation
 
VIETNAM — MINING SECTOR — ON THE DOWN LOW — Lawyer in Vietnam Dr. Oliver Mas...
 VIETNAM — MINING SECTOR — ON THE DOWN LOW — Lawyer in Vietnam Dr. Oliver Mas... VIETNAM — MINING SECTOR — ON THE DOWN LOW — Lawyer in Vietnam Dr. Oliver Mas...
VIETNAM — MINING SECTOR — ON THE DOWN LOW — Lawyer in Vietnam Dr. Oliver Mas...
 
Financing the development of Lebanon's power sector
Financing the development of Lebanon's power sectorFinancing the development of Lebanon's power sector
Financing the development of Lebanon's power sector
 
China Continues Investment in Middle East with Silk City in Kuwait
China Continues Investment in Middle East with Silk City in KuwaitChina Continues Investment in Middle East with Silk City in Kuwait
China Continues Investment in Middle East with Silk City in Kuwait
 
Renewable Energy Industry Review Allliedschools Jul09
Renewable Energy Industry Review Allliedschools Jul09Renewable Energy Industry Review Allliedschools Jul09
Renewable Energy Industry Review Allliedschools Jul09
 
Climate change and energy policy in the construction sector berlin-germany-...
Climate change and energy policy in the construction sector   berlin-germany-...Climate change and energy policy in the construction sector   berlin-germany-...
Climate change and energy policy in the construction sector berlin-germany-...
 

Viewers also liked (6)

Military Related Legislation Gen Assembly
Military Related Legislation Gen AssemblyMilitary Related Legislation Gen Assembly
Military Related Legislation Gen Assembly
 
Transportation Alternatives in Hampton Roads (Dec08)
Transportation Alternatives in Hampton Roads (Dec08)Transportation Alternatives in Hampton Roads (Dec08)
Transportation Alternatives in Hampton Roads (Dec08)
 
America's First Region Recognition
America's First Region RecognitionAmerica's First Region Recognition
America's First Region Recognition
 
HRMPO Retreat 11 Feb 09
HRMPO Retreat 11 Feb 09HRMPO Retreat 11 Feb 09
HRMPO Retreat 11 Feb 09
 
NETS PowerPoint
NETS PowerPointNETS PowerPoint
NETS PowerPoint
 
pato donald
pato donaldpato donald
pato donald
 

Similar to Infrastructure Investment Creates 2.4M Jobs

The Infrastructure Investment and Jobs Act (IIJA)
The Infrastructure Investment and Jobs Act (IIJA)The Infrastructure Investment and Jobs Act (IIJA)
The Infrastructure Investment and Jobs Act (IIJA)nado-web
 
IIRSA-Building-A-New-Continent-Project-Information-Sheets-Priority-Investment...
IIRSA-Building-A-New-Continent-Project-Information-Sheets-Priority-Investment...IIRSA-Building-A-New-Continent-Project-Information-Sheets-Priority-Investment...
IIRSA-Building-A-New-Continent-Project-Information-Sheets-Priority-Investment...hamzachennouf3
 
Roadways_and_Bridges
Roadways_and_BridgesRoadways_and_Bridges
Roadways_and_BridgesAbby Davidson
 
Analyst breakfast: North American consultancy business - 19 March 2015
Analyst breakfast: North American consultancy business - 19 March 2015Analyst breakfast: North American consultancy business - 19 March 2015
Analyst breakfast: North American consultancy business - 19 March 2015Atkins
 
Department of Transportation Fiscal Year 2012 Budget Highlights
Department of Transportation Fiscal Year 2012 Budget HighlightsDepartment of Transportation Fiscal Year 2012 Budget Highlights
Department of Transportation Fiscal Year 2012 Budget HighlightsPorts-To-Plains Blog
 
Tiger 2013 Awards
Tiger 2013 AwardsTiger 2013 Awards
Tiger 2013 AwardsRoar Media
 
Mexico Group April 2014 with NADBank
Mexico Group April 2014 with NADBank Mexico Group April 2014 with NADBank
Mexico Group April 2014 with NADBank ftaedu
 
Aging infrastructure replacement
Aging infrastructure replacementAging infrastructure replacement
Aging infrastructure replacementBigT
 
Info Sheet - About Site C - January 2016_1
Info Sheet - About Site C - January 2016_1Info Sheet - About Site C - January 2016_1
Info Sheet - About Site C - January 2016_1Shawn Behnam PhD P.Eng
 
Public Private Partnerships - State of the Market and the Future of P3's
Public Private Partnerships - State of the Market and the Future of P3'sPublic Private Partnerships - State of the Market and the Future of P3's
Public Private Partnerships - State of the Market and the Future of P3'sJonathan Hunt
 
Public Private Partnerships (P3) - Kome Ajese AGC 01.2011 Presentation
Public Private Partnerships (P3) - Kome Ajese AGC 01.2011 PresentationPublic Private Partnerships (P3) - Kome Ajese AGC 01.2011 Presentation
Public Private Partnerships (P3) - Kome Ajese AGC 01.2011 PresentationAGC of California
 
Artba Senate Summary
Artba Senate SummaryArtba Senate Summary
Artba Senate Summaryartba
 
Eric. E. Cavazza P.E., Director PA DEP Bureau of Abandoned Mine Reclamation -...
Eric. E. Cavazza P.E., Director PA DEP Bureau of Abandoned Mine Reclamation -...Eric. E. Cavazza P.E., Director PA DEP Bureau of Abandoned Mine Reclamation -...
Eric. E. Cavazza P.E., Director PA DEP Bureau of Abandoned Mine Reclamation -...Michael Hewitt, GISP
 
Hr 3684 infrastructure_investment_and_jobs_act_summary
Hr 3684 infrastructure_investment_and_jobs_act_summaryHr 3684 infrastructure_investment_and_jobs_act_summary
Hr 3684 infrastructure_investment_and_jobs_act_summaryGabriel Putnam
 
Florida International University .docx
Florida International University                              .docxFlorida International University                              .docx
Florida International University .docxAKHIL969626
 
P3 presentation - CCA.PPTX
P3 presentation - CCA.PPTXP3 presentation - CCA.PPTX
P3 presentation - CCA.PPTXMatt Meaker
 
Rebuilding America’s Infrastructure The Road Ahead for Transportation Enginee...
Rebuilding America’s Infrastructure The Road Ahead for Transportation Enginee...Rebuilding America’s Infrastructure The Road Ahead for Transportation Enginee...
Rebuilding America’s Infrastructure The Road Ahead for Transportation Enginee...online Marketing
 

Similar to Infrastructure Investment Creates 2.4M Jobs (20)

The Infrastructure Investment and Jobs Act (IIJA)
The Infrastructure Investment and Jobs Act (IIJA)The Infrastructure Investment and Jobs Act (IIJA)
The Infrastructure Investment and Jobs Act (IIJA)
 
IIRSA-Building-A-New-Continent-Project-Information-Sheets-Priority-Investment...
IIRSA-Building-A-New-Continent-Project-Information-Sheets-Priority-Investment...IIRSA-Building-A-New-Continent-Project-Information-Sheets-Priority-Investment...
IIRSA-Building-A-New-Continent-Project-Information-Sheets-Priority-Investment...
 
GlobInfrastructure
GlobInfrastructureGlobInfrastructure
GlobInfrastructure
 
Roadways_and_Bridges
Roadways_and_BridgesRoadways_and_Bridges
Roadways_and_Bridges
 
Analyst breakfast: North American consultancy business - 19 March 2015
Analyst breakfast: North American consultancy business - 19 March 2015Analyst breakfast: North American consultancy business - 19 March 2015
Analyst breakfast: North American consultancy business - 19 March 2015
 
Department of Transportation Fiscal Year 2012 Budget Highlights
Department of Transportation Fiscal Year 2012 Budget HighlightsDepartment of Transportation Fiscal Year 2012 Budget Highlights
Department of Transportation Fiscal Year 2012 Budget Highlights
 
Tiger 2013 Awards
Tiger 2013 AwardsTiger 2013 Awards
Tiger 2013 Awards
 
Mexico Group April 2014 with NADBank
Mexico Group April 2014 with NADBank Mexico Group April 2014 with NADBank
Mexico Group April 2014 with NADBank
 
Aging infrastructure replacement
Aging infrastructure replacementAging infrastructure replacement
Aging infrastructure replacement
 
Info Sheet - About Site C - January 2016_1
Info Sheet - About Site C - January 2016_1Info Sheet - About Site C - January 2016_1
Info Sheet - About Site C - January 2016_1
 
Public Private Partnerships - State of the Market and the Future of P3's
Public Private Partnerships - State of the Market and the Future of P3'sPublic Private Partnerships - State of the Market and the Future of P3's
Public Private Partnerships - State of the Market and the Future of P3's
 
Public Private Partnerships (P3) - Kome Ajese AGC 01.2011 Presentation
Public Private Partnerships (P3) - Kome Ajese AGC 01.2011 PresentationPublic Private Partnerships (P3) - Kome Ajese AGC 01.2011 Presentation
Public Private Partnerships (P3) - Kome Ajese AGC 01.2011 Presentation
 
Artba Senate Summary
Artba Senate SummaryArtba Senate Summary
Artba Senate Summary
 
Eric. E. Cavazza P.E., Director PA DEP Bureau of Abandoned Mine Reclamation -...
Eric. E. Cavazza P.E., Director PA DEP Bureau of Abandoned Mine Reclamation -...Eric. E. Cavazza P.E., Director PA DEP Bureau of Abandoned Mine Reclamation -...
Eric. E. Cavazza P.E., Director PA DEP Bureau of Abandoned Mine Reclamation -...
 
07 steve healow
07 steve healow07 steve healow
07 steve healow
 
Hr 3684 infrastructure_investment_and_jobs_act_summary
Hr 3684 infrastructure_investment_and_jobs_act_summaryHr 3684 infrastructure_investment_and_jobs_act_summary
Hr 3684 infrastructure_investment_and_jobs_act_summary
 
Florida International University .docx
Florida International University                              .docxFlorida International University                              .docx
Florida International University .docx
 
P3 presentation - CCA.PPTX
P3 presentation - CCA.PPTXP3 presentation - CCA.PPTX
P3 presentation - CCA.PPTX
 
Rebuilding America’s Infrastructure The Road Ahead for Transportation Enginee...
Rebuilding America’s Infrastructure The Road Ahead for Transportation Enginee...Rebuilding America’s Infrastructure The Road Ahead for Transportation Enginee...
Rebuilding America’s Infrastructure The Road Ahead for Transportation Enginee...
 
Breviary Photographic Projects
Breviary Photographic ProjectsBreviary Photographic Projects
Breviary Photographic Projects
 

More from Hampton Roads: America's First Region

Virginia's Hampton Roads: Strategic position in the vision for High-Speed Ra...
Virginia's Hampton Roads:  Strategic position in the vision for High-Speed Ra...Virginia's Hampton Roads:  Strategic position in the vision for High-Speed Ra...
Virginia's Hampton Roads: Strategic position in the vision for High-Speed Ra...Hampton Roads: America's First Region
 

More from Hampton Roads: America's First Region (20)

Imagine Hampton Roads
Imagine Hampton RoadsImagine Hampton Roads
Imagine Hampton Roads
 
Passenger Trains For Va Peninsula Csx 7 17 09
Passenger Trains For Va Peninsula Csx 7 17 09Passenger Trains For Va Peninsula Csx 7 17 09
Passenger Trains For Va Peninsula Csx 7 17 09
 
Passenger Trains For South Hampton Roads Norfolk Southern 7 17 09
Passenger Trains For South Hampton Roads Norfolk Southern 7 17 09Passenger Trains For South Hampton Roads Norfolk Southern 7 17 09
Passenger Trains For South Hampton Roads Norfolk Southern 7 17 09
 
Virginians for High Speed Rail, July 2009
Virginians for High Speed Rail, July 2009Virginians for High Speed Rail, July 2009
Virginians for High Speed Rail, July 2009
 
Hampton Roads, Part B
Hampton Roads, Part BHampton Roads, Part B
Hampton Roads, Part B
 
Hampton Roads, Part A
Hampton Roads, Part AHampton Roads, Part A
Hampton Roads, Part A
 
Leading Transformation with Modeling & Simulation
Leading Transformation with Modeling & SimulationLeading Transformation with Modeling & Simulation
Leading Transformation with Modeling & Simulation
 
Virginia's Hampton Roads: Strategic position in the vision for High-Speed Ra...
Virginia's Hampton Roads:  Strategic position in the vision for High-Speed Ra...Virginia's Hampton Roads:  Strategic position in the vision for High-Speed Ra...
Virginia's Hampton Roads: Strategic position in the vision for High-Speed Ra...
 
U.S. Department of Energy’s 20% Wind Energy by 2030, 2008
U.S. Department of Energy’s 20% Wind Energy by 2030, 2008U.S. Department of Energy’s 20% Wind Energy by 2030, 2008
U.S. Department of Energy’s 20% Wind Energy by 2030, 2008
 
Natural Gas Current Capabilities and Future Needs
Natural Gas Current Capabilities and Future NeedsNatural Gas Current Capabilities and Future Needs
Natural Gas Current Capabilities and Future Needs
 
NERC 2008 Long-Term Reliability Assessment
NERC 2008 Long-Term Reliability AssessmentNERC 2008 Long-Term Reliability Assessment
NERC 2008 Long-Term Reliability Assessment
 
Dominion Power: New Directions in Energy
Dominion Power:  New Directions in EnergyDominion Power:  New Directions in Energy
Dominion Power: New Directions in Energy
 
Hampton Roads Military and Federal Facilities
Hampton Roads Military and Federal FacilitiesHampton Roads Military and Federal Facilities
Hampton Roads Military and Federal Facilities
 
Harnessing the Power of the Arts
Harnessing the Power of the ArtsHarnessing the Power of the Arts
Harnessing the Power of the Arts
 
Tidewater Teacher May-June 2009
Tidewater Teacher May-June 2009Tidewater Teacher May-June 2009
Tidewater Teacher May-June 2009
 
The TIDE, Hampton Roads Light Rail begins
The TIDE, Hampton Roads Light Rail beginsThe TIDE, Hampton Roads Light Rail begins
The TIDE, Hampton Roads Light Rail begins
 
Economic Interdependence Table (Jan09)
Economic Interdependence Table (Jan09)Economic Interdependence Table (Jan09)
Economic Interdependence Table (Jan09)
 
Economic Assessment of Impact of Jobs in Hampton Roads (2009)
Economic Assessment of Impact of Jobs in Hampton Roads (2009)Economic Assessment of Impact of Jobs in Hampton Roads (2009)
Economic Assessment of Impact of Jobs in Hampton Roads (2009)
 
Regional Cooperation to End Homelessness
Regional Cooperation to End HomelessnessRegional Cooperation to End Homelessness
Regional Cooperation to End Homelessness
 
Comprehensive Economic Development Strategies (CEDS)
Comprehensive Economic Development Strategies (CEDS)Comprehensive Economic Development Strategies (CEDS)
Comprehensive Economic Development Strategies (CEDS)
 

Recently uploaded

Understanding Discord NSFW Servers A Guide for Responsible Users.pdf
Understanding Discord NSFW Servers A Guide for Responsible Users.pdfUnderstanding Discord NSFW Servers A Guide for Responsible Users.pdf
Understanding Discord NSFW Servers A Guide for Responsible Users.pdfUK Journal
 
🐬 The future of MySQL is Postgres 🐘
🐬  The future of MySQL is Postgres   🐘🐬  The future of MySQL is Postgres   🐘
🐬 The future of MySQL is Postgres 🐘RTylerCroy
 
What Are The Drone Anti-jamming Systems Technology?
What Are The Drone Anti-jamming Systems Technology?What Are The Drone Anti-jamming Systems Technology?
What Are The Drone Anti-jamming Systems Technology?Antenna Manufacturer Coco
 
Automating Google Workspace (GWS) & more with Apps Script
Automating Google Workspace (GWS) & more with Apps ScriptAutomating Google Workspace (GWS) & more with Apps Script
Automating Google Workspace (GWS) & more with Apps Scriptwesley chun
 
Axa Assurance Maroc - Insurer Innovation Award 2024
Axa Assurance Maroc - Insurer Innovation Award 2024Axa Assurance Maroc - Insurer Innovation Award 2024
Axa Assurance Maroc - Insurer Innovation Award 2024The Digital Insurer
 
Factors to Consider When Choosing Accounts Payable Services Providers.pptx
Factors to Consider When Choosing Accounts Payable Services Providers.pptxFactors to Consider When Choosing Accounts Payable Services Providers.pptx
Factors to Consider When Choosing Accounts Payable Services Providers.pptxKatpro Technologies
 
Bajaj Allianz Life Insurance Company - Insurer Innovation Award 2024
Bajaj Allianz Life Insurance Company - Insurer Innovation Award 2024Bajaj Allianz Life Insurance Company - Insurer Innovation Award 2024
Bajaj Allianz Life Insurance Company - Insurer Innovation Award 2024The Digital Insurer
 
Breaking the Kubernetes Kill Chain: Host Path Mount
Breaking the Kubernetes Kill Chain: Host Path MountBreaking the Kubernetes Kill Chain: Host Path Mount
Breaking the Kubernetes Kill Chain: Host Path MountPuma Security, LLC
 
08448380779 Call Girls In Greater Kailash - I Women Seeking Men
08448380779 Call Girls In Greater Kailash - I Women Seeking Men08448380779 Call Girls In Greater Kailash - I Women Seeking Men
08448380779 Call Girls In Greater Kailash - I Women Seeking MenDelhi Call girls
 
IAC 2024 - IA Fast Track to Search Focused AI Solutions
IAC 2024 - IA Fast Track to Search Focused AI SolutionsIAC 2024 - IA Fast Track to Search Focused AI Solutions
IAC 2024 - IA Fast Track to Search Focused AI SolutionsEnterprise Knowledge
 
Tata AIG General Insurance Company - Insurer Innovation Award 2024
Tata AIG General Insurance Company - Insurer Innovation Award 2024Tata AIG General Insurance Company - Insurer Innovation Award 2024
Tata AIG General Insurance Company - Insurer Innovation Award 2024The Digital Insurer
 
How to Troubleshoot Apps for the Modern Connected Worker
How to Troubleshoot Apps for the Modern Connected WorkerHow to Troubleshoot Apps for the Modern Connected Worker
How to Troubleshoot Apps for the Modern Connected WorkerThousandEyes
 
The 7 Things I Know About Cyber Security After 25 Years | April 2024
The 7 Things I Know About Cyber Security After 25 Years | April 2024The 7 Things I Know About Cyber Security After 25 Years | April 2024
The 7 Things I Know About Cyber Security After 25 Years | April 2024Rafal Los
 
Apidays Singapore 2024 - Building Digital Trust in a Digital Economy by Veron...
Apidays Singapore 2024 - Building Digital Trust in a Digital Economy by Veron...Apidays Singapore 2024 - Building Digital Trust in a Digital Economy by Veron...
Apidays Singapore 2024 - Building Digital Trust in a Digital Economy by Veron...apidays
 
Data Cloud, More than a CDP by Matt Robison
Data Cloud, More than a CDP by Matt RobisonData Cloud, More than a CDP by Matt Robison
Data Cloud, More than a CDP by Matt RobisonAnna Loughnan Colquhoun
 
Advantages of Hiring UIUX Design Service Providers for Your Business
Advantages of Hiring UIUX Design Service Providers for Your BusinessAdvantages of Hiring UIUX Design Service Providers for Your Business
Advantages of Hiring UIUX Design Service Providers for Your BusinessPixlogix Infotech
 
Histor y of HAM Radio presentation slide
Histor y of HAM Radio presentation slideHistor y of HAM Radio presentation slide
Histor y of HAM Radio presentation slidevu2urc
 
Exploring the Future Potential of AI-Enabled Smartphone Processors
Exploring the Future Potential of AI-Enabled Smartphone ProcessorsExploring the Future Potential of AI-Enabled Smartphone Processors
Exploring the Future Potential of AI-Enabled Smartphone Processorsdebabhi2
 
Driving Behavioral Change for Information Management through Data-Driven Gree...
Driving Behavioral Change for Information Management through Data-Driven Gree...Driving Behavioral Change for Information Management through Data-Driven Gree...
Driving Behavioral Change for Information Management through Data-Driven Gree...Enterprise Knowledge
 
TrustArc Webinar - Stay Ahead of US State Data Privacy Law Developments
TrustArc Webinar - Stay Ahead of US State Data Privacy Law DevelopmentsTrustArc Webinar - Stay Ahead of US State Data Privacy Law Developments
TrustArc Webinar - Stay Ahead of US State Data Privacy Law DevelopmentsTrustArc
 

Recently uploaded (20)

Understanding Discord NSFW Servers A Guide for Responsible Users.pdf
Understanding Discord NSFW Servers A Guide for Responsible Users.pdfUnderstanding Discord NSFW Servers A Guide for Responsible Users.pdf
Understanding Discord NSFW Servers A Guide for Responsible Users.pdf
 
🐬 The future of MySQL is Postgres 🐘
🐬  The future of MySQL is Postgres   🐘🐬  The future of MySQL is Postgres   🐘
🐬 The future of MySQL is Postgres 🐘
 
What Are The Drone Anti-jamming Systems Technology?
What Are The Drone Anti-jamming Systems Technology?What Are The Drone Anti-jamming Systems Technology?
What Are The Drone Anti-jamming Systems Technology?
 
Automating Google Workspace (GWS) & more with Apps Script
Automating Google Workspace (GWS) & more with Apps ScriptAutomating Google Workspace (GWS) & more with Apps Script
Automating Google Workspace (GWS) & more with Apps Script
 
Axa Assurance Maroc - Insurer Innovation Award 2024
Axa Assurance Maroc - Insurer Innovation Award 2024Axa Assurance Maroc - Insurer Innovation Award 2024
Axa Assurance Maroc - Insurer Innovation Award 2024
 
Factors to Consider When Choosing Accounts Payable Services Providers.pptx
Factors to Consider When Choosing Accounts Payable Services Providers.pptxFactors to Consider When Choosing Accounts Payable Services Providers.pptx
Factors to Consider When Choosing Accounts Payable Services Providers.pptx
 
Bajaj Allianz Life Insurance Company - Insurer Innovation Award 2024
Bajaj Allianz Life Insurance Company - Insurer Innovation Award 2024Bajaj Allianz Life Insurance Company - Insurer Innovation Award 2024
Bajaj Allianz Life Insurance Company - Insurer Innovation Award 2024
 
Breaking the Kubernetes Kill Chain: Host Path Mount
Breaking the Kubernetes Kill Chain: Host Path MountBreaking the Kubernetes Kill Chain: Host Path Mount
Breaking the Kubernetes Kill Chain: Host Path Mount
 
08448380779 Call Girls In Greater Kailash - I Women Seeking Men
08448380779 Call Girls In Greater Kailash - I Women Seeking Men08448380779 Call Girls In Greater Kailash - I Women Seeking Men
08448380779 Call Girls In Greater Kailash - I Women Seeking Men
 
IAC 2024 - IA Fast Track to Search Focused AI Solutions
IAC 2024 - IA Fast Track to Search Focused AI SolutionsIAC 2024 - IA Fast Track to Search Focused AI Solutions
IAC 2024 - IA Fast Track to Search Focused AI Solutions
 
Tata AIG General Insurance Company - Insurer Innovation Award 2024
Tata AIG General Insurance Company - Insurer Innovation Award 2024Tata AIG General Insurance Company - Insurer Innovation Award 2024
Tata AIG General Insurance Company - Insurer Innovation Award 2024
 
How to Troubleshoot Apps for the Modern Connected Worker
How to Troubleshoot Apps for the Modern Connected WorkerHow to Troubleshoot Apps for the Modern Connected Worker
How to Troubleshoot Apps for the Modern Connected Worker
 
The 7 Things I Know About Cyber Security After 25 Years | April 2024
The 7 Things I Know About Cyber Security After 25 Years | April 2024The 7 Things I Know About Cyber Security After 25 Years | April 2024
The 7 Things I Know About Cyber Security After 25 Years | April 2024
 
Apidays Singapore 2024 - Building Digital Trust in a Digital Economy by Veron...
Apidays Singapore 2024 - Building Digital Trust in a Digital Economy by Veron...Apidays Singapore 2024 - Building Digital Trust in a Digital Economy by Veron...
Apidays Singapore 2024 - Building Digital Trust in a Digital Economy by Veron...
 
Data Cloud, More than a CDP by Matt Robison
Data Cloud, More than a CDP by Matt RobisonData Cloud, More than a CDP by Matt Robison
Data Cloud, More than a CDP by Matt Robison
 
Advantages of Hiring UIUX Design Service Providers for Your Business
Advantages of Hiring UIUX Design Service Providers for Your BusinessAdvantages of Hiring UIUX Design Service Providers for Your Business
Advantages of Hiring UIUX Design Service Providers for Your Business
 
Histor y of HAM Radio presentation slide
Histor y of HAM Radio presentation slideHistor y of HAM Radio presentation slide
Histor y of HAM Radio presentation slide
 
Exploring the Future Potential of AI-Enabled Smartphone Processors
Exploring the Future Potential of AI-Enabled Smartphone ProcessorsExploring the Future Potential of AI-Enabled Smartphone Processors
Exploring the Future Potential of AI-Enabled Smartphone Processors
 
Driving Behavioral Change for Information Management through Data-Driven Gree...
Driving Behavioral Change for Information Management through Data-Driven Gree...Driving Behavioral Change for Information Management through Data-Driven Gree...
Driving Behavioral Change for Information Management through Data-Driven Gree...
 
TrustArc Webinar - Stay Ahead of US State Data Privacy Law Developments
TrustArc Webinar - Stay Ahead of US State Data Privacy Law DevelopmentsTrustArc Webinar - Stay Ahead of US State Data Privacy Law Developments
TrustArc Webinar - Stay Ahead of US State Data Privacy Law Developments
 

Infrastructure Investment Creates 2.4M Jobs

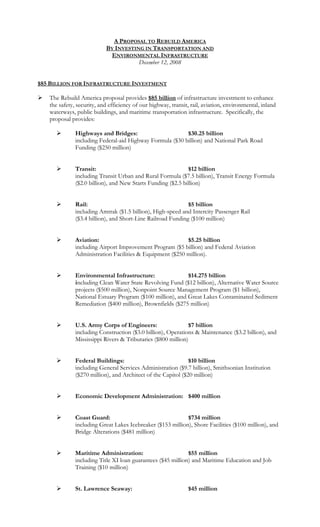
  • 1. A PROPOSAL TO REBUILD AMERICA BY INVESTING IN TRANSPORTATION AND ENVIRONMENTAL INFRASTRUCTURE December 12, 2008 $85 BILLION FOR INFRASTRUCTURE INVESTMENT  The Rebuild America proposal provides $85 billion of infrastructure investment to enhance the safety, security, and efficiency of our highway, transit, rail, aviation, environmental, inland waterways, public buildings, and maritime transportation infrastructure. Specifically, the proposal provides:  Highways and Bridges: $30.25 billion including Federal-aid Highway Formula ($30 billion) and National Park Road Funding ($250 million)  Transit: $12 billion including Transit Urban and Rural Formula ($7.5 billion), Transit Energy Formula ($2.0 billion), and New Starts Funding ($2.5 billion)  Rail: $5 billion including Amtrak ($1.5 billion), High-speed and Intercity Passenger Rail ($3.4 billion), and Short-Line Railroad Funding ($100 million)  Aviation: $5.25 billion including Airport Improvement Program ($5 billion) and Federal Aviation Administration Facilities & Equipment ($250 million).  Environmental Infrastructure: $14.275 billion including Clean Water State Revolving Fund ($12 billion), Alternative Water Source projects ($500 million), Nonpoint Source Management Program ($1 billion), National Estuary Program ($100 million), and Great Lakes Contaminated Sediment Remediation ($400 million), Brownfields ($275 million)  U.S. Army Corps of Engineers: $7 billion including Construction ($3.0 billion), Operations & Maintenance ($3.2 billion), and Mississippi Rivers & Tributaries ($800 million)  Federal Buildings: $10 billion including General Services Administration ($9.7 billion), Smithsonian Institution ($270 million), and Architect of the Capitol ($20 million)  Economic Development Administration: $400 million  Coast Guard: $734 million including Great Lakes Icebreaker ($153 million), Shore Facilities ($100 million), and Bridge Alterations ($481 million)  Maritime Administration: $55 million including Title XI loan guarantees ($45 million) and Maritime Education and Job Training ($10 million)  St. Lawrence Seaway: $45 million
  • 2. Page 2  The proposal requires these funds to be invested in ready-to-go projects. Priority shall be given to projects that can award contracts within 90 days of enactment.  The proposal creates green collar jobs and invests in projects that decrease our dependence on foreign oil and address global climate change. For Federal building renovation funds, priority shall be given to projects that include energy and water conservation elements, including installing photovoltaic roofs and geothermal technology. In addition, the proposal provides significant investment in public transit, Amtrak, and intercity and high-speed rail projects to provide alternatives to traveling by car, and assist transit and rail providers in converting to alternative fuel vehicles.  The proposal requires the steel, iron, and manufactured goods for these projects to be manufactured in the United States.  The proposal requires States, cities, public transit agencies, and other recipients of formula funds to certify State and local maintenance of effort and equitable distribution of funding to ensure that States, cities, public transit agencies, and other recipients continue their current investment levels and distribute funds equitably throughout the State and metropolitan areas. Recipients must submit a plan of projects for projects to be awarded contracts within 90 days, one year, and two years.  Finally, the proposal ensures transparency and accountability by including regular reporting requirements to track the use of the funds, State investments, and the estimated number of jobs created or sustained. The Federal agencies administering these funds will provide periodic reports to Congress and the Economic Recovery Advisory Board (announced by President-elect Obama on November 26, 2008) on the amount of Federal funds apportioned, obligated, and outlayed; the status of bids, contracts, and construction; and the number of jobs created or sustained with the Federal investments. The report will also track State investment levels to ensure state maintenance of effort. The proposal requires six periodic reports: 30 days, 60 days, 120 days, 180 days, one year, and three years after the date of enactment. READY-TO-GO INFRASTRUCTURE INVESTMENTS  While certain infrastructure projects may require years of engineering and environmental analysis, followed by a lengthy contract award process, a subset of projects – such as projects involving rehabilitation and repair of existing infrastructure – can move much more quickly, with work beginning within 90 days. 1  The proposal requires Rebuild America funds to be invested in ready-to-go projects. Priority will be given to projects that can award bids within 90 days. For instance, State Departments of Transportation (“DOTs”) have a tremendous backlog of highway resurfacing needs. State DOTs often have open-ended contracts in place for resurfacing projects, which means that work could begin immediately upon receipt of additional funds. Similarly, many State DOTs have bridge deck overlay projects, in which the top two or three inches of concrete on the surface of the bridge (e.g., the deck) is replaced, which are ready-to-go.  Within seven days of the date of enactment, the U.S. Department of Transportation and Environmental Protection Agency will distribute formula funds to States, cities, and public transit agencies. State DOTs can immediately put out bids (typically for a period of 30 days) for ready-to-go projects. After receipt of the bids and contract award, work can begin on the project within an additional 30 days. In this way, the Rebuild America proposal can “put shovels in the ground” within 90 days of enactment. The Federal Highway Administration’s “August redistribution” of highway funds illustrates the ability of States to 1 obligate additional funds quickly when they become available. In August of each year, States that cannot use their entire obligation authority return the unused authority to the Federal Highway Administration, which then redistributes it to States that can use the funds prior to the end of the fiscal year on September 30.
  • 3. Page 3 ECONOMIC IMPACT: MORE THAN 2.4 MILLION JOBS AND $439 BILLION OF ECONOMIC ACTIVITY  The proposed $85 billion of Federal infrastructure investment will create or sustain more than 2.4 million jobs and $439 billion of economic activity. Each $1 billion of Federal funds invested in infrastructure creates or sustains approximately 34,779 jobs and $6.2 billion in economic activity. 2  A national survey found that transportation construction contractors hire employees within three weeks of obtaining a project contract. These employees begin receiving paychecks within two weeks of hiring.  In addition, this infrastructure investment will increase business productivity by reducing the costs of producing goods in virtually all industrial sectors of the economy. Increased productivity results in increased demand for labor, capital, and raw materials and generally leads to lower product prices and increased sales.  The proposed investment will specifically help unemployed construction workers. The construction sector lost 261,000 jobs in 2007, and has lost an additional 513,000 jobs during the first 11 months of 2008 (through November). The unemployment rate in construction was 12.7 percent in November 2008 – up 6.5 points since November 2007. This is the highest unemployment rate of any industrial sector. As of November 2008, there are 1,237,000 unemployed construction workers in the nation – that’s 592,000 more unemployed construction workers than in November 2007. Within the overall construction sector, heavy and civil engineering construction employment is now the lowest it has been since February 2005.  In contrast to the economic stimulus effect from tax cuts, virtually all of the stimulus effect from public infrastructure investment will be felt in the United States. Not only would the construction work be done here, but most transportation construction materials and equipment are manufactured in the United States, as well. 3 MINORITY-OWNED AND WOMEN-OWNED BUSINESS IMPACT:  This investment will also help address the disproportionate effect that the increase in unemployment has had on people of color. In November 2008, the rate of unemployment for African Americans was 11.2 percent – nearly twice the rate for whites. The unemployment rate for Hispanic or Latino Americans was 8.5 percent, 47 percent more than the rate for whites.  Under existing highway, transit, and other infrastructure laws, as a general rule, States, cities, and infrastructure financing authorities are required to provide at least 10 percent of the amounts made available to Disadvantaged Business Enterprises (“DBEs”), including minority- and women-owned businesses. These estimates are based on 2007 Federal Highway Administration data on the correlation between highway 2 infrastructure investment and employment and economic activity, and assume a 20 percent state or local matching share of project costs. Some infrastructure programs have slightly higher or lower estimates of the number of jobs created or the economic activity generated per $1 billion of Federal funds invested. To enable easy comparisons among the elements of the bill, this document presumes the FHWA model for employment and economic activity. In most cases, the requirement for State or local matching funds would be waived under this proposal. Where appropriate, estimates of employment and economic activity have been adjusted to reflect these match waivers. 3 Previous experience with using public infrastructure investment to stimulate the economy can be found with the Public Works Acceleration Act (P.L. 87-658), signed by President Kennedy on September 14, 1962. Under this program, a total investment of $1.8 billion ($880 million Federal investment and $920 million in local investment) generated 250,000 job-years.
  • 4. Page 4 HIGHWAYS AND BRIDGES – $30.25 BILLION Infrastructure Needs: The cost of traffic congestion in our cities nationwide is a staggering $78 billion annually in wasted time (4.2 billion hours of delay) and fuel (2.9 billion gallons of excess fuel). Data contained in the Department of Transportation’s 2006 Conditions and Performance Report indicate that a total investment of $78.8 billion (in constant 2004 dollars) is needed annually to maintain our highway and bridges in their current condition. To improve the overall condition of highways and bridges, a combined investment of $131.7 billion (in constant 2004 dollars) is needed each year. According to the Department of Transportation (“DOT”), the annual investment gap is $8.5 billion to maintain our current systems and $61.4 billion to begin to improve highway and bridges. 4 According to the U.S. Department of Transportation:  Only 42.2 percent of travel on roads for which data are available occurred on pavements with “good” ride quality; and  25.4 percent of highway bridges are structurally deficient (12.1 percent) or functionally obsolete (13.3 percent). Ready-to-Go Projects: States and cities have many projects that are ready-to-go to construction within 90 days if additional funding is made available. A December 2008 survey of State Departments of Transportation by the American Association of State Highway and Transportation Officials (“AASHTO”) identified 5,148 highway and bridge projects at a total cost of $64.3 billion that are ready to go to construction within 180 days. See attached Table A. Similarly, a December 2008 survey of 427 cities by the U.S. Conference of Mayors identified 2,403 road and street projects at a total cost of $17.4 billion that are ready to go to construction in 2009. 5 While major highway construction projects take time to plan and design and thus are not good candidates for an economic stimulus package, every State DOT has a number of highway resurfacing and minor reconstruction projects in the pipeline that could be brought to construction with short notice. There is a pent-up demand for, and capacity to supply, these projects. Highway resurfacing work has been in decline because of the increasing cost of materials, labor, and equipment, coupled with the fixed budgets of state and local transportation agencies. According to the National Asphalt Pavement Association, the production of hot-mix asphalt declined 9.5 percent nationally from 2006 to 2007. At this time, the production of hot-mix asphalt is expected to decline about another 20 percent nationally in 2008. In addition, the National Park Service has identified 18 transportation projects in 15 States and the District of Columbia that are ready to go, but unfunded. These projects have obtained environmental clearance and can be underway within 180 days. Proposal: 1. Provide an additional $30.0 billion in funding for Federal-Aid Highway formula investments. 2. Provide an additional $250 million in funding for National Park Roads. Source: Appropriate funds from the General Fund. Distribution: Distribute Federal-Aid Highway funds to States and cities pursuant to existing statutory highway formula under the Safe, Accountable, Flexible, Efficient Transportation Equity Act: A Legacy for Users (“SAFETEA-LU”). A percentage of these funds would be suballocated to large metropolitan areas. Distribute National Park Road funds pursuant to existing Federal Highway Administration administrative process. According to DOT's 2006 Conditions and Performance Report, Federal, State, and local capital expenditure for 4 highways and bridges totaled $70.3 billion in 2004. This is $8.5 billion less than the annual expenditure needed to maintain highways and bridges, and $61.4 billion less than the annual expenditure needed to improve highways and bridges. 5 MainStreet Economic Recovery, “Ready to Go” Jobs and Infrastructure Projects, U.S. Conference of Mayors, December 8, 2008.
  • 5. Page 5 Prioritization: Prioritize funds on projects that are ready to go to construction and can be underway within 90 days. Formula funds that are not obligated within 180 days of the date of enactment of this Act shall be redistributed to States that are able to obligate the funds. Shovel-Ready Deadlines: Require the Federal Highway Administration (“FHWA”), States, and cities to award contracts for projects totaling at least $15 billion (50 percent) of these funds within 90 days of the date of allocation. Require FHWA, States, and cities to award contracts for all of the funding within one year of the date of enactment. Economic Impact: Create more than 841,000 jobs and $150 billion of economic activity. Equal Opportunity: Pursuant to SAFETEA-LU, as a general rule, States and cities are required to provide at least 10 percent ($3.025 billion) of the amounts made available to Disadvantaged Business Enterprises (“DBEs”), including minority- and women-owned businesses.
  • 6. Page 6 TRANSIT URBAN AND RURAL FORMULA GRANTS – $7.5 BILLION Infrastructure Needs: The cost of traffic congestion in our cities nationwide is a staggering $78 billion annually in wasted time (4.2 billion hours of delay) and fuel (2.9 billion gallons of excess fuel). Data contained in the Department of Transportation’s 2006 Conditions and Performance Report indicate that a total investment of $15.8 billion (in constant 2004 dollars) is needed annually to maintain transit systems at their current condition and level of performance. To improve the overall condition and performance of transit systems, a combined investment of $21.8 billion (in constant 2004 dollars) is needed each year. According to DOT, the annual investment gap is $3.2 billion to maintain our transit systems and $9.2 billion to begin to improve our transit systems. 6 According to DOT’s 2006 Conditions and Performance Report:  Over one-half of all urban rail transit stations are substandard;  One-third of our nation’s bus maintenance facilities are substandard;  16 percent of elevated transit structures and 13 percent of underground transit tunnels are substandard; and  eight percent of transit track is substandard. Ready-to-Go Projects: Public transit agencies have many projects that are ready to go to construction within 90 days if additional funding is made available. As of December 2008, a survey of public transportation agencies by the American Public Transportation Association (“APTA”) identified 736 ready-to-go transit projects at a total cost of $12.2 billion. 7 In addition, APTA estimates that an estimated $32.4 billion in transit investment projects could be underway within two years. Similarly, a December 2008 survey of 427 cities by the U.S. Conference of Mayors identified 628 projects at a total cost of $7.1 billion that are ready to go to construction in 2009. 8 According to APTA, almost one in five buses (approximately 12,000 buses) is eligible for replacement under Federal Transit Administration (“FTA”) regulations. Public transit agencies have many existing options to purchases buses and rail vehicles, which could be exercised to purchase these vehicles if additional funding is made available. According to APTA, public transit agencies hold options for more than 10,000 buses, valued at $5 billion, which could be exercised immediately without a new procurement process. Bus manufacturers and their suppliers have indicated that their production rates could be increased 30 to 35 percent if orders indicated a sustained Federal investment. 9 Similarly, public transit agencies hold options for more than 1,000 rail vehicles, valued at more than $2 billion, based on existing designs for subway cars, light rail vehicles, streetcars, and other rail vehicles. 10 Proposal: Provide $7.5 billion in transit capital and operating grants for ready-to-go projects, including $6.75 billion of transit urban formula funds and $750 million of transit rural formula funds. Source: Appropriate funds from the General Fund. Distribution: Distribute transit urban and rural formula funds to States, cities, and public transit agencies pursuant to existing statutory transit formulas under 49 U.S.C. 5307 and 49 U.S.C. 5311. Prioritization: Prioritize funds on projects that are ready to go to construction and can be underway within 90 days. According to DOT's 2006 Conditions and Performance report, Federal, State, and local capital expenditure for transit 6 totaled $12.6 billion in 2004. This amount is $3.2 billion less than the annual expenditure needed to maintain transit systems, and $9.2 billion less than the annual expenditure needed to improve transit systems. 7 The survey results are based on 216 public transportation agencies reporting of approximately 400 APTA members who received the survey. APTA members serve over 90 percent of U.S. transit users. 8 MainStreet Economic Recovery, “Ready to Go” Jobs and Infrastructure Projects, U.S. Conference of Mayors, December 8, 2008. 9 American Public Transportation Association letter to Mortimer L. Downey, December 11, 2008. 10 Id.
  • 7. Page 7 Shovel-Ready Deadlines: Require States, cities, and public transit agencies to award contracts for at least $3.75 billion (50 percent) of these funds within 90 days of the date of allocation. Require States, cities, and public transit agencies to award contracts for all of the funding within one year of the date of enactment. Economic Impact: Create more than 208,000 jobs and $37 billion of economic activity. Equal Opportunity: Pursuant to SAFETEA-LU, as a general rule, States, cities, and public transit agencies are required to provide at least 10 percent ($750 million) of the amounts made available to DBEs, including minority- and women-owned businesses.
  • 8. Page 8 TRANSIT ENERGY FUNDING – $2.0 BILLION Infrastructure Needs: The cost of fuel has skyrocketed, and the number of Americans choosing to commute by transit to save money and reduce their reliance on foreign oil has surged. In 2007, Americans took more than 10.3 billion trips on public transportation, the highest level in 50 years. According to a recent study, the direct petroleum savings attributable to current public transportation use in the United States is 1.4 billion gallons per year. When the secondary effects of transit availability on travel are also taken into account, the equivalent of 4.2 billion gallons of gasoline is saved annually – more than 11 million gallons of gasoline per day. 11 If Americans used public transit at the same rate as Europeans – for roughly 10 percent of their daily travel needs – the United States could reduce its dependence on imported oil by more than 40 percent, nearly equal to the 550 million barrels of crude oil that we import from Saudi Arabia each year. 12 Ready-to-Go Projects: Public transportation authorities have many energy-related projects – including the need to meet increased fuel costs and purchase clean fuel vehicles – that are ready-to- go within 90 days if additional funding is made available. As of May 2008, a survey of public transportation agencies by APTA had identified an increase in transit fuel costs of 166 percent in just four years. These added costs translate to a sharp increase in the share of operating costs dedicated to fuel, which is now almost 11 percent of public transit agencies’ total operating budgets. 13 Proposal: Provide $2 billion in transit operating and capital grants to public transit agencies to meet increased fuel costs and purchase clean fuel or alternative fuel vehicles. Source: Appropriate funds from the General Fund. Distribution: Distribute transit energy funds to States, cities, and public transit agencies pursuant to existing statutory transit urban and rural formulas under SAFETEA-LU. See section 3 of H.R. 6052, the “Saving Energy Through Public Transportation Act of 2008”, as passed by the House on June 26, 2008. Prioritization: Prioritize funds on projects that are ready to go to construction and can be underway within 90 days. Shovel-Ready Deadlines: Require States, cities, and public transit agencies to award contracts for projects totaling at least $1 billion (50 percent) of these funds within 90 days of the date of allocation. Require States, cities, and public transit agencies to award contracts for all of the funding within one year of the date of enactment. Equal Opportunity: Pursuant to SAFETEA-LU, as a general rule, States, cities, and public transit agencies are required to provide at least 10 percent ($200 million) of the amounts made available to DBEs, including minority- and women-owned businesses. Public Transportation and Petroleum Savings in the U.S.: Reducing Dependence on Oil, ICF International, January 2007; The 11 Broader Connection between Public Transportation, Energy Conservation and Greenhouse Gas Reductions, ICF International, February 2008. 12 Conserving Energy and Preserving the Environment: The Role of Public Transportation, Shapiro, Hassett, and Arnold, 2002. 13 Survey results based on 96 public transportation agencies reporting. Survey was sent to just under 400 APTA members. APTA members serve over 90 percent of U.S. transit users.
  • 9. Page 9 TRANSIT NEW STARTS CONSTRUCTION – $2.5 BILLION Infrastructure Needs: New Starts transit project delays are growing at an alarming rate. The Department of Transportation has not signed any federal funding agreements for New Starts projects during 2008, even though approximately 300 New Starts projects were authorized in SAFETEA-LU. Data from the Federal Transit Administration (“FTA”) indicate that more than $4 billion in existing New Starts funding agreements are outstanding as of FY 2009. In addition, projects that already have multi-year New Starts funding agreements have seen their yearly Federal commitments cut. This delay and backtracking at the Federal level creates additional financial burdens for state and local governments. One study shows that for each year of delay in major transportation projects (those with total project costs of $1 billion or more), an additional $46 million is added to the project cost. 14 Ready-to-Go Projects: Public transportation authorities have many New Starts projects that are either currently in construction or ready-to-go to construction within 90 days if additional funding is made available. FTA has documented more than $2.4 billion in pre-approved New Starts funding that could immediately be advanced to 19 projects across the country to construct New Start and Small Start projects. In addition, FTA has identified a New Starts funding shortfall of more than $71.1 million that is required to be restored to 13 New Starts construction projects, and could also be advanced immediately. Proposal: Provide $2.5 billion in transit capital grants for New Starts construction projects. Source: Appropriate funds from the General Fund. Distribution: Distribute New Starts project construction funds to public transit agencies pursuant to existing authority under SAFETEA-LU, FTA Full Funding Grant Agreements, and FTA Project Construction Grant Agreements. The FAA would determine the distribution of funds through its existing competitive process. Prioritization: Prioritize funds on projects that are ready to go to construction and can be underway within 90 days. Shovel-Ready Deadlines: Require public transit agencies to award contracts for projects totaling at least $625 million (25 percent) of these funds within 90 days of the date of grant receipt. Require public transit agencies to award contracts for all of the funding within one year of the date of enactment. Economic Impact: Create more than 168,000 jobs and $30 billion of economic activity. Furthermore, the additional $2.5 billion of New Starts funding will make available an additional $5 billion of contingent commitment authority to enable FTA to sign additional New Starts funding agreements for future transit construction projects. Equal Opportunity: Pursuant to SAFETEA-LU, as a general rule, states, cities, and public transit agencies are required to provide at least 10 percent ($250 million) of the amounts made available to DBEs, including minority- and women-owned businesses. 14 What Causes Cost Overrun in Transport Infrastructure Projects?, Flyvbjerg, Holm and Buhl, January 2004.
  • 10. Page 10 RAIL – $5 BILLION Infrastructure Needs: Demand for intercity passenger rail has increased and Amtrak ridership is higher than at any point in its history. In 2007, the Passenger Rail Working Group of the National Surface Transportation Policy and Revenue Study Commission reported that the total capital cost for re-establishing the national intercity passenger rail network between now and 2050 is $357.2 billion, or an annualized cost of $8.1 billion. With respect to freight rail, DOT estimates that the demand for rail freight transportation – measured in tonnage – will increase 88 percent by 2035. A study conducted by Cambridge Systematics, Inc. estimates that an investment of $148 billion (in 2007 dollars) for rail infrastructure expansion over the next 28 years is required to keep pace with economic growth and meet DOT’s forecast demand. Of this amount, the short line and regional freight railroads’ share is projected to be $13 billion, which includes $320 million for line expansion; $5 billion for major improvements to tunnels, bridges, and clearances; and $7.23 billion for branch line upgrades. Ready-to-Go Projects: Amtrak has identified at least $500 million in ready-to-go projects, including car overhauls, replacement of aging equipment, fire and life safety improvements, improvements to track, structures, electric traction, and communications and signals, and customer and information technology enhancements, if additional funding is made available. Amtrak has identified a total of $3.8 billion of projects that are ready to go to construction within two years. Similarly, a December 2008 survey of 427 cities by the U.S. Conference of Mayors identified 41 Amtrak projects at a total cost of $1.1 billion that are ready to go to construction in 2009. 15 In addition, the States for Passenger Rail Coalition has identified $1.4 billion in ready-to-go intercity passenger rail capital projects, including corridor development projects, station and terminal improvements, improvements to track, siding, signal, and grade crossings, and the purchase of new equipment. The States for Passenger Rail Coalition has identified a total of $9.4 billion of projects that are ready to go to construction within two years. Similarly, the Midwest Interstate Passenger Rail Commission has identified more than $815 million of high-speed and intercity passenger rail projects that are ready to go to construction within 120 days. The American Short Line and Regional Railroad Association has identified $511 million in ready-to- go projects, including upgrades to rail and roadbed, bridges, tunnels, and intermodal terminals, overhaul and replacement of existing locomotives to “green technology”, expansion of rail yards, and grade crossing improvements. Proposal: 1. Provide $1.5 billion for capital grants to Amtrak; 2. Provide $3.4 billion for high-speed and intercity passenger rail capital grants to States; and 3. Provide $100 million for capital grants to short line and regional railroads. Source: Appropriate funds from the General Fund. Distribution: Distribute $1.5 billion of capital grants to Amtrak; distribute $3.4 billion of high- speed intercity passenger rail capital grants to States through DOT competitive grant programs as authorized by 49 U.S.C. 26106, as added by section 501 of the Passenger Rail Investment and Improvement Act of 2008 (Division B of P.L. 110-432) and chapter 244 of Title 49, United States Code, as added by section 301 of the Passenger Rail Investment and Improvement Act of 2008 (Division B of P.L. 110-432); and distribute $100 million of short line capital grants to regional and short line railroads through a DOT competitive grant program as authorized by 49 U.S.C. 22301, as amended by section 1112 of the Energy Independence and Security Act of 2007 (P.L. 110-140). MainStreet Economic Recovery, “Ready to Go” Jobs and Infrastructure Projects, U.S. Conference of Mayors, December 8, 2008. 15
  • 11. Page 11 Prioritization: Prioritize funds on projects that are ready to go to construction and can be underway within 90 days.
  • 12. Page 12 Shovel-Ready Deadlines: 1. Require Amtrak to award contracts for projects totaling at least $375 million (25 percent) of these funds within 90 days of the date of grant receipt. Require Amtrak to award contracts for projects totaling at least $750 billion (50 percent) of these funds within one year of the date of enactment and award contracts for all of the funds within two years of the date of enactment; 2. Require States to award contracts for projects totaling at least $850 million (25 percent) of these funds within 90 days of the date of grant receipt. Require States to award contracts for projects totaling at least $1.7 billion (50 percent) of these funds within one year of the date of enactment and award contracts for all of the funds within two years of the date of enactment; and 3. Require short line and regional railroads to award contracts for projects totaling at least $50 million (50 percent) of these funds within 90 days of the date of grant receipt. Require the railroads to award contracts for all of the funding within one year of the date of enactment. Economic Impact: Create approximately 139,000 jobs and $25 billion of economic activity.
  • 13. Page 13 AVIATION AIRPORT IMPROVEMENT PROGRAM – $5 BILLION Infrastructure Needs: Increased investment in our airport infrastructure is necessary to maintain a safe and efficient aviation system. The Federal Aviation Administration’s (“FAA”) recently-released National Plan of Integrated Airport Systems (2009-2013) (“NPIAS”) estimates that there will be $49.7 billion of Airport Improvement Program (“AIP”)-eligible projects during the next five years – an increase of 21 percent compared to the last NPIAS that the FAA issued two years ago. Additional funds are needed to allow the AIP program to keep pace with inflationary cost increases and meet airport safety and capacity needs. Ready-to-Go Projects: The FAA has identified at least $1.5 billion of ready-to-go AIP projects if additional funding is made available. The FAA has identified a total of $5 billion of AIP projects that are ready-to-go to construction within two years. These projects include runway or taxiway rehabilitations, extensions, and widening; obstruction removal; apron construction, expansion or rehabilitation; runway lighting improvements; signage improvements; security enhancements; Airport Rescue and Firefighting equipment and facilities; and airside service or public access roads. Proposal: Provide $5 billion for the Airport Improvement Program. Source: Appropriate funds from the Airport and Airway Trust Fund. Distribution: Distribute funds to airports through existing AIP Discretionary Grants program. The FAA would determine the distribution of funds through its existing competitive process. Prioritization: Prioritize funds on projects that are ready to go to construction and can be underway within 90 days. Shovel-Ready Deadlines: Require airports to award contracts for projects totaling at least $1 billion (20 percent) of these funds within 90 days of the date of grant receipt. Require airports to award contracts for projects totaling at least $2.5 billion (50 percent) of these funds within one year of the date of enactment and award contracts for all of the funds within two years of the date of enactment. Economic Impact: Create approximately 174,000 jobs and $31 billion of economic activity.
  • 14. Page 14 AVIATION FAA FACILITIES & EQUIPMENT – $250 MILLION Infrastructure Needs: The Federal Aviation Administration (“FAA”) has a significant backlog of infrastructure projects needed to sustain or replace existing air traffic control facilities. In addition, the FAA could accelerate the installation of runway safety technology and equipment at airports if additional funding is made available. Runway incursions are an identified risk that can be mitigated by installing systems such as the Airport Surface Detection Equipment Model X (“ASDE X”) and Runway Status Lights. Accelerated installation of these systems would provide immediate economic stimulus in the form of construction jobs, as well as increased safety to the public. Ready-to-Go Projects: The FAA has identified at least $185 million in infrastructure projects and $65 million in runway safety projects that are ready to go within 90 to 180 days, if additional funding is made available. The infrastructure projects include:  Backup Power Systems: Fund backup power projects such as battery, engine generator and cable replacements, enroute traffic control center power improvements, and lightning protection ($40 million).  Enroute Traffic Control Center Modernization/Sustainment: Fund modernization and sustainment of enroute traffic control centers ($40 million).  Air Traffic Control Tower/Approach Control (“TRACON”) Facilities: Fund replacement of air traffic control towers and approach control facilities that are in poor condition. TRACON replacement projects have completed design and engineering, and contracts could be awarded within three or four months of receipt of funding ($80 million).  Navigation and Landing/Unmanned Air Traffic Control facilities sustainment: Fund installation and sustainment of Instrument Landing Systems ($15 million).  FAA Technical Center and Aeronautical Center: Fund facility sustainment of the FAA’s Technical Center and Aeronautical Center ($10 million). The runway safety projects include:  Accelerate Installation of ASDE X: Accelerate installation of ASDE X, which is a surface surveillance system that processes information from radar and other sources to provide location and aircraft identification information to air traffic controllers, at major airports. ASDE X provides controllers with a visual representation of the traffic situation on the airport surface and arrival corridors. The accelerated installation can be accomplished under the existing AXDE X contract ($15 million).  Accelerate Installation of Runway Status Lights: Accelerate installation of Runway Status Light (“RWSL”) systems. Implementation includes construction of lighting equipment at airports equipped with ASDE X technology to share common runway status information with pilots. The accelerated installation can be accomplished under the existing RWSL contract ($50 million). Proposal: Provide $250 million for the FAA’s Facilities and Equipment program. Source: Appropriate funds from the Airport and Airway Trust Fund. Distribution: Distribute funds through the FAA’s existing administrative processes. Prioritization: Prioritize funds on projects that are ready to go to construction and can be underway within 90 days. Shovel-Ready Deadlines: Require the Federal Aviation Administration to award contracts for projects totaling at least $125 million (50 percent) of these funds within 90 days of the date of enactment. Require the FAA to award contracts for all of the funding within one year of the date of enactment. Economic Impact: Create approximately 7,000 jobs and $1.55 billion of economic activity.
  • 15. Page 15 ENVIRONMENTAL INFRASTRUCTURE CLEAN WATER SRF – $12 BILLION Infrastructure Needs: High quality drinking water and wastewater treatment are critical to protecting human health and the environment. The Congressional Budget Office estimates that there is an annual investment need of between $11.6 billion and $20.1 billion to ensure a safe, clean supply of drinking water, and an additional need for annual investment of between $13 billion and $20.9 billion in wastewater treatment. Given current funding levels from all sources, there is an annual investment gap for wastewater and drinking water infrastructure of at least $3 billion and as much as $19.4 billion. There are 772 communities in 33 states and the District of Columbia with a total of 9,471 identified combined sewer overflow problems. Combined sewer overflows contribute to the ongoing contamination of the nation’s waters by releasing approximately 850 million gallons of raw or partially-treated sewage annually. In addition, the Environmental Protection Agency (“EPA”) estimates that between 23,000 and 75,000 sanitary sewer overflows occur each year in the United States, releasing between 3 to 10 billion gallons of sewage per year. The EPA estimates that more than $50.6 billion is necessary to correct combined sewer overflow problems, and an additional $88.5 billion to eliminate sanitary sewer overflows. While the demand for Clean Water State Revolving Fund (“Clean Water SRF”) funds is increasing, appropriations have declined significantly. The decreased funding has created a pent-up demand in the States for project funding. Needs are driven by new treatment requirements that must be met (e.g., to control nutrients, sewer overflows, stormwater and nonpoint sources), as well as aging infrastructure that must be replaced or repaired to maintain current levels of pollution control. There are additional needs to implement “green infrastructure” technologies, such as on-site source controls to capture stormwater, stream buffers, and other water reuse technologies, that provide equal or greater environmental benefit at a reduced cost, reduce wet-weather related “peak” loads, and promote water conservation and reuse. Similarly, there is a significant need for energy- efficiency improvements at publicly owned treatment works. Ready-to-Go Projects: A recent survey by the Council of Infrastructure Financing Authorities and the Association of State and Interstate Water Pollution Control Administrators (“ASIWPCA”) identified $10 billion of Clean Water SRF projects (with only 30 States reporting) that are ready to go to construction if additional funding is made available. For example, most wastewater treatment utilities have small capital-related projects on the shelf that could be carried out very quickly, such as pumps, compressors, bar screens, trucks, security measures, and polishing pond expansions. Similarly, a December 2008 survey of 427 cities by the U.S. Conference of Mayors identified 2,536 water and wastewater treatment projects at a total cost of $15.4 billion that are ready to go to construction in 2009. 16 Finally, American Rivers has identified 77 “green infrastructure” projects (with only 13 States and the District of Columbia reporting) valued at more than $600 million that could be obligated within six months of the date of enactment. Proposal: Provide an additional $12 billion to construct, rehabilitate, and modernize the nation’s wastewater infrastructure through the Clean Water SRF program. Within the existing Clean Water SRF allocation to States, direct individual State infrastructure financing authorities to: (1) utilize 40 percent of the capitalization grants for additional subsidizations or grants to disadvantaged communities and communities with populations of 50,000 individuals or fewer, and (2) utilize 15 percent of the capitalization grant for investment in projects or technologies that use environmentally sensitive, and energy and water efficient plans or components (i.e., green infrastructure). Source: Appropriate funds from the General Fund. Distribution: Distribute $12 billion for the Clean Water SRF pursuant to the existing Clean Water Act distribution formula. The Clean Water SRF serves communities of all sizes – 75 percent of loans have been made to communities with a population of less than 10,000 and 45 percent of the funds have gone to communities with a population of 100,000 or more. However, in 1987, Congress converted the MainStreet Economic Recovery, “Ready to Go” Jobs and Infrastructure Projects, U.S. Conference of Mayors, December 8, 2008. 16
  • 16. Page 16 Clean Water Construction Grants program to the Clean Water SRF. As a result, Federal wastewater infrastructure funding for most medium-sized and smaller communities (communities with populations of 50,000 individuals or fewer) has come in the form of loans under the SRF rather than grants. Under this proposal, State infrastructure financing authorities are required to utilize 40 percent of the capitalization grant for additional subsidizations or grants to communities with populations of 50,000 individuals or fewer, thereby increasing the affordability of wastewater infrastructure projects to many medium-sized and smaller communities. In addition, this proposal requires State infrastructure financing authorities to utilize an additional 15 percent of the capitalization grant for “green technologies”, either through additional subsidizations, grants, or other mechanisms that encourage investment in projects or technologies which utilize environmentally sensitive, and energy and water efficient plans or components. Prioritization: Prioritize funds on projects that are ready to go to construction and can be underway within 90 days. Shovel-Ready Deadlines: Require State infrastructure financing authorities to award contracts for projects totaling at least $3 billion (25 percent) of these funds within 90 days of the date of allocation. Require authorities to award contracts for projects totaling at least $6 billion (50 percent) of these funds within one year and award contracts for all of the funding within two years of the date of enactment. Economic Impact: Create approximately 334,000 jobs and $59 billion of economic activity.
  • 17. Page 17 ENVIRONMENTAL INFRASTRUCTURE ALTERNATIVE WATER SOURCE – $500 MILLION Infrastructure Needs: In recent years, there has been increasing interest by communities across the nation to ensure the availability of water sources to meet future water supply needs. Growth in population, increased awareness of the impacts of global climate change, and increasing environmental awareness are causing many communities to explore alternative water supplies through reclamation, reuse, and conservation of water and wastewater. Although alternative water source projects are eligible under the Clean Water Act SRF program, most Clean Water SRF funding is used to finance traditional wastewater infrastructure projects, not projects to enhance water supplies. In 2000, Congress enacted the Estuaries and Clean Waters Act (P.L. 106-457), which created a competitive grant pilot program for alternative water source projects (section 220 of the Clean Water Act.) Proposal: Provide an additional $500 million for the Environmental Protection Agency’s (“EPA”) Alternative Water Source Program. Source: Appropriate funds from the General Fund. Distribution: Distribute funds to States, water resource development agencies, local government agencies, private utilities, and nonprofit entities through EPA’s competitive grant process. Prioritization: Prioritize funds on projects that are ready to go to construction and can be underway within 90 days. Shovel-Ready Deadlines: Require States, water resources development agencies, local government agencies, private utilities, and nonprofit entities to award contracts for projects totaling at least $125 million (25 percent) of these funds within 90 days of the date of grant receipt. Require that authorities to award contracts totaling at least $250 million (50 percent) of these funds within one year and award contracts for all of the funding within two years of the date of enactment. Economic Impact: Create more than 13,900 jobs and $2.4 billion of economic activity.
  • 18. Page 18 ENVIRONMENTAL INFRASTRUCTURE – NONPOINT SOURCE MANAGEMENT PROGRAM – $1 BILLION Infrastructure Needs: Over the past 30 years, the Clean Water Act has made great advances in improving the quality of U.S. waters and controlling various sources of pollution, with one large exception – nonpoint sources of pollution. Nonpoint source pollution refers to the polluting of water by diffuse sources rather than single identifiable “point” sources. These diffuse sources are usually associated with land use activities as opposed to end-of-pipe discharges. Examples of common nonpoint source pollutants include: sediments, fertilizers, and pesticides from rural farms and urban lawns; bacteria and viruses from livestock and pet waste; sediments and soil from improperly managed construction sites and timber harvesting; oil and chemicals from urban runoff flowing over streets, parking lots, and industrial facilities; and a variety of pollutants from airborne pathways. After 36 years of Federal and state efforts to protect water quality, the single largest remaining and uncontrolled contributor of pollutants to the nation’s waters is nonpoint sources. In fact, EPA has estimated that 90 percent of the nation’s impaired waters are contaminated, in part, by nonpoint sources of pollution. In 1987, Congress amended the Clean Water Act to establish the section 319 Nonpoint Source Management Program because it recognized the need for greater Federal leadership to help focus State and local nonpoint source efforts. Under section 319 of the Clean Water Act, States, Territories, and Indian Tribes receive grants which support a wide variety of activities including technical assistance, financial assistance, education, training, technology transfer, demonstration projects, and monitoring to assess the success of specific nonpoint source implementation projects. Section 319 funds are allocated to each State according to the Environmental Protection Agency’s (“EPA”) administrative allocation formula. In fiscal year 2008, Congress appropriated $201 million for the Nonpoint Source Management Program. According to the most recent EPA Clean Water Needs Survey, total nonpoint source needs over the next 20 years are $38 billion or $1.9 billion annually on average. However, this amount does not include data from all States and all categories of nonpoint sources of pollution. A recent report published by the Association of State and Interstate Water Pollution Control Administrators (“ASIWPCA”), entitled “Call for Change”, notes that the current level of section 319 funding is not sufficient to run a comprehensive nonpoint source program. For example, according to a State survey conducted by ASWIPCA, States in the Northeast have reported that they could utilize 100 percent to 500 percent more section 319 funding than is currently allocated to these States. These projections, however, are likely to be much larger for the agricultural-intensive Midwestern States. Proposal: Provide $1 billion for EPA’s Nonpoint Source Management Program. Source: Appropriate funds from the General Fund. Distribution: Distribute funds to States pursuant to EPA’s existing administrative allocation formula. The allocation formula is contained in Appendix G of EPA’s 1997 Nonpoint Source Guidance. Prioritization: Prioritize funds on projects that are ready to go to construction and can be underway within 90 days. Shovel-Ready Deadlines: Require States to award contracts for projects totaling at least $250 million (25 percent) of these funds within 90 days of the date of allocation. Require States to award contracts for projects totaling at least $500 million (50 percent) of these funds within one year and award contracts for all of the funding within two years of the date of enactment. Economic Impact: Create more than 27,800 jobs and $4.96 billion of economic activity.
  • 19. Page 19 ENVIRONMENTAL INFRASTRUCTURE NATIONAL ESTUARY PROGRAM – $100 MILLION Infrastructure Needs: The National Estuary Program is intended to promote comprehensive planning efforts to help protect nationally significant estuaries in the United States that are deemed to be threatened by pollution, development, or overuse. Twenty-eight estuaries are currently authorized by the Clean Water Act, including Chesapeake Bay, Long Island Sound, New York and Connecticut; Narragansett Bay, Rhode Island; Puget Sound, Washington; San Francisco Bay, California; and Galveston Bay, Texas. National Estuary Program (“NEP”) offices are intended to utilize Federal funds, in part, to leverage additional resources from state and local governments, and from public and private sector sources. Over the past two decades, NEPs have attracted funding from a variety of sources and partnerships including the Clean Water State Revolving Fund program, stormwater utility fees, municipal bond funding, fines and settlements, and sales fees. According to the Environmental Protection Agency (“EPA”), the National Estuary Program received a total of $85 million between fiscal years 2003 and 2007. However, the Program was able to leverage nearly $1.3 billion in funding from non-EPA sources. This is a funding ratio of non-EPA to EPA funds of 15.5 to 1. EPA exercises oversight authority over the local NEP programs, and provides technical assistance (e.g., finance planning, smart growth, monitoring and assessment) and programmatic assistance (policy development) to estuary management programs. For example, estuary management programs are required to periodically monitor the effectiveness of their management activities to address estuary-specific priority actions (as established through the Management Conference). Ready-to-Go Projects: The Restore America’s Estuaries coalition, which represents 11 of the nation’s 28 estuary management programs, conducted a study of a majority of all 28 estuaries and identified $71.6 million in 121 ready-to-go projects, including projects to address stormwater runoff, create tidal lagoons for habitat restoration, and restore wetlands. Proposal: Provide $100 million for the National Estuary Program. Source: Appropriate funds from the General Fund. Distribution: Distribute funds to estuary management programs through EPA’s current administrative process. Prioritization: Prioritize funds on projects that are ready to go to construction and can be underway within 90 days. Shovel-Ready Deadlines: Require estuary management programs to award contracts for projects totaling at least $50 million (50 percent) of these funds within 90 days of the date of grant receipt. Require estuary management programs to award contracts for projects totaling at least $75 million (75 percent) of these funds within one year and award contracts for all of the funding within two years of the date of enactment. Economic Impact: Create approximately 2,780 jobs and $500 million of economic activity.
  • 20. Page 20 ENVIRONMENTAL INFRASTRUCTURE GREAT LAKES LEGACY CONTAMINATED SEDIMENT REMEDIATION – $400 MILLION Infrastructure Needs: The Great Lakes Legacy Act authorizes funding to clean up contaminated sediment sites in those areas of the U.S. Great Lakes that have areas of concern. This funding is used for remediation, public outreach, and research. Legacy Act cleanup is primarily focused on those sites that are not National Priorities List (i.e., Superfund) sites. Thirty-one areas of concern – with multiple discrete hazardous waste sites eligible for Legacy Act funding – exist in and around the Great Lakes. Sites with high concentrations of toxic substances are often the historical, or legacy, remnants of former industrial pollution. While the discharge of these pollutants has largely ceased, these historical pollutants remain in contaminated sediment in those areas. Due, in part, to stagnant funding levels, only four discrete hazardous waste sites (within U.S. areas of concern) have been remediated since the Legacy Act was enacted in 2002. Legacy Act remediation projects are conducted through negotiated agreements between the Environmental Protection Agency (“EPA”) and a non-Federal sponsor. Cleanup projects are cost- shared, with the non-Federal sponsor being responsible for 100 percent of the operation and maintenance costs. Projects are first monitored and evaluated by EPA to determine the nature and extent of contamination. Pursuant to the Great Lakes Legacy Reauthorization Act of 2008 (P.L. 110-365), the Federal Government is responsible for 100 percent of initial site assessment costs. After site assessment, the non-Federal sponsor enters into a cost-share agreement with the Federal Government and remediation begins. When remediation is complete at a site, or project, in a given area of concern and beneficial uses are no longer impaired, an area of concern can be delisted. The Great Lakes Commission, which includes State-elected representatives from each of the eight Great Lakes States, recommends an additional $250 million for Legacy Act projects for the upcoming fiscal year. Ready-to-Go Projects: The Environmental Protection Agency has identified $160 million of Legacy Act ready-to-go projects. EPA has identified a total of $657 million of Legacy Act projects that are ready-to-go to construction within two years. Proposal: Provide $400 million for EPA’s Great Lakes Legacy Act Program. Source: Appropriate funds from the General Fund. Distribution: Distribute funds to Legacy Act projects through EPA’s current administrative process. Prioritization: Prioritize funds on projects that are ready to go to construction and can be underway within 90 days. Shovel-Ready Deadlines: Require non-Federal sponsors to award contracts for projects totaling at least $100 million (25 percent) of these funds within 90 days of the date of grant receipt. Require non-Federal sponsors to award contracts for projects totaling at least $200 million (50 percent) of these funds within one year and award contracts for all of the funding within two years of the date of enactment. Economic Impact: Create approximately 11,000 jobs and $2 billion of economic activity.
  • 21. Page 21 ENVIRONMENTAL INFRASTRUCTURE BROWNFIELDS – $275 MILLION Infrastructure Needs: Brownfields are properties, the expansion, redevelopment, or reuse of which may be complicated by the presence or potential presence of a hazardous substance, pollutant, or contaminant. Types of brownfields include inactive factories, gas stations, salvage yards, or abandoned warehouses. These sites drive down property values, provide little or no tax revenue, and contribute to community blight. There are estimated to be between 450,000 to one million brownfields sites in the United States. Redevelopment of these abandoned sites can promote economic development, revitalize neighborhoods, enable the creation of public parks and open space, or preserve existing properties, including undeveloped green spaces. According to Environmental Protection Agency (“EPA”) statistics, Federal funding of brownfields cleanup has a significant beneficial impact on state and local governments, in terms of returning underutilized properties to productive use and local tax rolls, as well a proven track record of leveraging additional public and private sector redevelopment funding and job creation. According to EPA, since the enactment of EPA’s brownfields program in 2002, the Federal investment of $593.7 million has leveraged more than $10.4 billion in cleanup and redevelopment funding and helped create 47,201 jobs in cleanup, construction, and redevelopment. Given current Federal funding levels (approximately $70 million per year), there is an annual investment gap of approximately $280 million for backlogged applications for brownfield projects. Ready-to-Go Projects: In fiscal year 2008, the Environmental Protection Agency received 845 proposals requesting funding, but announced that only 209 projects were selected to receive 314 assessment, revolving loan fund, and cleanup grants totaling $74 million. Fully funding these 845 proposals would require a total of $350 million. Proposal: Provide $275 million for EPA’s Brownfields Discretionary Grant Program. Source: Appropriate funds from the General Fund. Distribution: Distribute funds to States, cities, and redevelopment agencies through existing EPA Brownfields Discretionary Grant program for site assessments, remediation and cleanup grants, and to capitalize state brownfield revolving loan programs as authorized under section 104(k) of the Comprehensive Environmental Response, Compensation, and Liability Act of 1980, as amended by the Brownfields Revitalization and Environmental Restoration Act of 2001 (P.L. 107-118). Prioritization: Prioritize funds on projects that are ready to go to construction and can be underway within 90 days. Shovel-Ready Deadlines: Require States, cities, and redevelopment agencies to award contracts for projects totaling at least $137.5 million (50 percent) of these funds within 90 days of the date of grant receipt. Require States, cities, and redevelopment agencies to award contracts for all of the funding within one year of the date of enactment. Economic Impact: Create more than 7,600 jobs and $1.4 billion of economic activity.
  • 22. Page 22 U.S. ARMY CORPS OF ENGINEERS – $7 BILLION Infrastructure Needs: Due to relatively flat funding for the U.S. Army Corps of Engineers’ (“Corps”) budget over the last 20 years, there has been an ever increasing backlog of unfunded or underfunded flood control, navigation, and environmental restoration projects. This backlog has resulted in increased timelines for project completion, tremendous cost overruns due to inflation, and denied benefits to public safety, the environment, and the economy. The current total for the backlog of authorized projects is estimated to be $60 billion. Many existing Corps projects are advancing more slowly than they could be because of lack of funding. For example, considering only those projects for which funding was requested in the President’s FY 2009 Budget, the Corps could proceed with a total of $8 billion for these projects in FY 2009. However, the President only requested $5.242 billion for the Corps, more than one-third less than necessary to fund these FY 2009 projects at full capability. These figures do not include any funding for projects authorized in the recent Water Resources Development Act of 2007 or many other projects which were authorized in prior Water Resources Development Acts. Ready-to-Go Projects: According to the Corps, additional funds could be used for the following ready-to-go projects:  substantially reduce the backlog of critical maintenance and repairs at approximately 360 multiple purpose, flood control, hydropower, recreation, water supply, and navigation projects;  repair several high-risk dam safety projects;  rehabilitate and upgrade hydropower plants to achieve an industry standard of 98 percent plant availability;  address the oldest and most at-risk projects on the inland waterways system;  expedite the construction of critical environmental projects, returning critical ecosystems to a more natural state sooner than would otherwise be possible. Projects producing beneficial impacts on more than one million acres could be expedited. Of these outputs, approximately 90 percent are nationally significant and would contribute greatly to long-term environmental sustainability;  dredge the nation’s 296 highest-use, deep-draft commercial ports to their authorized depths. Approximately 94 percent of the nation’s imports and exports are carried through these ports;  dredge our inland waterways to authorized depth and width to facilitate the movement of approximately 750 million tons of freight per year, including the majority of the nation’s agricultural exports and bulk commodities such as iron ore, coal, fertilizer, and bulk road construction materials; and  repair and upgrade critical flood damage reduction and hurricane and storm damage reduction projects that serve as a defense to key population centers. Proposal: 1. Provide an additional $3.0 billion for the Corps of Engineers Construction program; 2. Provide an additional $3.2 billion for the Corps of Engineers Operations and Maintenance program; and 3. Provide an additional $800 million for the Corps of Engineers Mississippi River and Tributaries program. Source: Appropriate funds from the General Fund and the Harbor Maintenance Trust Fund. Distribution: Distribute funds to the Corps of Engineers. The Corps would determine the distribution of funds through its existing project selection process.
  • 23. Page 23 Prioritization: Prioritize funds on projects that are ready to go to construction and can be underway within 90 days. Shovel-Ready Deadlines: Require the Corps of Engineers to award contracts for projects totaling at least $1.4 billion (20 percent) of these funds within 90 days of the date of enactment. Require the Corps to award contracts totaling at least $3.5 billion (50 percent) of these funds within one year and award contracts for all of the funding within two years of the date of enactment. Economic Impact: Create approximately 147,000 jobs and $34 billion of economic activity. According to the Corps, it is estimated that $7 billion of additional funding would create 147,000 new jobs. These new jobs would include almost 52,800 new private sector jobs with the average income for workers in these jobs of $38,000 to $42,500. In addition, this funding would create an additional 94,200 new jobs in industries supplying the construction and operation and maintenance activities and the industries that sell goods and services to these new workers and their families.
  • 24. Page 24 FEDERAL BUILDINGS – $9.7 BILLION Infrastructure Needs: According to the General Services Administration (“GSA”), capital reinvestment requirements to maintain existing Federal buildings exceed $7 billion. Federal building infrastructure in the United States has long been neglected. Numerous studies indicate that the nation’s ability to make efficient resource allocations for vital infrastructure is hampered by entrenched obstacles that include competing interests, legal and budgetary limitations, and the bias in the existing budget process against capital planning. Moreover, Federal buildings have high energy cost requirements. Each year, GSA spends more than $450 million on energy costs on the government-owned inventory of Federal buildings. Renovations of Federal buildings include important energy and water conservation measures. Pursuant to sections 431 and 433 of the Energy Independence and Security Act of 2007 (P.L. 110- 140) and Executive Order 13423, these renovations must reduce the energy cost of the building by at least 20 percent and reduce the consumption of fossil fuel-generated electricity by 55 percent below comparable buildings. For instance, GSA proposes to renovate the Federal building at 1800 F Street in Washington, D.C., which was constructed in 1917. The proposed renovation includes installing a photovoltaic roof and geothermal technology to increase the efficiency of the chilled- water plant on the site. Similarly, the construction of new Federal buildings with significant renewable energy components, particularly photovoltaic systems, can provide Federal leadership to reduce our nation’s dependence on foreign oil and address global climate change. Ready-to-Go Projects: GSA has identified $4.88 billion of major repair and alteration and new construction projects that are ready to go to construction within 90 to 120 days if additional funding is made available. According to GSA, these ready-to-go Federal building, U.S. courthouse, and border station projects include 29 major repair and alteration projects in 18 States and the District of Columbia, at a cost of $3.15 billion. The renovations of these Federal buildings and U.S. courthouses include important energy and water conservation elements. In addition, GSA has identified $513 million of small ready-to-go repair projects nationwide under its non-prospectus and energy and water conservation programs. Finally, GSA has identified 10 Federal buildings, U.S. courthouses, and border stations in 10 States that are ready to go to construction, at a cost of $1.2 billion, within 120 days. In addition, GSA has identified a total of $21.3 billion of major repair and alteration and new construction projects that are ready to go to construction within two years if additional funding is made available. These projects include 47 major repair and alteration projects in 24 States and the District of Columbia, at a cost of $6.27 billion. In addition, GSA has identified $914 million of small ready-to-go repair projects nationwide under its non-prospectus and energy and water conservation programs. Finally, GSA has identified 107 new Federal buildings, U.S. courthouses, and border stations across the country that are ready-to-go to construction, at a cost of $14.1 billion, within two years. Proposal: 1. Provide $6 billion for repair and alteration of Federal buildings and U.S. courthouses; and 2. Provide $3.7 billion for construction of Federal buildings, U.S. courthouses, and border stations 3. Of the amounts provided, not less than $1 billion shall be available for the repair, alteration, and construction of U.S. courthouses. Funds are available for construction of a U.S. courthouse only if the design of the project provides courtroom space for senior judges for up to 10 years from senior status not to exceed one courtroom for every two senior judges. Source: Appropriate funds from the General Fund. Distribution: Distribute funds through existing GSA prospectus and non-prospectus programs. GSA would determine the distribution of funds through its existing administrative processes.
  • 25. Page 25 Prioritization: Prioritize funds on projects that are ready to go to construction and can be underway within 90 days. Shovel-Ready Deadlines: Require GSA to award contracts for projects totaling at least $2.43 billion (25 percent) of these funds within 90 days of the date of enactment. Require GSA to award contracts for projects totaling at least $4.85 billion (50 percent) of these funds within one year and award contracts for all of the funding within two years of the date of enactment. Economic Impact: Create approximately 270,000 jobs and $48 billion of economic activity.
  • 26. Page 26 SMITHSONIAN INSTITUTION – $270 MILLION Infrastructure Needs: According to the Smithsonian Institution, there is an urgent need for capital investment in several of the Institution’s landmark facilities to maintain and upgrade these facilities. Energy efficiency upgrades comprise about 50 percent of the capital funding needs. Ready-to-Go Projects: The Smithsonian Institution has identified more than $403 million of projects that are ready to go to construction in fiscal year 2009 if additional funding is made available. These ready-to-go projects include repair and alteration of the Smithsonian Institution’s Arts and Industries Building and National Zoo and construction of the Smithsonian Environmental Research Center Mathias Laboratory. Proposal: Provide $270 million for repair, alteration, and construction of Smithsonian Institution facilities. Source: Appropriate funds from the General Fund. Distribution: Distribute funds through the Smithsonian Institution’s existing administrative processes. Prioritization: Prioritize funds on projects that are ready to go to construction and can be underway within 90 days. Shovel-Ready Deadlines: Require the Smithsonian Institution to award contracts for projects totaling at least $135 million (50 percent) of these funds within 90 days of the date of enactment. Require the Smithsonian Institution to award contracts for all of the funding within one year of the date of enactment. Economic Impact: Create more than 7,500 jobs and $1.3 billion of economic activity.
  • 27. Page 27 ARCHITECT OF THE CAPITOL – $20 MILLION Infrastructure Needs: According to the Architect of the Capitol (“AOC”), there is an urgent need for capital investment in several AOC facilities to maintain and upgrade these facilities. These projects include energy efficiency upgrades and life safety and security upgrades. Ready-to-Go Projects: The AOC has identified eight projects that are ready to go to construction within 90 to 120 days if additional funding is made available. These projects include roof replacement, street repaving, security barrier replacement, and Capitol Power Plant infrastructure maintenance. Proposal: Provide $20 million for repair and alteration of U.S. Capitol Complex facilities and grounds. Source: Appropriate funds from the General Fund. Distribution: Distribute funds through the Architect of the Capitol’s existing administrative processes. Prioritization: Prioritize funds on projects that are ready to go to construction and can be underway within 90 days. Shovel-Ready Deadlines: Require the Architect of the Capitol to award contracts for projects totaling at least $10 million (50 percent) of these funds within 90 days of the date of enactment. Require the Architect of the Capitol to award contracts for all of the funding within one year of the date of enactment. Economic Impact: Create more than 550 jobs and $99 million of economic activity.
  • 28. Page 28 ECONOMIC DEVELOPMENT ADMINISTRATION – $400 MILLION Infrastructure Needs: The Economic Development Administration (“EDA”) is uniquely positioned to provide effective and timely job creation and economic development assistance to economically distressed communities. EDA assistance is available to rural and urban areas of the nation experiencing high unemployment, low income, or other severe economic distress. EDA provides grants to construct and rehabilitate essential public infrastructure and facilities necessary to generate or retain long-term private sector jobs and investments, attract private sector capital, and promote regional competitiveness. Typical projects include investments in facilities such as water and sewer systems, industrial access roads, industrial and business parks, port facilities, distance learning facilities, skill-training facilities, business incubator facilities, brownfield redevelopment, eco-industrial facilities, and telecommunications and broadband infrastructure improvements necessary for business creation, retention, and expansion. Ready-to-Go Projects: EDA’s local partners have a significant backlog of ready-to-go economic development projects that have been stalled because of a lack of funds. According to the National Association of Development Organizations, an informal survey of a small sample of its members identified more than 200 projects with a total Federal cost of $885 million that are ready to go to construction if additional funding is made available. These projects would leverage an estimated $3 billion in private investment. Proposal: Provide $400 million for the Economic Development Administration. Source: Appropriate funds from the General Fund. Distribution: Distribute funds to local partners through EDA’s existing project selection processes. Some of these funds should be specifically focused on addressing sudden and severe economic dislocation caused by the downturn in U.S. automotive manufacturing. Prioritization: Prioritize funds on projects that are ready to go to construction and can be underway within 90 days. Shovel-Ready Deadlines: Require EDA grant recipients to award contracts for projects totaling at least $100 million (25 percent) of these funds within 90 days of the date of grant receipt. Require EDA to award contracts for projects totaling at least $200 million (50 percent) of these funds within one year and award contracts for all of the funding within two years of the date of enactment. Economic Impact: Create approximately 11,000 jobs and $2 billion of economic activity.
  • 29. Page 29 MARITIME TRANSPORTATION GREAT LAKES ICEBREAKER – $153 MILLION Infrastructure Needs: Additional icebreaking capacity is needed on the Great Lakes to provide for safe navigation of ships supplying iron ore and other raw materials to U.S. heavy industries. During the winter months, commercial ships transport more than $2 billion worth of materials to U.S. industries. Ready-to-Go Project: This proposal would fund construction of a sister icebreaker to the MACKINAW. The Coast Guard has an existing contract with the shipyard that built the MACKINAW. If funds are made available to construct another Great Lakes icebreaker, the shipyard is expected to hire 50 workers within 30 days to begin construction. An additional Great Lakes icebreaker would enable the Coast Guard to reassign the buoy tender ALDER, which currently operates in the Great Lakes, to meet other buoy tending needs in the United States. Proposal: Provide $153 million for a Coast Guard Great Lakes Icebreaker. Source: Appropriate funds from the General Fund. Distribution: Distribute funds through the Coast Guard’s existing administrative processes. Prioritization: Prioritize funds on projects that are ready to go to construction and can be underway within 90 days. Economic Impact: Create more than 4,250 jobs (including 150-200 direct shipyard jobs) and $750 million of economic activity. Equal Opportunity: As a general rule, the Coast Guard is required to provide at least 10 percent ($15.3 million) of the amounts made available to DBEs, including minority- and women-owned businesses.
  • 30. Page 30 MARITIME TRANSPORTATION COAST GUARD SHORE FACILITIES – $100 MILLION Infrastructure Needs: The Coast Guard has a significant backlog of needed repairs for aging Coast Guard shore facilities, including personnel housing, air stations, sector offices, small boat stations, and the dormitory at the Coast Guard Academy. Ready-to-Go Projects: The Coast Guard has more than $1 billion in deferred facility repair and improvement projects. Many of these projects are ready to go to construction within 90 to 120 days if additional funding is made available. Proposal: Provide $100 million for the Coast Guard’s Acquisition, Construction, and Improvements program to fund ready-to-go Coast Guard shore facility repair projects. Source: Appropriate funds from the General Fund. Distribution: Distribute funds through the Coast Guard’s existing administrative processes. Prioritization: Prioritize funds on projects that are ready to go to construction and can be underway within 90 days. Shovel-Ready Deadlines: Require the Coast Guard to award contracts for projects totaling at least $50 million (50 percent) of these funds within 90 days of the date of enactment. Require the Coast Guard to award contracts for all of the funding within one year of the date of enactment. Economic Impact: Create approximately 2,780 jobs and $500 million of economic activity. Equal Opportunity: As a general rule, the Coast Guard is required to provide at least 10 percent ($10 million) of the amounts made available to DBEs, including minority- and women-owned businesses.
  • 31. Page 31 MARITIME TRANSPORTATION COAST GUARD BRIDGE ALTERATIONS – $481 MILLION Infrastructure Needs: The Coast Guard bridge alteration program provides Federal funding to remove or alter bridges that are a safety hazard to navigation and an unreasonable obstruction to navigation. This program is normally funded at approximately $15 million per year. Increasing funding for this program would help eliminate the $481 million backlog of unfunded projects and create jobs across the United States. Ready-to-Go Projects: The Coast Guard has 12 bridge alteration projects that are ready to go to construction within 90 to 120 days if additional funding is made available. Proposal: Provide $481 million for the Coast Guard's Alteration of Bridges program. Source: Appropriate funds from the General Fund. Distribution: Distribute funds through the Coast Guard’s existing administrative processes. Prioritization: Prioritize funds on projects that are ready to go and can be underway within 90 days. Shovel-Ready Deadlines: Require the Coast Guard to award contracts for projects totaling at least $120 million (25 percent) of these funds within 90 days of the date of enactment. Require the Coast Guard to award contracts for projects totaling at least $240 million (50 percent) of these funds within one year and award contracts for all of the funding within two years of the date of enactment. Economic Impact: Create approximately 13,380 jobs and $2.4 billion of economic activity. Equal Opportunity: As a general rule, the Coast Guard is required to provide at least 10 percent ($48.1 million) of the amounts made available to DBEs, including minority- and women-owned businesses.
  • 32. Page 32 MARITIME TRANSPORTATION SHORT SEA SHIPPING AND RENEWABLE ENERGY LOAN GUARANTEES – $45 MILLION Infrastructure Needs: Subtitle C of Title XI of the Energy Independence and Security Act of 2007 (P.L. 110-140) established within the Maritime Administration a program to identify and promote short sea shipping in the United States. Short sea shipping is the transportation of goods and passengers by water between U.S. ports. These projects can help eliminate truck traffic and reduce highway congestion. In addition, the Maritime Administration has a loan guarantee program for the construction of ocean renewable energy facilities (e.g., wind, wave, and tidal energy generators) along the U.S. coast. Proposal: 1. Provide $15 million to finance $300 million of Title XI loan guarantees under chapter 537 of Title 46, United States Code, for construction of short sea ships in U.S. shipyards; 2. Provide $15 million to finance $300 million of Title XI loan guarantees under chapter 537 of Title 46 for construction of shore-side terminals and the purchase of equipment necessary to accommodate short sea shipping; and 3. Provide $15 million to finance $300 million of Title XI loan guarantees under chapter 537 of Title 46 for the ocean renewable energy program administered by the Maritime Administration. Source: Appropriate funds from the General Fund. Distribution: Distribute funds for loan guarantees through the Maritime Administration’s existing administrative processes. Prioritization: Prioritize funds on projects that are ready to go to construction and can be underway within 90 days. Economic Impact: The $900 million of Federal loan guarantees creates more than 25,000 jobs and $4.46 billion of economic activity. Equal Opportunity: Maritime Administration contracts require contractors to maximize the use of small and minority subcontractors.
  • 33. Page 33 MARITIME TRANSPORTATION JOB CREATION AND TRAINING – $10 MILLION Job Creation and Training Needs: The U.S. maritime industry is currently experiencing a shortage of trained workers, particularly in the offshore energy and towing vessel industry. This Maritime Administration program would fund educational loans for individuals seeking to attend Coast Guard-approved maritime training courses (both entry-level courses and training to upgrade licenses). Under the program, a student may receive up to $15,000 per year with a lifetime limit of $60,000 in low-interest loans. Statutory authorization is required for this program. Proposal: Provide $10 million to the Maritime Administration for a maritime educational loan program. This funding will provide loans to more than 2,000 students for maritime education and training programs. Source: Appropriate funds from the General Fund. Distribution: Distribute funds for educational loans through the Maritime Administration’s administrative processes. Equal Opportunity: These schools are prohibited from discriminating in their admission policies.
  • 34. Page 34 SAINT LAWRENCE SEAWAY DEVELOPMENT CORPORATION – $45 MILLION Infrastructure Needs: Maritime commerce on the Great Lakes Seaway System affects 150,000 jobs and provides $9 million per day in business revenues for firms engaging in trade in the U.S. Without renewed capital investment in the assets of the St. Lawrence Seaway, the reliability and availability of the Seaway, and access to the communities and economies of the Great Lakes and Midwestern regions, is in jeopardy. The Saint Lawrence Seaway Development Corporation (“SLSDC”) has developed a ten-year U.S. Asset Renewal Program (“ARP”) Capital Investment Plan (“CIP”) for navigation infrastructure and facilities. The objectives of ARP/CIP include: lock operation upgrade and maintenance, waterway management, tunnel and bridge maintenance and facility upgrade and maintenance. The ten-year asset renewal program consists of 50 projects ranging in cost from $200,000 for upgrading and replacing fire alarm protection systems, to $13.6 million for replacing the deck of the Seaway International Bridge. The total cost of the ten-year asset renewal program is $164.6 million, which is authorized pursuant to section 5015 of the Water Resources Development Act of 2007 (P.L. 110- 114). Projects scheduled to begin in years 1 and 2 of ARP are currently ready for implementation and construction. These projects include $5 million for installation of an ice flushing system in the Snell Lock and $3 million for rehabilitation of downstream miter gates at both the Snell and Eisenhower locks. In addition, other projects ready for implementation include $3 million for completion of the deck replacement of the Seaway International Bridge. Work on these projects will be done by contractors, by SLSDC staff, or by a combination of contractors and SLSDC staff. Ready-to-Go Projects: Section 5015 of the Water Resources Development Act of 2007 authorizes the SLSDC to undertake a ten-year asset renewal program. The SLSDC has identified $45 million in projects that are ready to go to construction within the larger asset renewal program. Proposal: Provide $45 million to begin the SLSDC’s ten-year asset renewal program. Source: Appropriate funds from the Harbor Maintenance Trust Fund and the general fund of the United States. Distribution: Distribute funds pursuant to section 210 of the Water Resources Development Act of 1986 (33 U.S.C. 2238) Prioritization: Prioritize funds on projects that are ready to go to construction and can be underway within 90 days. Shovel-Ready Deadlines: Require SLSDC to award contracts for projects totaling at least $11.25 million (25 percent) of these funds within 90 days of the date of enactment. Require SLSDC to award contracts for projects totaling at least $22.5 million (50 percent) of these funds within one year and award contracts for all of the funding within two years of the date of enactment. Economic Impact: Create approximately 1,250 jobs and $223 million of economic activity.
  • 35. Table A Results of December 2008 AASHTO Survey of Ready-to-Go Highway & Bridge Projects State Number of Projects Dollar Value (in Millions) Alabama 16 $877.0 Alaska 4 $139.3 Arizona 72 $1,091.5 Arkansas 130 $1,120.5 California $5,000.0 Colorado 113 $1,154.0 Connecticut 5 $764.7 Delaware $125.0 District of Columbia 3 $56.0 Florida 92 $6,968.3 Georgia 319 $1,932.9 Hawaii 51 $417.9 Idaho 126 $805.0 Illinois 245 $783.3 Indiana 109 $501.2 Iowa 41 $221.2 Kansas 107 $357.0 Kentucky 50 $400.0 Louisiana 58 $423.0 Maine 44 $221.0 Maryland $230.0 Massachusetts 37 $220.0 Michigan 208 $1,750.0 Minnesota 200 $950.0 Mississippi 75 $600.0 Missouri 34 $510.0 Montana 158 $350.0 Nebraska 30 $250.0 Nevada 40 $250.0 New Hampshire 27 $230.5 New Jersey 153 $1,640.0 New Mexico 49 $1,136.1 New York 40 $550.0 North Carolina 296 $5,170.0 North Dakota $300.0 Ohio $2,160.0 Oklahoma 95 $778.0 Oregon 105 $564.0 Pennsylvania 319 $1,030.0 Rhode Island 40 $100.0 South Carolina 51 $850.0 South Dakota 29 $155.0 Tennessee 120 $400.0 Texas 853 $6,018.4 Utah 136 $10,800.0 Vermont 22 $94.7 Virginia 40 $680.4 Washington 60 $1,339.0 West Virginia 181 $1,134.4 Wisconsin 60 $320.0 Wyoming 105 $400.3 Total $64,319.6 5,148