Global Medical Cures™| New York Arthritis Prevalence
•
1 gefällt mir•534 views

Global Medical Cures™| New York Arthritis Prevalence DISCLAIMER- Global Medical Cures™ does not offer any medical advice, diagnosis, treatment or recommendations. Only your healthcare provider/physician can offer you information and recommendations for you to decide about your healthcare choices.

Empfohlen
Empfohlen
Weitere ähnliche Inhalte
Was ist angesagt?
Was ist angesagt? (20)
Andere mochten auch
Andere mochten auch (18)
Ähnlich wie Global Medical Cures™| New York Arthritis Prevalence
Ähnlich wie Global Medical Cures™| New York Arthritis Prevalence (20)
Mehr von Global Medical Cures™
Mehr von Global Medical Cures™ (20)
Kürzlich hochgeladen
Kürzlich hochgeladen (20)
Global Medical Cures™| New York Arthritis Prevalence
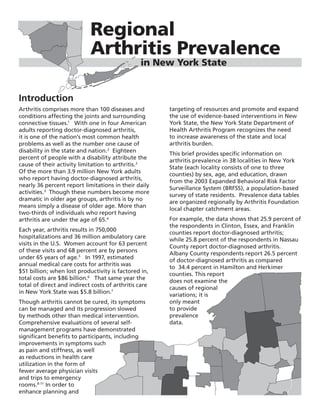
- 1. Introduction Arthritis comprises more than 100 diseases and conditions affecting the joints and surrounding connective tissues.1 With one in four American adults reporting doctor-diagnosed arthritis, it is one of the nation’s most common health problems as well as the number one cause of disability in the state and nation.2 Eighteen percent of people with a disability attribute the cause of their activity limitation to arthritis.2 Of the more than 3.9 million New York adults who report having doctor-diagnosed arthritis, nearly 36 percent report limitations in their daily activities.3 Though these numbers become more dramatic in older age groups, arthritis is by no means simply a disease of older age. More than two-thirds of individuals who report having arthritis are under the age of 65.4 Each year, arthritis results in 750,000 hospitalizations and 36 million ambulatory care visits in the U.S. Women account for 63 percent of these visits and 68 percent are by persons under 65 years of age.5 In 1997, estimated annual medical care costs for arthritis was $51 billion; when lost productivity is factored in, total costs are $86 billion.6 That same year the total of direct and indirect costs of arthritis care in New York State was $5.8 billion.7 Though arthritis cannot be cured, its symptoms can be managed and its progression slowed by methods other than medical intervention. Comprehensive evaluations of several self- management programs have demonstrated significant benefits to participants, including improvements in symptoms such as pain and stiffness, as well as reductions in health care utilization in the form of fewer average physician visits and trips to emergency rooms.8-11 In order to enhance planning and targeting of resources and promote and expand the use of evidence-based interventions in New York State, the New York State Department of Health Arthritis Program recognizes the need to increase awareness of the state and local arthritis burden. This brief provides specific information on arthritis prevalence in 38 localities in New York State (each locality consists of one to three counties) by sex, age, and education, drawn from the 2003 Expanded Behavioral Risk Factor Surveillance System (BRFSS), a population-based survey of state residents. Prevalence data tables are organized regionally by Arthritis Foundation local chapter catchment areas. For example, the data shows that 25.9 percent of the respondents in Clinton, Essex, and Franklin counties report doctor-diagnosed arthritis; while 25.8 percent of the respondents in Nassau County report doctor-diagnosed arthritis. Albany County respondents report 26.5 percent of doctor-diagnosed arthritis as compared to 34.4 percent in Hamilton and Herkimer counties. This report does not examine the causes of regional variations; it is only meant to provide prevalence data. Regional Arthritis Prevalence in New York State
- 2. effort, more than 7,000 people have been reached in New York State. This is in addition to the people that are normally reached by the Arthritis Foundation chapters. The Arthritis Program has worked closely with the chapters to seamlessly implement and coordinate program activities as needed. Much like the national goal of Healthy People 2010, the mission of the Arthritis Program is to maximize the quality of life for New Yorkers who suffer from arthritis and related diseases. This can be accomplished in a variety of ways: decreasing limitations experienced by people with arthritis, decreasing pain associated with arthritis, and increasing the number of people who have participated in evidence- based arthritis interventions. Currently, a new focus of partnering with health systems and networks will allow for the introduction of the evidence-based programs to a wider audience, reaching more individuals with arthritis or possible arthritis. Broome % ± CI 32.5 4.0 25.7 5.7 38.6 5.5 14.1 4.6 43.1 7.6 60.7 8.4 39.8 6.5 25.9 7.1 29.1 7.0 Table 1. Prevalencea of doctor-diagnosed arthritis among adult New Yorkers, by demographic characteristic and Expanded BRFSS locality: New York Arthritis Foundation Chapter catchment area Characteristic Locality (includes one to two counties) Dutchess, Westchester Rockland Orange Putnam Ulster Bronx % ± CIb % ± CI % ± CI % ± CI % ± CI % ± CI Total 23.0 3.7 26.1 3.7 23.4 3.6 23.4 3.7 30.9 4.2 20.7 3.7 Sex Male 17.3 5.0 20.1 5.2 16.0 4.6 19.5 5.3 25.7 5.7 14.9 5.8 Female 28.0 5.2 31.7 5.1 30.7 5.1 27.3 4.9 36.1 6.0 25.5 4.7 Age (yrs) 18-44 8.3 3.4 11.8 3.9 9.5 3.5 9.2 3.5 16.9 6.2 7.5 3.3 45-64 32.3 7.9 34.1 7.1 35.7 7.2 35.9 7.1 37.4 6.7 36.2 7.9 65+ 46.4 9.2 56.1 9.6 51.4 9.7 44.3 10.4 56.7 9.6 44.6 12.7 Education ≤ H.S./GED 23.7 7.0 24.5 7.1 30.3 5.8 30.2 7.0 33.0 7.3 25.4 5.5 Some college 20.3 7.7 23.9 7.5 20.6 6.8 18.2 5.9 27.9 7.3 14.6 7.0 College grad 23.8 5.3 26.3 5.3 15.8 5.4 20.7 5.6 31.0 6.8 15.4 6.2 a Prevalence rate is the total number of cases of a disease in a population divided by the total population b CI, 95% confidence interval Table 2. Prevalencea of doctor-diagnosed arthritis among adult New Yorkers by demographic characteristic and Expanded BRFSS locality: Long Island Arthritis Foundation Chapter catchment area Characteristic Locality Suffolk Nassau % ± CIb % ± CI Total 23.6 3.5 25.8 3.9 Sex Male 18.3 5.0 20.2 5.6 Female 28.6 4.9 30.8 5.3 Age (yrs) 18-44 11.8 3.8 9.2 3.7 45-64 26.9 6.7 29.0 7.2 65+ 56.8 9.8 56.1 9.6 Education ≤ H.S./GED 27.9 6.5 34.2 8.4 Some college 23.9 6.8 20.6 7.1 College grad 19.5 5.2 24.0 5.3 a Prevalence rate is the total number of cases of a disease in a population divided by the total population b CI, 95% confidence interval
- 3. CHAUTAUQUA CATTARAUGUS ERIE WYOMING NIAGARA ORLEANS GENESEE MONROE WAYNE ONTARIO ALLEGANY STEUBEN SCHUYLER CHEMUNG CAYUGA OSWEGO ONONDAGA TOMPKINS CORTLAND CHENANGO MADISON ONEIDA LEWIS JEFFERSON ST. LAWRENCE FRANKLIN CLINTON HERKIMER HAMILTON ESSEX WARREN SARATOGA WASHINGTON RENSSELAER ALBANY FULTON MONTGOMERY OTSEGO SCHOHARIE COLUMBIAGREENE DELAWARE SULLIVAN ORANGE ULSTER DUTCHESS PUTNAM ROCKLAND WESTCHESTER SUFFOLK NASSAU BRONX KINGS NEW YORK QUEENS RICHMOND TIOGA BROOME LIVINGSTON SCHENECTADY YATES SENECA 20.0 to 24.9 25.0 to 29.9 30.0 to 34.9 35.0 to 39.9 *Note: Broken lines represent county borders within multi-county localities Source of Data Expanded Behavioral Risk Factor Surveillance System The Expanded Behavioral Risk Factor Surveillance System project was conducted from July 2002 through July 2003 to assess local level prevalence of behavioral risk factors and utilization of preventive care services related to the leading causes of illness, injury, and death. The information from the Expanded BRFSS is intended for use by local health departments and others for needs assessment, health program planning and evaluation, policy formulation, and monitoring progress toward established health goals and objectives. The Expanded BRFSS followed the protocol established by the Centers for Disease Control and Prevention (CDC) for the annual New York State BRFSS. Random-digit-dialing telephone interviewing procedures were used to survey adults aged 18 years and older in localities across the entire state. The composition of the 38 localities was determined in consultation with the New York State Association of County Health Officers (NYSACHO). Counties with sparser populations were grouped with neighboring counties in order to increase the pool of potential respondents. The Expanded BRFSS questionnaire was constructed of standard BRFSS items and modules developed by the CDC. Questionnaire development began with the selection of a common set of core items and modules. Representatives from each county and from program areas within the New York State Department of Health (NYSDOH) prioritized topics to constitute the questionnaire core. Each locality was then allowed to select optional items and modules of particular interest to their respective area to complete the balance of their specific questionnaires. In localities opting not to select optional questionnaire items, a “standard” questionnaire developed by the NYSDOH was administered. In the Expanded BRFSS survey, doctor-diagnosed arthritis was assessed by a response of “yes” to the following question: “Have you ever been told by a doctor or other health professional that you have some form of arthritis, rheumatoid arthritis, gout, lupus, or fibromyalgia?” Sullivan, Kings New York Richmond Queens % ± CI % ± CI % ± CI % ± CI 24.1 3.9 22.0 3.8 26.5 3.9 22.5 3.9 22.3 6.5 17.4 5.2 21.8 5.6 17.2 5.5 25.6 4.7 26.0 5. 30.8 5.4 27.2 5.4 9.1 3.3 7.3 3.2 10.3 3.8 8.4 4.1 35.5 7.9 30.8 7.8 42.0 7.7 33.4 8.1 57.3 12.6 60.0 10.0 51.0 10.9 51.2 10.6 27.4 6.0 30.2 8.6 31.1 6.6 23.6 6.3 23.4 8.8 19.8 8.3 22.2 7.3 21.8 8.3 19.6 6.3 18.1 4.5 24.5 6.6 20.2 5.6 Map Arthritis prevalence by locality (weighted percentage of adults with doctor-diagnosed arthritis) Table 5. Prevalencea of doctor-diagnosed arthritis among adult New Yorkers, by demographic characteristic and Expanded BRFSS locality: Upstate New York Arthritis Foundation Chapter: Central New York Branch catchment area Characteristic Locality (includes one to three counties) Jefferson, Hamilton, Lewis, Oneida, Madison, Tompkins, Herkimer St. Lawrence Oswego Chenango Onondaga Cortland % ± CIb % ± CI % ± CI % ± CI % ± CI % ± CI Total 34.4 4.3 35.4 4.4 32.8 4.0 30.1 3.8 29.0 3.8 23.9 3.8 Sex Male 30.3 6.5 35.3 7.0 28.3 6.1 26.3 5.7 26.5 6.0 18.4 5.0 Female 38.3 5.6 35.6 5.4 37.2 5.1 33.7 5.0 31.3 4.9 29.0 5.4 Age (yrs) 18-44 16.0 5.5 15.6 4.9 15.9 4.4 10.9 3.7 11.7 4.4 12.5 4.7 45-64 42.9 7.3 54.0 7.8 41.8 7.4 41.7 7.0 38.4 6.9 33.2 6.7 65+ 57.7 8.8 65.2 9.3 62.9 8.4 59.6 8.6 55.9 9.2 56.3 10.1 Education ≤ H.S./GED 38.5 6.2 39.5 6.4 36.7 6.0 31.7 5.4 36.4 6.9 38.0 7.9 Some college 31.1 7.8 32.4 7.9 34.4 7.6 29.0 7.1 29.9 7.3 15.6 5.9 College grad 30.4 8.9 29.5 9.6 22.1 7.2 28.8 8.1 22.2 5.8 18.7 4.8 a Prevalence rate is the total number of cases of a disease in a population divided by the total population b CI, 95% confidence interval Table 6. Prevalencea of doctor-diagnosed arthritis among adult New Yorkers, by demographic characteristic and Expanded BRFSS locality: Southern New England Arthritis Foundation Chapter: Northern New England Branch catchment area Characteristic Locality (includes three counties) Clinton, Franklin, Essex % ± CIb Total 25.9 3.7 Sex Male 21.0 5.2 Female 31.5 5.1 Age (yrs) 18-44 10.0 3.6 45-64 33.1 7.0 65+ 61.5 8.6 Education ≤ H.S./GED 27.2 5.5 Some college 23.4 6.8 College grad 26.4 7.2 a Prevalence rate is the total number of cases of a disease in a population divided by the total population b CI, 95% confidence interval
- 4. Table 3. Prevalencea of doctor-diagnosed arthritis among adult New Yorkers by demographic characteristic and Expanded BRFSS locality: Northeastern New York Arthritis Foundation Chapter catchment area Characteristic Locality (includes one to three counties) Schoharie, Columbia, Warren, Hamilton, Fulton, Delaware, Greene Albany Rensselaer Schenectady Saratoga Washington Herkimer Montgomery Otsego % ± CIb % ± CI % ± CI % ± CI % ± CI % ± CI % ± CI % ± CI % ± CI Total 32.9 4.1 26.5 3.7 33.9 4.1 29.7 3.8 28.7 3.9 28.7 3.8 34.4 4.3 36.5 4.2 31.6 4.1 Sex Male 27.4 5.9 21.4 5.3 30.8 6.2 21.2 5.3 26.9 6.3 23.3 5.4 30.3 6.5 32.4 6.4 31.9 6.5 Female 38.4 5.5 31.0 5.2 36.9 5.3 37.3 5.2 30.4 4.7 34.0 5.1 38.3 5.6 40.2 5.5 31.2 5.1 Age (yrs 18-44 9.6 3.8 8.1 3.2 16.7 4.8 15.4 4.4 14.4 4.6 11.8 4.3 16.0 5.5 18.7 5.1 15.5 5.5 45-64 44.0 6.6 36.2 7.0 43.5 7.7 31.7 7.1 34.4 7.1 36.5 6.7 42.9 7.3 48.8 7.9 38.2 6.7 65+ 56.0 9.3 55.8 9.6 64.8 8.6 57.4 8.2 62.5 9.7 56.9 9.0 57.7 8.8 55.6 8.6 56.8 8.4 Education ≤ H.S./GED 37.6 6.3 35.4 7.7 41.4 6.8 37.3 6.8 32.9 7.0 26.6 5.2 38.5 6.2 41.6 5.9 32.5 6.0 Some college 31.9 7.9 29.9 8.1 34.8 7.9 33.0 7.6 29.9 7.3 31.8 7.8 31.1 7.8 32.5 7.4 38.6 8.9 College grad 26.2 7.0 19.3 4.7 23.4 6.2 19.1 5.1 24.1 6.2 29.6 7.7 30.4 8.9 28.4 10.4 23.7 6.7 a Prevalence rate is the total number of cases of a disease in a population divided by the total population b CI, 95% confidence interval Table 4. Prevalencea of doctor-diagnosed arthritis among adult New Yorkers, by demographic characteristic and Expanded BRFSS locality: Upstate New York Arthritis Foundation Chapter catchment area Characteristic Locality (includes one to three counties) Chemung, Seneca, Schuyler, Wayne, Steuben, Ontario, Allegany, Genesee, Cattaraugus, Tioga Cayuga Yates Monroe Livingston Wyoming Orlean Erie Niagara Chautauqua % ± CIb % ± CI % ± CI % ± CI % ± CI % ± CI % ± CI % ± CI % ± CI % ± CI Total 28.4 3.8 31.3 4.0 32.9 4.1 30.8 4.0 28.7 3.8 29.2 3.8 32.8 4.1 33.0 4.1 32.8 4.0 29.5 3.9 Sex Male 24.5 5.7 27.4 5.9 28.6 6.4 26.5 5.9 27.2 5.7 25.8 5.7 29.3 6.1 29.6 6.3 29.3 5.8 22.8 5.7 Female 32.0 5.0 35.3 5.3 36.9 5.2 34.8 5.2 30.1 5.2 32.8 5.0 36.1 5.3 36.0 5.3 36.0 5.4 35.8 5.1 Age (yrs) 18-44 11.7 3.9 15.6 4.9 14.2 5.5 14.2 4.5 14.1 4.5 14.3 4.4 14.1 4.4 15.1 5.1 14.6 4.6 14.4 4.7 45-64 37.7 7.1 36.9 7.3 40.9 7.2 43.6 7.7 37.5 6.8 40.5 7.2 45.8 7.5 38.2 7.3 40.2 7.2 36.7 7.1 65+ 52.9 9.4 63.5 8.0 60.8 9.0 55.8 9.7 55.4 9.8 52.6 9.3 57.6 8.9 65.7 8.5 66.1 7.7 53.7 8.4 Education ≤ H.S./GED 32.0 5.6 39.3 6.3 34.9 5.6 42.1 7.5 36.0 6.4 31.0 5.3 32.3 5.7 40.5 6.8 39.8 6.3 30.2 5.4 Some college 24.9 6.8 24.5 7.1 30.6 8.5 31.2 7.8 22.2 6.6 29.1 7.2 34.7 8.0 33.9 7.9 24.7 6.4 30.3 7.9 College grad 24.9 7.7 23.7 7.2 32.1 8.4 22.3 5.6 25.5 6.8 24.1 8.5 30.4 8.6 22.6 6.2 29.6 7.9 27.2 7.6 a Prevalence rate is the total number of cases of a disease in a population divided by the total population b CI, 95% confidence interval Arthritis Interventions in New York State Working in partnership with the four New York Arthritis Foundation chapters, the New York State Office for the Aging, The State University of New York at Albany School of Social Welfare, the New York State Department of Health Disability and Health Program, and others, the New York State Department of Health Arthritis Program incorporates arthritis messages into chronic disease prevention, health promotion, and education programs. The program promotes effective interventions to manage the disease and, at the same time, reduce the limitations of activities experienced by those living with arthritis and other rheumatic conditions. The program targets proven interventions into underserved areas of New York. This is all done in accordance with the New York State Arthritis Plan (http://www.health.state.ny.us/diseases/ conditions/arthritis/arthritis_act_index.htm), which provides a comprehensive framework for addressing arthritis in New York. The effective arthritis interventions consist of five evidence-based programs: two Self- Management and Education programs (the Arthritis Foundation Self Help Program and the Chronic Disease Self-Management Program) and three Physical Activity Programs (the Arthritis Foundation Exercise Program, the Arthritis Foundation Aquatic Program, and EnhanceFitness). Self-management education programs teach people with arthritis how to manage arthritis on a day-to-day basis. Research has shown that appropriate physical activity offers substantial benefits to people with arthritis and can decrease pain and disability. The State Health Department’s Arthritis Program, charged with providing arthritis interventions, has offered approximately 38 programs reaching over 400 individuals through the state. Part of the success of the Arthritis Program is the capacity to train more than 206 program leaders and instructors. Since 2004, the New York Arthritis Foundation chapters have received state funding to enhance and expand programs and services to those affected by arthritis. Due to the success of the
- 5. Notes 1 Arthritis Foundation, Association of State and Territorial Health Officials, Centers for Disease Control and Prevention. National Arthritis Action Plan: A Public Health Strategy. Atlanta, GA. Arthritis Foundation, 1999. 2 CDC. State prevalence of self-reported doctor- diagnosed arthritis and arthritis-attributable activity limitation - United States, 2003. MMWR 2006; 55:477-81. 3 New York State Behavioral Risk Factor Surveillance System. 2004. 4 Bolen J, Sniezek J, Theis K, Helmick CM, Hootman J, Brady T, Langmaid G. Racial and ethnic differences in the prevalence and impact of doctor-diagnosed arthritis. MMWR 2005; 54:119-123. 5 Impact of arthritis and other rheumatic conditions on the health care system – United States. 1997. MMWR 1999; 48:349-53. 6 Dunlop DD, Manheim LM, Yelin EH, Song J, Chang RW. The costs of arthritis. Arthritis Rheum 2003; 15:101-3. 7 CDC. Direct and indirect costs of arthritis and other rheumatic conditions – United States. 1997. MMWR 2004, 53; 388-89. 8 Lorig K & Holman H. (1993). Arthritis self- management studies. Health Educ, 19:17-28. 9 Doyle MA, Farrar V, Ryan S & Sisola S. (1990). An evaluation of PACE. Arthritis Care Res, 3(2): S7. 10 Arthritis Foundation. (1987). Arthritis Foundation Aquatics Program Evaluation. Atlanta, GA: Arthritis Foundation. 11 Lorig KR, Sobel DS, Stewart AL, Brown BW, Bandura A, & Ritter P. (1999). Evidence suggesting that a chronic disease self- management program can improve health status while reducing hospitalization: a randomized trial. Medical Care, 37:5–14. New York State Department of Health Arthritis Program 518-408-5142 arth@health.state.ny.us State of New York Eliot Spitzer, Governor Department of Health Richard F. Daines, M.D., Commissioner