SlideShare ist ein Scribd-Unternehmen logo
1 von 18
Downloaden Sie, um offline zu lesen
PROJECTING FUTURE DRUG EXPENDITURES	 SPECIAL FEATURE
	 AM J HEALTH-SYST PHARM | VOLUME 73 | 2016  e357
National trends in prescription drug expenditures
and projections for 2016
Glen T. Schumock, Pharm.D., M.B.A.,
Ph.D., FCCP, Department of Pharmacy
Systems, Outcomes and Policy, College
of Pharmacy, University of Illinois at
Chicago, Chicago, IL.
Edward C. Li, Pharm.D., M.P.H.,
BCOP, Department of Pharmacy
Practice, College of Pharmacy, University
of New England, Portland, ME.
Katie J. Suda, Pharm.D., M.S.,
Department of Veterans Affairs, Center
of Innovation for Complex Chronic
Healthcare, Edwards Hines Jr. VA
Hospital, Hines, IL, and Department
of Pharmacy Systems, Outcomes and
Policy, College of Pharmacy, University of
Illinois at Chicago, Chicago, IL.
Michelle D. Wiest, Pharm.D., BCPS,
FASHP, UC Health, Cincinnati, OH, and
James L. Winkle College of Pharmacy,
University of Cincinnati, Cincinnati, OH.
JoAnn Stubbings, B.S.Pharm.,
M.H.C.A., Department of Pharmacy
Systems, Outcomes and Policy, College
of Pharmacy, University of Illinois at
Chicago, Chicago, IL.
Linda M. Matusiak, B.A., IMS Health,
Plymouth Meeting, PA.
Robert J. Hunkler, M.B.A., IMS Health,
Plymouth Meeting, PA.
Lee C. Vermeulen, B.S.Pharm.,
M.S., FCCP, FFIP, Center for Clinical
Knowledge Management, UW Health,
Madison, WI, and School of Pharmacy,
University of Wisconsin, Madison, WI.
Address correspondence to Dr. Schumock
(schumock@uic.edu).
This article will appear in the July 15,
2016, issue of AJHP.
DOI 10.2146/ajhp160205
Supplementary material is available with the
full text of this article at www.ajhp.org.
Purpose. Historical trends and factors likely to influence future pharmaceu-
tical expenditures are discussed, and projections are made for drug spend-
ing in 2016 in nonfederal hospitals, clinics, and overall (all sectors).
Methods. Drug expenditure data through calendar year 2015 were obtained
from the IMS Health National Sales Perspectives database and analyzed.
Other factors that may influence drug spending in hospitals and clinics in
2016, including new drug approvals and patent expirations, were also re-
viewed. Expenditure projections for 2016 were based on a combination of
quantitative analyses and expert opinion.
Results. Total U.S. prescription sales in the 2015 calendar year were $419.4
billion, which was 11.7% higher than sales in 2014. Prescription expendi-
tures in clinics and nonfederal hospitals totaled $56.7 billion (a 15.9% in-
crease) and $33.6 billion (a 10.7% increase), respectively, in 2015. In nonfed-
eral hospitals, growth in spending was driven primarily by increased prices
for existing drugs. The hepatitis C combination drug ledipasvir–sofosbuvir
was the top drug overall in terms of 2015 expenditures ($14.3 billion); in
both clinics and nonfederal hospitals, infliximab was the top drug. Individual
drugs with the greatest increases in expenditures in 2015 were specialty
agents and older generics; these agents are likely to continue to influence
total spending in 2016.
Conclusion. We project an 11–13% increase in total drug expenditures
overall in 2016, with a 15–17% increase in clinic spending and a 10–12%
increase in hospital spending. Health-system pharmacy leaders should care-
fully examine local drug utilization patterns in projecting their own organiza-
tion’s drug spending in 2016.
Am J Health-Syst Pharm. 2016; 73:e357-73
Recent data show that healthcare
spending in the United States in-
creased at a faster pace in 2014 than
previously. While total spending in-
creased 2.9% in 2013, it increased 5.3%
in 2014 to a total of $3.03 trillion, or
17.5% of the U.S. gross domestic prod-
uct.1
Total healthcare expenditures in
2015 are estimated to have been $3.23
trillion, a 5.3% increase from 2014.2
This growth rate was partially attribut-
able to economic recovery and partly
due to increased healthcare coverage
resulting from the Affordable Care Act
(ACA). Nevertheless, at $3.23 trillion
annually, the United States outspends
all other countries on healthcare.
Pharmaceuticals have generally
been viewed as a reasonable invest-
ment because of the potentially large
impact on clinical outcomes and the
relatively small amount spent on drugs
as a percentage of total healthcare
expenditures. While the high rate of
growth in pharmaceutical spending in
the 1990s and early 2000s was a chal-
lenge for pharmacy and health-system
leaders, its moderation over the past
decade—largely driven by patent expi-
rationsandtheincreaseduseofgeneric
medications—led to somewhat dimin-
ished scrutiny of drug costs. However,
recently there has been a dramatic
shift, and high drug costs are now a top
An audio interview that
supplements the informa-
tion in this article is avail-
able on AJHP’s website at
www.ajhpvoices.org. Read-
ers can also access this
interview through AJHP’s augmented reality
(AR) feature by launching the Layar app and
scanning this page with their mobile device.
SPECIAL FEATURE	 PROJECTING FUTURE DRUG EXPENDITURES
e358    AM J HEALTH-SYST PHARM | VOLUME 73 | 2016
to those used in previous years.10,11
We examined both historical trends
in drug expenditures and expected
changes in the drug marketplace that
may influence drug expenditures in
nonfederal hospitals and clinics, in-
cluding anticipated new drug approv-
als and patent expirations. Data for the
analysis of historical trends in expen-
ditures were obtained from the IMS
Health National Sales Perspectives
(NSP) database; data coverage extend-
ed through December 31, 2015 (i.e.,
the most recent available data were
used).12
NSP data are derived from a
statistically valid audit that projects
100% of the purchases in every major
class of trade and distribution chan-
nel for prescription pharmaceuticals,
nonprescription products, and select
self-administered diagnostic prod-
ucts in the United States, measuring
both unit volume and invoice dollars.
The NSP database has been described
KEY POINTS
•	 Total prescription sales in the
United States in the 2015 cal-
endar year were $419.4 billion,
which was 11.7% higher than
sales in 2014.
•	 Prescription expenditures in
nonfederal hospitals in 2015
totaled $33.6 billion (a 10.7%
increase from 2014), driven
primarily by price increases for
existing drugs.
•	 We project that overall pre-
scription drug spending will
rise by 11–13% in 2016, with
increases in the clinic and
hospital settings of 15–17%
and 10–12%, respectively.
•	 Health-system pharmacists
should carefully consider the
mix of medications used in
their own institution when
forecasting drug expenditures
for budgetary purposes.
concern not just of pharmacists but of
the media and the public as well.
This was perhaps best illustrated by
the case of pyrimethamine (Daraprim).
Turing Pharmaceuticals acquired the
exclusive marketing rights to pyri-
methamine in August 2015 and then
raised the price by over 5,000%—from
$13.50 to $750 per tablet.3
The public
outcry, which included street protests,
was inflamed by the brash comments
of Turing’s then chief executive offi-
cer, Martin Shkreli.4
In fact, pyrimeth-
amine is just one of many older drug
products that have been subject to
huge price increases that typically oc-
cur after manufacturer consolidation,
drug shortages, or other situations that
limit competition. These drugs then
become targets for predatory pricing
practices, and companies such asVale-
ant Pharmaceuticals have apparently
pursued this as a business model.5
However, the media and consumer
outcry has not been isolated to older
drugs.3,6
The $100,000-plus-per-year
price tags of new drugs for cancer and
hepatitis C infection have also raised
enormous concern and have even led
to physicians and policymakers weigh-
ing in on the matter.7-9
This article describes drug expen-
diture trends in 2015, reviews factors
likely to influence future drug expen-
ditures, and projects drug spending for
2016. Our intent is to provide informa-
tion to aid health-system pharmacists
and other healthcare leaders in deter-
mining how future clinical, regulatory
and fiscal changes will affect drug ex-
penditures in their own organizations.
We examine trends in pharmaceutical
expenditures, both generally and by
setting (with an emphasis on nonfeder-
al hospitals and clinics), that may help
predict expenditures in 2016. We also
examine other factors that may influ-
ence future pharmaceutical spending,
including new drugs and newly avail-
able generics. Finally, drug expenditure
growth for 2016 is predicted for non-
federal hospitals, clinics, and overall.
Methods
The methods used were similar
in detail in previous versions of this
forecast.10
All drug dosage forms were
included in the analysis (except where
noted), and drug class groupings were
based on IMS Health’s proprietary
Uniform System of Classification.13
For all drug expenditure data from
NSP, we reported total dollars spent
as well as growth, with the latter be-
ing the percentage change (increase
or decrease) in expenditures from the
previous 12 months. All of the analy-
ses in this article were based on full-
calendar-year data, which was not the
case in previous editions of this report.
Our historical analysis included data
on expenditures across all pharma-
ceutical distribution channels (e.g.,
retail, mail order).Within channels, we
categorized factors that drive changes
in pharmaceutical expenditures as
(1) new products, (2) price inflation,
and (3) volume and mix. Definitions
of these categories were provided in
a previous version of this report.10
We also examined the top medica-
tions based on expenditures, as well
as the medications with the greatest
growth in expenditures from the pre-
vious year. In these analyses, expen-
ditures for each drug were totaled for
all brand and generic products and for
the various dosage forms. Because the
primary focus of this forecast is drug
expenditures in nonfederal hospitals
and clinics, we analyzed trends in
these sectors in more detail.
We also conducted separate analy-
ses of selected drug classes thought
likely to significantly influence drug
spending in hospitals or clinics, includ-
ing antimicrobials, with special empha-
sis on drugs indicated for treatment of
hepatitis C virus (HCV) infection and
biosimilars. Antimicrobials were cat-
egorized, based on their spectrum of
activity, as antibacterials, antifungals,
and antivirals. Antivirals were further
stratified into antiretrovirals, non-hu-
man immunodeficiency virus (HIV)–
targeted agents (i.e., not including
those targeting HIV), and HCV antivi-
rals. HCV antiviral agents included rib-
avirin, interferon, telaprevir, simepre-
vir, sofosbuvir, boceprevir, daclatasvir,
PROJECTING FUTURE DRUG EXPENDITURES	 SPECIAL FEATURE
	 AM J HEALTH-SYST PHARM | VOLUME 73 | 2016  e359
ledipasvir–sofosbuvir, and ombitasvir–
paritaprevir–ritonavir (available with
or without dasaburvir). The analysis
of biosimilars included filgrastim, tbo-
filgrastim, and filgrastim-sndz. We as-
sessed the impact of tbo-filgrastim and
filgrastim-sndz on overall expenditures
and units of granulocyte colony-stimu-
lating factor (GCSF) products sold from
January 2014 through December 2015;
one unit was defined as 480 mg, with
the number of units sold calculated by
dividing the total quarterly expendi-
tures of a product by the corresponding
quarterly average sales price (ASP) for a
480-mg dose.
Drug approvals anticipated in
2016 were reviewed because they are
expected to contribute to increased
drug expenditures; the methods for
this analysis were similar to those
described in our 2015 report.11
Infor-
mation for new drug approvals was
obtained from company websites
and the Food and Drug Administra-
tion (FDA).14-33
Pharmaceuticals an-
ticipated to lose patent protection in
2016 and become available in generic
form were reviewed to understand the
potential for reducing drug expendi-
tures; these products were identified
from several sources, including FDA
and pharmaceutical company web-
sites and pharmaceutical and biotech-
nology business news sources.34-36
Ad-
ditionally, NSP data on generic drug
expenditure trends were analyzed.
Special emphasis was placed on ge-
neric products likely to have a signifi-
cant impact on expenditures for the
entire market and those of particular
importance in the hospital or clinic
setting.
Finally, we projected drug expen-
diture growth in 2016 for nonfed-
eral hospitals, clinics, and all settings
combined. These estimates were
generated through a combination of
quantitative and qualitative analyses
but should be viewed as opinions of
the authors made in consideration of
major factors believed to influence fu-
ture drug expenditures, as discussed
herein. Projections from other sourc-
es were also examined. These inputs
were evaluated by the authors, and
consensus opinion was reached as to
anticipated ranges for drug expendi-
ture growth in 2016.
Results
Historical trends in prescrip-
tion expenditures. Total prescrip-
tion expenditures in the United States
for the 2015 calendar year were $419.4
billion, which was 11.7% higher than
total expenditures in 2014. Table 1
shows drug spending in 2015 across
each of the various distribution chan-
nels and sectors. The retail pharmacy
sector continued to account for the
largest portion of prescription ex-
penditures ($203.8 billion, or 48.6%
of total expenditures), followed by
mail-order pharmacy ($96.7 billion,
or 23.0% of total expenditures), clinics
($56.7 billion, or 13.5% of total expen-
ditures), nonfederal hospitals ($33.6
billion, or 8.0% of total expenditures),
and long-term care ($16.5 billion, or
3.9% of total expenditures). Among
these top sectors, mail-order pharma-
cies had the largest percent growth
from the previous year (18.9%), which
was also the case in 2014. Clinics and
nonfederal hospitals also experienced
double-digit growth in 2015 (15.9%
and 10.7%, respectively).
Factors driving growth. The 11.7%
growth in overall pharmaceutical
expenditures in 2015 resulted from
increased prices of existing drugs
(8.4%), spending on new drugs (2.7%),
and changes in the volume of drug use
(0.5%). Factors that drove growth in
2015 differed by sector. For example,
in the clinic setting the 15.9% total
growth was driven mostly by an in-
creased volume of drug use (9.0%), as
shown in Table 2, with increased pric-
es of existing products and spending
on new products contributing 3.8%
and 3.1%, respectively. In the clinic
environment, the majority of spend-
ing ($43.9 billion of $56.7 billion) was
for injectable products. However,
growth in spending in clinics in 2015
was greater for noninjectables ver-
sus injectables—particularly branded
noninjectables, which saw a 26.4%
increase from 2014. In nonfederal
hospitals, the 10.7% increase in drug
spending in 2015 was driven primar-
ily by increased prices of existing drugs
(7.6%); new products and volume
changes contributed 2.6% and 0.5%,
respectively. As was the case in the clin-
ic setting, the majority of spending in
hospitals ($24.9 billion of $33.6 billion)
in 2015 was for injectable products, but
in this setting generics and branded
generics saw the largest growth (16.5%
and 19.5%, respectively).
Trends in overall drug spending.
Figure 1 shows the annual changes (in-
creases or decreases) in prescription
drug expenditures in the United States
from 1999 to 2015 in clinics, nonfed-
eral hospitals, and all sectors overall.
Although erratic, the patterns suggest
a general decline in the rate of growth
through 2008, followed by a leveling-
off period and then a steep increase
beginning in 2013. The growth in drug
expenditures in 2015 (15.9%, 10.7%,
and 11.7% for clinics, for nonfederal
hospitals, and overall, respectively)
was higher than anticipated.11
Top drugs overall. The top 25 drugs
based on expenditures across all sec-
tors during the 2015 calendar year are
shown in Table 3. The HCV combina-
tion drug ledipasvir–sofosbuvir was
the top drug, accounting for $14.3 bil-
lion in expenditures in 2015. It replaced
sofosbuvir (single agent), which was the
number 1 drug in 2014 but fell to 24th
place in 2015, with a 61.9% year-over-
year decline in expenditures (to $3 bil-
lion). Adalimumab (at $10.6 billion in
expenditures), insulin glargine (at $9.2
billion), and etanercept and rosuvatatin
(each at approximately $6.5 billion)
rounded out the top 5. Aripiprazole,
which became available as a generic
in 2015, fell from 2nd to 6th place, with
an annual reduction in expenditures
of 20.6%. Esomeprazole expenditures
dropped 23.0% after the oral product
became available as a generic in 2015.
Epoetin alfa (–9.1%) and oxycodone
(–3.4%) also experienced reductions in
expenditures from 2014 levels, which is
a continuing trend for both. Among the
top 25 drugs by expenditures in 2015,
SPECIAL FEATURE	 PROJECTING FUTURE DRUG EXPENDITURES
e360    AM J HEALTH-SYST PHARM | VOLUME 73 | 2016
those with the largest percentage in-
creases from 2014 were adalimumab
(37.1%), pregabalin (23.4%), and sev-
eral insulin products, including insulin
detemir (34.8%), insulin aspart (28.8%),
and insulin lispro (23.2%).
Top drugs in clinics. The top 25
drug products by 2015 expenditures in
the clinic setting are listed in Table 4.
Table 1. Prescription Drug Expenditures and Growth by Sectora
Sectorb
2015 Expenditures
($ Millions)
Percent of Total
Expenditures
Percent Change From
2014
Retail pharmacies 203,802 48.6 8.2
Mail-order pharmacies 96,668 23.0 18.9
Clinics 56,709 13.5 15.9
Nonfederal hospitals 33,580 8.0 10.7
Long-term care 16,495 3.9 2.9
Staff-model HMO 4,766 1.1 25.3
Home healthcare 3,640 0.9 18.4
Federal facilities 2,698 0.6 –2.0
Other 1,083 0.3 14.5
		Total 419,440 11.7
a
HMO = health maintenance organization.
b
Retail pharmacies including standalone chain and independent stores, as well as mass merchandisers and food and convenience stores with a
licensed pharmacy. Mail-order pharmacies include licensed mail service pharmacies, including both private-sector and federal facilities. Clinics include
physician offices and outpatient clinics, including general, family medicine, and specialty clinics covering oncology, nephrology, dialysis, family plan-
ning, orthopedics, and urgent care centers. Nonfederal hospitals include all non–federally owned facilities licensed as hospitals, including inpatient
treatment and rehabilitation facilities, in addition to general and specialty acute care institutions. Long-term care includes nursing homes and
residential care facilities. Staff-model HMO includes closed-panel HMO pharmacies and hospitals, union clinics and pharmacies, and workers’
compensation clinics. Home healthcare includes licensed home health organizations and visiting nurse entities. Federal facilities include Public
Health Service and other federal hospitals and U.S. ships at sea (Veterans Health Administration facilities are normally included in the federal
facility sector, but data on expenditures were not available after December 31, 2013). Other covers a variety of otherwise unclassified government
accounts, as well as entities such as jails, prisons, and veterinary hospitals and clinics.
Table 2. Factors Driving Growth of Pharmaceutical Expenditures in Clinics and Nonfederal Hospitals in 2015, by
Product Categorya
Clinics Nonfederal Hospitals
Total
Percent
Growth
Percent Growth Due to Factor
Total
Percent
Growth
Percent Growth Due to Factor
Product Category
New
Products Price
Volume
and Mix
New
Products Price
Volume
and Mix
All products 	15.9 3.1 	3.8 	9.0 	10.7 2.6 	7.6 	0.5
Injectables 13.9 2.0 3.4 8.5 11.3 2.4 7.3 1.6
	Brands 13.9 1.8 3.6 8.5 8.6 1.2 4.2 3.1
	Generics 7.3 4.4 –1.7 4.6 16.5 9.1 6.4 1.0
	 Branded generics 20.3 1.7 6.2 12.5 19.5 0.3 25.7 –6.4
Noninjectables 23.3 7.2 5.3 10.9 9.2 3.4 8.4 –2.6
	Brands 26.4 7.9 6.4 12.1 10.4 3.3 11.4 –4.3
	Generics 19.5 8.3 –1.0 12.2 15.2 7.4 5.2 2.5
	 Branded generics 8.1 0.8 6.8 0.5 1.7 0.1 6.8 –5.3
a
Total growth comprised growth due to three factors: new products (products that were not on the market during the previous year), primarily
newly approved and marketed agents; price (changes in the unit cost of drugs that were on the market in the previous year; and volume and mix
(changes in volume of utilization of existing products or changes in utilization patterns [e.g., a shift from one product to another, as when prescribing
moves from brand to generic products]).
PROJECTING FUTURE DRUG EXPENDITURES	 SPECIAL FEATURE
	 AM J HEALTH-SYST PHARM | VOLUME 73 | 2016  e361
Figure1.Annualgrowthindrugexpenditures,1999–2015.
Nonfederalhospitals
Year
15
20
10
5
0
%AnnualChangeinExpenditures
25
30
–5
19.7
15.3
18.1
12.4
12.6
9.3
5.9
8.7
4.05.2
2.7
4.0
1.82.3
13.311.7
14.8
4.9
26.8
9.7
6.2
6.4
5.9
3.8
1.6
2.12.8
1.5
0.8
0.6
3.0
5.5
10.7
26.3
24.6
23.0
21.4
22.5
12.8
13.5
20.9
9.9
1.0
5.1
5.7
8.2
14.5
15.9
19992000200120022003200420052006200720082009201020112012201320142015
TotalexpendituresClinics
1.8
6.0
2.1
SPECIAL FEATURE	 PROJECTING FUTURE DRUG EXPENDITURES
e362    AM J HEALTH-SYST PHARM | VOLUME 73 | 2016
Infliximab was the top drug, account-
ing for $3.3 billion in expenditures,
followed by pegfilgrastim, rituximab,
epoetin alfa, and bevacizumab—each
accounting for expenditures of $2–3
billion. Among the top 25 drugs in
clinics, those with the biggest percent-
age increases in expenditures from
2014 to 2015 were pneumococcal vac-
cine (73.8%), pertuzumab (47.8%),
sevelamer (41.9%), darbepoetin alfa
(29.5%), immune globulin (26.9%),
and denosumab (20.5%). Among
the top 25 drugs in clinics, the only
agents with reduced expenditures in
2015 versus 2014 were ranibizumab
(–13.4%), epoetin alfa (–9.7%), and
pemetrexed.
Top drugs in nonfederal hospitals.
The top 25 prescription products by
2015 expenditures in the nonfederal
hospitalsettingarelistedinTable5.The
5 top-ranked drugs were unchanged
from 2014. These were infliximab (with
$1.0 billion in expenditures), ritux-
imab, pegfilgrastim, immune globulin,
and alteplase. Among drugs included
in the top 25 for nonfederal hospitals,
those with the largest increases in ex-
penditures were pneumococcal vac-
cine (90.1%), radium-223 (45.3%), tras-
tuzumab (22.8%), alteplase (20.8%),
and natalizumab (20.6%); drugs with
large decreases in expenditures in 2015
were linezolid (–39.4%), bivalirudin
(–27.7%), and enoxaparin (–16.7%).
The therapeutic drug categories
that accounted for the highest per-
centages of drug expenditures in non-
federal hospitals in 2015 are shown in
Table 6. The top 25 categories shown in
the table represented 82.7% of all ex-
penditures in hospitals. As in the past,
antineoplastic agents were the top
category, accounting for 17.3% of the
drug spend in hospitals. As a class, an-
tineoplastic drugs also had significant
growth in 2015 (16.6%). Among other
categories within the hospital sector
with high growth in expenditures in
2015 were hormones (49.9%), cardiac
agents (47.8%), antiarthritics (34.6%),
vascular agents (32.5%), biologicals
(27.0%), and antiviral drugs (26.9%).
Trends in antimicrobials. In 2015,
$48.4 billion was spent on antimicro-
bials across all healthcare sectors, of
which 42.8% of the total spend was for
antivirals (not including those target-
ing HIV), 34.2% was for antiretrovirals,
18.1% was for antibacterials, and 4.9%
was for antifungals. Expenditures on
antibacterial agents decreased (–5.2%)
in 2015, as compared with 2014, while
spending on antifungals, antiretrovi-
rals, and antivirals increased by 18.8%,
36.0%, and 35.8%, respectively. Almost
half (45.3%) of antimicrobial expen-
ditures were in retail pharmacies,
followed by mail-order pharmacies
(29.7%), nonfederal hospitals (9.1%),
and clinics (6.9%).
The top antimicrobials by expen-
ditures in clinics and nonfederal hos-
pitals in 2015 are shown in eTable 1
(available at www.ajhp.org). Clinic
antimicrobial expenditures increased
6.9% from 2014. In nonfederal hospi-
tals, antimicrobial expenditures (in-
cluding antivirals and antifungals) in-
creased 8.3%. Interestingly, at a period
when infections by multidrug-resistant
organisms were increasing and new
parenteral agents were added to the
antibiotic armamentarium, antibacte-
rials (as a class) had only a small (1.9%)
increase in expenditures.
Table 3. Top 25 Drugs by Expenditures Overall in 2015
Druga
2015 Expenditures
($ Thousands)
Percent Change
From 2014
Ledipasvir–sofosbuvir 14,256,452 . . .b
Adalimumab 10,555,712 37.1
Insulin glargine 9,199,002 16.3
Etanercept 6,558,015 13.3
Rosuvastatin 6,415,420 9.3
Aripiprazole 6,364,092 –20.6
Fluticasone salmeterol 5,348,330 1.9
Infliximab 4,983,314 10.7
Esomeprazole 4,581,231 –23.0
Insulin aspart 4,519,650 28.8
Glatiramer 4,493,395 12.1
Pegfilgrastim 4,111,876 7.3
Sitagliptin 4,107,780 18.5
Insulin lispro 3,829,984 23.2
Pregabalin 3,820,486 23.4
Interferon beta-1a 3,750,432 1.1
Rituximab 3,634,107 4.9
Tiotropium bromide 3,573,982 7.2
Insulin detemir 3,558,944 34.8
Dimethyl fumarate 3,469,448 20.0
Bevacizumab 3,137,829 8.8
Epoetin alfa 3,078,543 –9.1
Albuterol 3,051,641 10.2
Sofosbuvir 2,988,767 –61.9
Oxycodone 2,960,431 –3.4
a
For each drug listed, the expenditures shown are the total for brand and generic products and
for various dosage forms.
b
Not calculated because product was not available for entire year in 2014.
PROJECTING FUTURE DRUG EXPENDITURES	 SPECIAL FEATURE
	 AM J HEALTH-SYST PHARM | VOLUME 73 | 2016  e363
HCV antivirals as a class continued
to experience significant growth in
expenditures—an increase of 60.8%,
from $11.5 billion in 2014 to $18.4
billion in 2015. Mail-order and retail
pharmacies constituted the majority
(82.8%) of all HCV agent expenditures,
as shown in eTable 2 (available at
www.ajhp.org). However, while clinics
and nonfederal hospitals accounted
for small proportions of HCV antivi-
ral expenditures (6.7% and 1.2%, re-
spectively) in 2015, spending on those
agents in these sectors grew signifi-
cantly, by 74.2% and 242.4%, respec-
tively. As described previously,11
utili-
zation (and thus expenditures) in this
class tends to shift rapidly to newer
agents. For example, the combination
agent ledipasvir–sofosbuvir, which
became available in 2014, accounted
for the largest portion (77.4%) of HCV
antiviral expenditures in 2015.
Trends in biosimilars. Data on
total expenditures and units sold for
each GCSF product on the market in
2014 and 2015 are shown in eFigure
1 (available at www.ajhp.org). During
the first quarter of 2014, expenditures
for tbo-filgrastim were approximately
$11 million, representing 5.0% of to-
tal GCSF expenditures. Tbo-filgrastim
expenditures grew to approximately
$39 million (17.8% of total GCSF ex-
penditures) by the last quarter of 2015.
Filgrastim-sndz was launched during
the last quarter of 2015 and so cap-
tured only a small percentage of the
market (2.7% of all GCSF expendi-
tures). The number of 480-mg units of
GCSFs sold was slightly higher in 2015
(2,003,185) than in 2014 (1,979,181),
while total expenditures for all GCSF
products decreased slightly, from 2014
($947 million) to 2015 ($915 million).
Recent and anticipated drug
approvals. Selected novel agents that
may receive FDA approval for sale in
the United States by the end of 2016
are shown in Table 7. As in recent
years, new approvals expected in 2016
are largely specialty products. Agents
for treating inflammatory disorders
(e.g., rheumatoid arthritis, psoriasis)
and viral infections (HIV and HCV in-
fections) are well represented in the
list of expected approvals in 2016. A
relatively low proportion of expected
approvals are oncology agents, but it
has been more difficult to predict on-
cology approvals due to the fact that
most of these agents are granted the
“breakthrough” designation by FDA
and thus have an average approval
time of approximately four months.37
For example, there are several agents
targeting immune checkpoint PD-
L1 (atezolizumab and durvalumab)
and cyclin-dependent kinase (CDK)
proteins 4 and 6 (abemaciclib) that
currently have the FDA breakthrough
designation, but the corresponding
new drug application or biologics li-
cense application has yet to be filed
with FDA.30,38,39
It is likely that these
agents will be approved in 2016 or
early 2017.
As in the past, we analyzed recent
oncology drug approvals to under-
stand the potential impact of these
agents on future expenditures. As
shown in Table 8, 16 oncology drugs
were approved in 2015; data on the ap-
Table 4. Top 25 Drugs by Expenditures in Clinics in 2015
Druga
2015
Expenditures
($ Thousands)
Percent Change
From 2014
Infliximab 	3,280,663 	11.2
Pegfilgrastim 2,976,527 9.7
Rituximab 2,462,831 3.6
Epoetin alfa 2,456,606 –9.7
Bevacizumab 2,382,695 7.0
Trastuzumab 1,923,290 12.8
Pneumococcal vaccineb
1,815,005 73.8
Ranibizumab 1,522,626 –13.4
Denosumab 1,345,258 20.5
Pemetrexed 949,987 –2.0
Ledipasvir–sofosbuvir 932,428 . . .c
Immune globulin 850,967 26.9
Sevelamer 815,945 41.9
Influenza virus vaccines 781,295 4.0
Natalizumab 652,902 13.6
Pertuzumab 646,794 47.8
Darbepoetin alfa 644,625 29.5
Varicella virus vaccine 637,381 0.4
Human papillomavirus vaccine 614,987 12.1
Paclitaxel 593,923 6.4
Nivolumab 577,649 . . .
Bendamustine 575,377 7.2
Octreotide 552,099 12.4
Abatacept 540,298 18.7
Bortezomib 496,842 9.1
a
For each drug listed, the expenditures shown are the total for brand and generic products
and for various dosage forms (unless otherwise indicated).
b
Includes Prevnar (Wyeth) and Pneumovax (Merck Sharp & Dohme) products.
c
Not calculated because product was not available for entire year in 2014.
SPECIAL FEATURE	 PROJECTING FUTURE DRUG EXPENDITURES
e364    AM J HEALTH-SYST PHARM | VOLUME 73 | 2016
proximate cost for 28 days of therapy,
based on average wholesale price, are
presented.40
Of note, most of these
drugs are indicated for use in treating
tumor types with a relatively low in-
cidence (e.g., multiple myeloma, thy-
roid cancer, soft tissue sarcoma), and
most of those used to treat a higher-
incidence cancer such as lung cancer
are targeted toward patients with a
specific genetic mutation; thus, the
overall impact of new oncology agents
on expenditures may be limited. Fur-
ther, 10 of the 16 drugs are oral agents.
These are also not likely to raise in-
patient expenditures but may have a
spending impact at institutions that
manage their own specialty pharmacy.
Institutions that have a pharmacist-
led oral oncology monitoring program
may observe an increase in the work-
load for adherence and toxicity moni-
toring. The anticipated new i.v. agents
for treatment of multiple myeloma
(daratumumab and elotuzumab) are
likely to raise outpatient drug expen-
ditures, especially for institutions that
have a robust oncology program, be-
cause these agents address a previ-
ously unmet need.
It should be noted that in analyz-
ing 2015 drug expenditures, we found
that the drugs with the highest per-
centage growth in spending tended
to be recently released cancer agents.
For example, the immune checkpoint
inhibitors nivolumab ($764 million
in expenditures in 2015) and pem-
brolizumab ($393 million in 2015)
were among the drugs with the high-
est growth increases from 2014. The
orally administered CDK4/6 inhibitor
palbociclib, used in the treatment of
breast cancer, entered the market in
early 2015 and quickly rose toward the
top of the list of oncology drugs by ex-
penditures that year, with $749 million
in expenditures.
Patent expirations and gener-
ics. Generic drugs, including brand-
ed generics, continued to capture a
significant proportion of the overall
drug spend, accounting for 17.3% of
injectable drug spending and 30.9%
of noninjectable drug spending across
all channels in 2015. In the nonfederal
hospital sector, generics accounted
for 32.7% of drug spending (30.5% of
expenditures on injectables and 38.9%
of expenditures on noninjectables). In
this sector, spending for noninject-
ables grew 2.0% for generics and 3.0%
for branded generics in 2015, as com-
pared with 2014, and this was largely
due to increased prices (Table 2). In
the clinic setting, generics accounted
for 15.9% of spending (13.6% of ex-
penditures on injectables and 24.0%
of expenditures on noninjectables).
Much of the growth in expenditures
for generics in clinics was due to in-
creased utilization of these agents—
although increased prices also con-
tributed to spending growth in the
case of branded generics.
Medications with patent expira-
tions in late 2014 or early 2015 were
mostly items used in the retail setting;
those expirations were thus unlikely to
have had a meaningful impact on hos-
pital and clinic spending. However,
some generics launched in 2015 had
a significant impact on spending in
nonfederal hospitals; these included
bivalirudin and linezolid, for which
expenditures were reduced by 27.7%
and 39.4%, respectively (Table 5). Ge-
Table 5. Top 25 Drugs by Expenditures in Nonfederal Hospitals in 2015
Druga
2015 Expenditures
($ Thousands)
Percent Change
From 2014
Infliximab 	1,044,624 	8.1
Rituximab 1,007,033 8.1
Pegfilgrastim 846,688 –1.2
Immune globulin 825,446 –1.2
Alteplase 731,292 20.8
Natalizumab 698,851 20.6
Daptomycin 644,964 –6.1
Bevacizumab 619,684 14.0
Pneumococcal vaccineb
619,468 90.1
Trastuzumab 509,862 22.8
Piperacillin–tazobactam 440,142 11.6
Radium-223 437,472 45.3
Influenza virus vaccine 356,889 10.8
Epoetin alfa 325,962 –1.9
Filgrastim 320,024 –8.1
Bivalirudin 312,217 –27.7
Regadenoson 299,820 0.6
Denosumab 297,575 18.4
Enoxaparin 281,336 –16.7
Albumin 265,580 7.2
Darbepoetin alfa 220,151 –0.4
Pemetrexed 219,543 –5.4
Acetaminophen (i.v. only) 218,605 4.5
Iohexol 216,268 1.8
Linezolid 212,269 –39.4
a
For each drug listed, the expenditures shown are the total for brand and generic products
and for various dosage forms (unless otherwise indicated).
b
Includes Prevnar (Wyeth) and Pneumovax (Merck Sharp & Dohme) products.
PROJECTING FUTURE DRUG EXPENDITURES	 SPECIAL FEATURE
	 AM J HEALTH-SYST PHARM | VOLUME 73 | 2016  e365
Table 6. Top 25 Therapeutic Drug Categories by Expenditures in Nonfederal Hospitals in 2015
Drug Category
2015 Expenditures
($ Thousands)
Percent Change
From 2014
Percent of Total 2015
Expenditures
Antineoplastic agents 	5,848,224 	16.6 	17.3
Hemostatic modifiers 3,071,269 0.7 9.1
Antiinfectives, systemic 2,724,544 1.0 8.1
Blood factors 2,029,880 –0.7 6.0
Biologicals 1,845,266 27.0 5.5
Gastrointestinal agents 1,817,896 10.2 5.4
Immunologic agents 1,489,837 19.8 4.4
Antiviral drugs 1,297,264 26.9 3.8
Hospital solutions 1,194,442 1.0 3.5
Respiratory therapy agents 1,132,022 4.7 3.4
Anesthetics 1,101,273 –5.5 3.3
Miscellaneous 1,000,847 7.5 3.0
Diagnostic aids 998,702 1.6 3.0
Analgesics 807,730 2.5 2.4
Psychotherapeutics 806,528 2.1 2.4
Hormones 615,854 49.9 1.8
Vascular agents 608,866 32.5 1.8
Musculoskeletal agents 594,240 15.7 1.8
Cardiac agents 545,775 47.8 1.6
Neurologic disorder drugs 524,528 21.9 1.6
Antiarthritics 472,793 34.6 1.4
Diabetes therapy 412,858 5.8 1.2
Antifungal agents 371,481 10.4 1.1
Ophthalmic preparations 367,374 –0.5 1.1
Enzymes 336,925 5.9 1.0
neric aripiprazole and esomeprazole
products contributed to reductions in
expenditures across all channels, with
2015 spending declines of 20.6% and
23.0% from 2014 levels, respectively
(Table 3).
Select branded agents expected
to lose patent protection in 2016 are
shown in Table 9. Estimating when a
patent will expire is complex due to
potential litigation, exclusivities, and
other factors. However, medications
important to drug expenditures in hos-
pitals and clinics that could be avail-
able in generic versions in 2016 include
albuterol sulfate (for delivery via dry
powder inhaler), daptomycin, imati-
nib, oseltamivir, and rosuvastatin.
While the availability of generics
usually reduces overall expenditures,
recently there have been sharp in-
creases in the prices of some generic
drugs that have led to growth in ex-
penditures. Such increases may be
spurred by consolidation of manufac-
turers, arbitrary price hikes, or drug
shortages. We examined the top 15
generic products with high growth in
expenditures in 2015 (Table 10). The
15 drugs listed collectively accounted
for an increase in expenditures of $2.4
billion (85.6%) over the previous year.
One factor influencing high drug ex-
penditure growth for certain generic
drugs is the FDA “Unapproved Drugs
Initiative,” which targeted for enforce-
ment older unapproved products and,
as a consequence, reduced the number
of manufacturers of some drugs.41
In
2015, this initiative had a drastic im-
pact on the prices of and subsequent
expenditures on vasopressin, neostig-
mine, and hydroxyprogesterone, for
which annual spending increased by
697.7%, 409.2%, and 270.9%, respec-
tively. Other drugs such as isoprotere-
nol, flucytosine, and nitroprusside had
dramatic expenditure growth (275.7%,
126.4%, and 112.8%, respectively) due
to consolidation of manufacturers.
Drug expenditure forecast for
2016. Based on the drug expenditure
trends described above, anticipated
new drug approvals, expected approv-
SPECIAL FEATURE	 PROJECTING FUTURE DRUG EXPENDITURES
e366    AM J HEALTH-SYST PHARM | VOLUME 73 | 2016
Table 7. Selected Drugs and Biologicals That Have Received or May Receive FDA-Approved Labeling in 2016a
Drug or Biological Manufacturer Indication Route
Quarter and
Year
of PDUFA Dateb
Elbasvir–grazoprevir Merck Chronic hepatitis C (genotypes
1 and 4)
Oral Q1 2016
Coagulation factor IX
(recombinant), albumin
fusion protein
CSL Behring Hemophilia B I.V. Q1 2016
Brivaracetam UCB Partial-onset seizures I.V. or oral Q1 2016
Daclizumab high-yield
process
Biogen and AbbVie Relapsed multiple sclerosis Subcutaneous Q1 2016
Rilpivirine–emtricitabine–
enofovir alafenamide
Gilead HIV-1 infection (in combination
with other HIV antiretroviral
agents)
Oral Q1 2016
Emtricitabine–tenofovir
alafenamide fumarate
Gilead HIV-1 infection (in combination
with other HIV antiretroviral
agents)
Oral Q1 2016
Recombinant factor VIII Bayer Hemophilia A I.V. Q1 2016
Eteplirsen Sarepta
Therapeutics
Duchenne muscular dystrophy
amenable to exon 51 skipping
I.V. Q1 2016
Defibrotide Jazz
Pharmaceuticals
Hepatic venoocclusive disease
with multiorgan dysfunction
after hematopoietic stem cell
transplantation
I.V. Q1 2016
Safinamide Newron
Pharmaceuticals
Add-on therapy in early- and
mid- to late-stage Parkinson’s
disease
Oral Q1 2016
Sofosbuvir–velpatasvir Gilead Chronic hepatitis C (genotypes
1–6)
Oral Q2 2016
Reslizumab Teva Pharmaceutical
Industries
Asthma and elevated blood
eosinophils inadequately
controlled on inhaled
corticosteroids
I.V. Q2 2016
Obeticholic acid Intercept Primary biliary cholangitis Oral Q2 2016
Lixisenatide Sanofi Adult type 2 diabetes mellitus Subcutaneous Q2 2016
Pimavanserin Acadia
Pharmaceuticals
Psychosis associated with
Parkinson’s disease
Oral Q2 2016
Deutetrabenazine Teva Pharmaceutical
Industries
Chorea associated with
Huntington disease
Oral Q2 2016
Venetoclax Roche Chronic lymphocytic leukemia Oral Q3 2016
Etelcalcetide Amgen Secondary hyperparathyroidism
in chronic kidney disease
requiring hemodialysis
I.V. Q3 2016
Brodalumab Valeant
Pharmaceuticals
Moderate-to-severe plaque
psoriasis
Subcutaneous Q4 2016
Sarilumab Regeneron
Pharmaceuticals
and Sanofi
Moderately to severely active
rheumatoid arthritis
Subcutaneous Q4 2016
Atezolizumab Roche Locally advanced or metastatic
urothelial carcinoma
I.V. Q4 2016
Baricitinib Eli Lilly and
Company
Moderately to severely active
rheumatoid arthritis
Oral Q1 2017
a
FDA = Food and Drug Administration, HIV = human immunodeficiency virus, PDUFA = Prescription Drug User Fee Act, Q = quarter.
b
Extrapolated based on new drug application submission date and review status (i.e., 10 months for standard review and 6 months for priority
review).
PROJECTING FUTURE DRUG EXPENDITURES	 SPECIAL FEATURE
	 AM J HEALTH-SYST PHARM | VOLUME 73 | 2016  e367
als of generic drugs in 2016, and our
overall assessment of the impact of an-
ticipated changes in the industry, we
estimate an overall increase of 11–13%
in pharmaceutical expenditures in
2016.We also predict that drug spend-
ing in clinics will increase by 15–17%
while spending in nonfederal hospi-
tals will grow 10–12% in 2016. These
estimates for growth are considerably
higher than those we have made in the
past but consistent with recent trends
and other forecasts.2,42
In the hospital
environment, we have observed con-
sistent increases in growth over the
past three years. Factors driving this
continued growth, including price
increases by manufacturers, are not
likely to change in the next year. Fur-
ther, while politicians have lamented
drug price increases, actual legisla-
tion to rein in price hikes has not oc-
curred; even if such legislation or bal-
lott initiatives were enacted, it would
likely not be targeted toward curbing
hospital drug expenditures.43
In the
clinic setting, expensive new drugs for
cancer and specialty medications will
drive continued high growth.
Discussion
Growth in drug expenditures in
2015 in both clinics and nonfederal
hospitals continued to be marked by
a pattern of steep increases that be-
gan in 2013. While the overall growth
(i.e., growth in all sectors) was slightly
lower in 2015, it was still higher than it
had been for most of the past decade.
We predict continued high growth
in 2016 for prescription drug expen-
ditures in clinics, hospitals, and all
sectors combined. Our estimates for
anticipated growth in 2016 are higher
than those of the Centers for Medicare
and Medicaid Services (CMS), which
has projected that U.S. retail prescrip-
tion drug expenditures will increase
6.4% in 2016 and 5.5% in 2018.2,44
Our
estimates are also higher than those
of Express Scripts, a provider of in-
tegrated pharmacy benefit manage-
ment services, which projected a 6.8%
increase in 2016, followed by increases
of 7.3% in 2017 and 8.4% in 2018.45
However, both the CMS and Express
Scripts forecasts are specific to retail
drug expenditures, whereas ours are
focused on drug spending in hospitals
and clinics.
Table 8. Oncology Agents That Received FDA-Approved Labeling in 2015a
Drug Indication Route
Approximate Price
for 28 Days of
Therapy ($)b
Alectinib ALK-positive non-small-cell lung cancer Oral 	13,800
Cobimetinib BRAF mutation–positive melanoma Oral 7,300
Daratumumab Multiple myeloma I.V. 24,000c
Elotuzumab Multiple myeloma I.V. 9,946
Gefitinib Non-small-cell lung cancer involving specific
EGFR mutations
Oral 8,104
Irinotecan liposome Pancreatic cancer I.V. 10,941
Ixazomib Multiple myeloma Oral 10,404
Lenvatinib Thyroid cancer Oral 24,192
Necitumumab Squamous non-small-cell lung cancer I.V. 12,800
Osimertinib Non-small-cell lung cancer involving specific
EGFR mutation
Oral 14,280
Palbociclib Breast cancer Oral 12,411
Panobinostat Multiple myeloma Oral 11,733
Sonidegib Basal cell carcinoma Oral 11,267
Talimogene laherparepvec Melanoma Local
injection
65,000d
Trabectedin Soft tissue sarcoma I.V. 11,232
Trifluridine–tipiracil Colorectal cancer Oral 6,569
a
FDA = Food and Drug Administration.
b
Approximate cost was calculated based on average wholesale price listed in Redbook Online.40
For drugs that are dosed by weight or body
surface area, standards of 70 kg and 1.73 m2
(respectively) were used. For talimogene laherparepvec, the price estimate was obtained from the
manufacturer.61
c
Price per 28 days for the first two months. After the first two months, the price decreases to $12,000 per 28 days for the next four months and to
$6,000 per 28 days thereafter.
d
Price for one course.
SPECIAL FEATURE	 PROJECTING FUTURE DRUG EXPENDITURES
e368    AM J HEALTH-SYST PHARM | VOLUME 73 | 2016
Overall spending on drugs in the
United States is influenced by many
different factors, the most important
of which are changes in the economy,
the population, and the healthcare
system. While the economy is difficult
to predict, it has been strengthening
for the past several years, and most
analysts forecast continued growth.
The United States also continues to
experience the long-term trend of
population aging and the associated
increases in healthcare needs and
spending. At the same time, while
the ACA has been credited for mod-
erating growth in healthcare spend-
ing, increased access to health insur-
ance with prescription coverage has
boosted medication expenditures ac-
cordingly. These and other factors are
expected to contribute to continued
growth in drug spending in 2016 and
beyond.2
In this article we have analyzed
specific drugs and drug classes that
contributed to growth in prescription
expenditures in 2015 and may be ex-
pected to do so in 2016. Much of the
recent and projected future growth
has been or will be driven by specialty
drugs. In 2015, FDA approved 45 novel
agents, most of which were specialty
drugs.46
New drugs were approved in
all major specialty classes in 2015, in-
cluding palbociclib for advanced met-
astatic breast cancer, secukinumab for
plaque psoriasis, daclatasvir for HCV
infection, lumacaftor–ivacaftor for
cystic fibrosis, and selexipag for pul-
monary arterial hypertension. In ad-
dition to the focus on complex, chron-
ic, or rare diseases, specialty drugs
are often high-cost products and may
have extensive monitoring, storage,
dispensing, administration, patient
education, safety, and data reporting
requirements. Because the pipeline
for specialty drugs is rich and with
over 1000 targeted cancer drugs cur-
rently in development, we anticipate
that these drugs will continue to be a
Table 9. Selected Potential Patent Expirations in 2016a
Drug Brand Name Indication(s)
Abacavir–lamivudine–zidovudine Epzicom HIV infection
Abacavir sulfate–lamivudine Trizivir HIV infection
Albuterol sulfate (dry powder inhaler) Proair HFA Asthma
Amlodipine besylate–olmesartan medoxomil Azor Hypertension
Amlodipine–hydrochlorothiazide–olmesartan Tribenzor Hypertension
Armodafinil Nuvigil Apnea, narcolepsy
Bexarotene Targretin Skin cancer
Clindamycin phosphate–tretinoin Ziana Acne
Daptomycin Cubicin Infection
Darifenacin hydrobromide Enablex Overactive bladder
Diclofenac (gel) Solaraze Arthritis, pain
Dofetilide Tikosyn Irregular heartbeat
Eletriptan hydrobromide Relpax Migraine
Ezetimibe Zetia Hyperlipidemia
Imatinib mesylate Gleevec Cancer
Lopinavir–ritonavir Kaletra HIV infection
Mesalamine Asacol HD Ulcerative colitis
Metformin Glumetza Diabetes
Olmesartan medoxomil Benicar Hypertension
Olmesartan medoxomil–hydrochlorothiazide Benicar HCT Hypertension
Oseltamivir phosphate Tamiflu Influenza
Quetiapine fumarate Seroquel XR Antipsychotic
Ritonavir Norvir HIV infection
Rosuvastatin calcium Crestor Hypertension
Tigecycline Tygacil Infection
a
HIV = human immunodeficiency virus.
PROJECTING FUTURE DRUG EXPENDITURES	 SPECIAL FEATURE
	 AM J HEALTH-SYST PHARM | VOLUME 73 | 2016  e369
major contributor to drug expenditure
growth in 2016 and beyond.45
Among the specialty drugs, those
used to treat HCV infection were
among the top-ranked agents by ex-
penditures in 2015. Clinics and non-
federal hospitals accounted for a
small portion of total HCV antiviral
expenditures but are playing a great-
er role in HCV infection treatment
due in part to the growth of health
system–based specialty pharmacies.
While competition from newer HCV
drugs is expected to decrease prices,
subsequent savings may be offset by
increased utilization as new patients
with less severe disease are diagnosed
and treated. The Centers for Disease
Control and Prevention estimates that
chronic HCV infection affects 3.2 mil-
lion Americans, most of whom have
not yet been diagnosed.47
Although
payers have attempted to restrict use
of these medications to patients with
more advanced disease, guidelines
from the American Association for the
Study of Liver Diseases recommend
that all patients with chronic HCV in-
fection receive treatment,48
and CMS
has warned state Medicaid programs
not to unreasonably restrict coverage
of effective HCV-targeted treatment.49
Regardless, spending on HCV anti-
virals will continue to present an ex-
treme challenge for insurers, patients,
and healthcare providers.
Therapeutic categories that were
traditionally dominated by lower-cost
generics are also likely to be affected
by new specialty drugs in the future.
In late 2015, two new biologicals—
arilocumab and evolocumab—were
approved for the treatment of sub-
groups of adults who require ad-
ditional lowering of low-density li-
poprotein (LDL) cholesterol levels;
these drugs target the liver protein
PCSK9 (proprotein convertase sub-
tilisin/kexin type 9), inactivating it
and thereby reducing circulating
LDL cholesterol. There is concern
about potential overuse of these
PCSK9 inhibitors and subsequent
high spending.50
As a result, the pay-
er community instituted strict prior-
authorization criteria and coverage
policies. Nevertheless, both products
are on the type of steep growth curve
that is typical for a highly promoted
new product in a novel class. Dur-
ing only a short time on the market
in 2015, PCSK9 inhibitors accounted
for a total of about 4000 filled pre-
scriptions in retail and mail-order
pharmacies, with expenditures of
nearly $6 million for each product.12
As the specialty drug market
grows, hospitals and health systems
continue to face barriers to access
because of manufacturer-instituted
restricted distribution channels. Dis-
ruptions in continuity of care may
occur, adding to administrative bur-
dens on pharmacy staff. There is also a
trend toward more restricted distribu-
tion in which specialty drugs can only
be dispensed or administered from
a network of one or more specialty
pharmacies or infusion centers.51
These restrictions present challenges
for health systems, especially those
undertaking risk-based global pay-
ment or population health initiatives.
To address these challenges, some
health systems have implemented in-
tegrated specialty pharmacy as a new
ambulatory care pharmacy practice
model, which may include a variety of
services such as prior-authorization
submissions, medication assistance,
medication adherence management,
and prescription dispensing and de-
livery to patients. Although more than
100 such programs are established or
in development in the United States,
fewer than 20 are operated by fully ac-
credited specialty pharmacies; com-
pared with other pharmacy programs,
these programs have reported faster
prior-authorization approvals, higher
medication adherence, and greater
patient satisfaction.52
Another increasingly used third-
party payer tactic is the site-of-service
management strategy for infusion of
specialty injectable drugs. Under this
approach, health plans restrict pa-
tients to a contracted provider of infu-
sion services. In 2015, 31% of health
plans reported implementation of a
site-of-service management strategy,
Table 10. Top 15 Older Agents With High Growth in 2015 Expenditures
Druga
2015 Expenditures
($ Thousands)
Percent Change
From 2014
Vasopressin 	160,977 	697.7
Neostigmine 288,273 409.2
Isoproterenol 219,748 275.7
Hydroxyprogesterone 191,250 270.9
Hydroxychloroquine 506,761 237.6
Flucytosine 49,157 126.4
Flecainide 88,321 123.8
Nitroprusside 218,022 112.8
Allopurinol 180,478 106.2
Metformin 1,383,663 85.8
Pyridostigmine hydroxide 88,318 77.4
Amitriptyline 185,415 77.3
Chlorpromazine 202,104 66.8
Ursodiol 316,091 63.2
Bupropion 1,131,214 12.7
a
For each drug listed, the expenditures shown are the total for brand and generic products
and for various dosage forms.
SPECIAL FEATURE	 PROJECTING FUTURE DRUG EXPENDITURES
e370    AM J HEALTH-SYST PHARM | VOLUME 73 | 2016
with 43% indicating plans to imple-
ment one in the next 12 months.51
While site-of-service restrictions may
save money for health plans, these
programs can disrupt continuity of
care and reduce revenue for clinic and
hospital pharmacies.
Promising to moderate the growth
of expenditures in the specialty drug
category in the future are biosimi-
lars. To date, the only class of drugs
with biosimilar product options is
the GCSFs. Our analyses show that
total expenditures for all GCSF prod-
ucts decreased after the market entry
of competing products and with the
general lowering of prices. This may
be due to the significant difference in
the ASPs of tbo-filgrastim and filgra-
stim. Although tbo-filgrastim is not
technically a biosimilar, its ASP de-
clined significantly over the past two
years (from $405 to $370 per 480-mg
unit). By the fourth quarter of 2015,
the ASP of tbo-filgrastim was 24% less
than that of filgrastim. Further, rising
utilization of the less expensive prod-
uct (tbo-filgrastim), coupled with the
market entry of filgrastim-sndz, led
to an increase in the total number of
GCSF units sold from 2014 to 2015.
The phenomenon of biosimilars in-
creasing the total volume of GCSFs
sold has also been observed in Europe
and may be due to relaxed restrictions
on use or increased affordability.53
Increasing patient access to ex-
pensive medications was one goal of
efforts to expand the availability of
biosimilars in the United States. The
next biosimilar likely to hit the U.S.
market in 2016 is infliximab. Its mar-
ket entry (and presumptive ability to
moderate expenditure growth in this
area) has been hampered by launch
delays because of FDA review setbacks
and patent challenges. Other drugs for
which biosimilar applications have
been submitted to FDA include pegfil-
grastim, etanercept, and adalimumab.
In the hospital setting, an issue
that has generated significant concern
for health-system pharmacy admini-
strators in the past year is high-cost
generics. While generic drugs gene-
rally continue to have a moderating
influence on prescription drug expen-
ditures overall, this impact has been
lessened by a decline in blockbuster
drugs subject to patent expiration and
changes in the generic marketplace
that influence prices. Substantial price
increases for some generic drugs have
been observed across dosage forms
and widely reported in the lay press.6
Injectable medications with triple-
digit price increases include calcito-
nin, hydralazine, and vasopressin. A
number of oral medications, includ-
ing hydroxychloroquine, fluoxetine,
atenolol, propranolol, digoxin, ami-
triptyline, tetracycline, phytonadione,
and captopril, were subjected to mas-
sive price increases in the last year.
These and other notable cases
of massive drug price increases—
including that of pyrimethamine
mentioned earlier—have led to sub-
stantial discussions by politicians
about potential solutions.54
On Febru-
ary 4, 2016, the House Committee on
Oversight and Government Reform
held a hearing titled “Developments
in the Prescription Drug Market: Over-
sight” to investigate the practices of
Turing Pharmaceuticals and Valeant
Pharmaceuticals. ASHP submitted a
statement urging Congress to explore
potential policy options and market-
based solutions to address the recent
trend of dramatic price increases for
generic drugs.55
It is unknown to what
extent congressional or organizational
efforts will influence pharmaceuti-
cal company pricing of medications.
A viewpoint article published in the
Journal of the American Medical Asso-
ciation identified three market-based
proposals to optimize generic drug
cost and availability, which included
restricting market entry, encouraging
long-term contracts with wholesal-
ers, and creating a futures market.56
While efforts to curb price increases
in the generic markets are explored,
pharmacists need to continue to con-
trol costs through proper formulary
management tactics such as waste re-
duction, implementation of stocking
efficiencies, and initiatives to ensure
appropriate medication use through
adherence to clinical criteria.
Another issue with the potential
to affect drug expenditures in some
health systems is the implementation
of major revisions to the federal 340B
Drug Pricing Program, which pro-
vides discounted drug prices on cov-
ered drugs to participating hospitals
and other eligible entities. The Health
Resources and Services Administra-
tion (HRSA) released the 340B Drug
Pricing Program omnibus guidance
on August 28, 2015.57
The guidance,
which touches on every aspect of the
340B program, proposes new criteria
for 340B program eligibility for offsite
outpatient facilities and clinics that
require that each facility be listed on
the covered entity’s Medicare cost re-
port and provide services that have
associated outpatient Medicare costs
and charges. These criteria would, if
implemented, prohibit the purchase
of 340B-covered drugs for offsite cor-
rectional facilities, since these facili-
ties do not have Medicare charges.
The guidance also proposes sweeping
changes to the definition of a patient
and requires that patients receive pre-
scriptions from a provider who is ei-
ther employed by the covered entity
or who is an independent contractor
for the covered entity. This would ex-
clude prescriptions generated as the
result of a referral to an outside pre-
scriber, such as in the case of cancer
patients who, after receiving prescrip-
tions from an outside specialist who is
not contracted with the covered entity,
return to their community hospital
for treatment. Patients must also re-
ceive prescriptions that result from a
billable outpatient visit, which would
exclude discharge prescriptions. Pa-
tients with emergency department
or observation visits would not be
eligible if the visit led to an inpatient
admission.
HRSA received 1264 comments to
the proposed guidance, and the final
guidance is expected in late 2016 or in
2017. Covered entities can expect re-
ductions in their 340B program–related
savings if any or all of the aforemen-
PROJECTING FUTURE DRUG EXPENDITURES	 SPECIAL FEATURE
	 AM J HEALTH-SYST PHARM | VOLUME 73 | 2016  e371
tioned proposals are approved, which
could have an impact on the breadth
of services they provide to uninsured
or underinsured patients.
As we have suggested previously,
pharmacy leaders must keep abreast
of important developments in
healthcare policy, finance, technol-
ogy, and practice in order to be opti-
mally prepared for changes that may
influence practice and thus have an
impact on medication spending. The
analyses and projections presented
here focus on factors likely to influ-
ence healthcare spending and pre-
scription drug expenditures in 2016,
but pharmacy leaders should also
carefully monitor other develop-
ments that are likely to have an im-
pact on departmental budgets in the
coming years. Additional guidance
on emerging issues that may influ-
ence drug spending can be found
in the newly released fourth annual
edition of the ASHP Foundation re-
port Pharmacy Forecast 2016–2020:
Strategic Planning Advice for Phar-
macy Departments in Hospitals and
Health Systems. We strongly urge
readers to review and use this report
in financial and strategic planning.
The complete report is freely avail-
able online (www.ashpfoundation.
org/pharmacyforecast).
Our analysis and forecast should
be considered with an understanding
of its important limitations. The pri-
mary source of the drug expenditure
trend data was the IMS Health NSP
database; while this is a very reliable
database, there are characteristics of
the data sets used in our analyses that
should be considered when interpret-
ing our results. The NSP database is
continually updated, and any analysis
may yield slightly different results de-
pending on the timing of data access.
For this article, data were extracted
on February 2, 2016. We refer readers
to a previous version of this forecast
for a complete description of other
characteristics and potential limita-
tions.10
One such limitation was that
the IMS data do not include expendi-
tures by the Veterans Affairs system.
The absence of these data began in
calendar year 2014. This limitation af-
fected our estimates of expenditures
for federal facilities, as shown in Table
1, and, to a lesser extent, the total for
all channels. Another limitation (one
not previously noted) was our catego-
rization of medication expenditures
by therapeutic drug class. Drugs that
are used across multiple indications
are categorized only by the primary
therapeutic drug class. On the other
hand, a previously noted limitation
that we have rectified in this version of
the annual forecast is the use of full-
calendar-year data for our analysis
of historical trends; previously in our
analysis of trends, data collection for
each year extended only through the
end of September, potentially leading
to conclusions unduly influenced by
seasonal fluctuations in utilization.
Finally, as in previous years, our anal-
ysis was also based on the availability
of information on new drug approv-
als and patent expirations, much of
which came from FDA sources as well
as pharmaceutical company news re-
ports. Because of the dynamic nature
of this information, some drugs may
have been overlooked, and accurate
information on some drugs may have
been unavailable.
The limitations noted above all
may have influenced both our find-
ings with regard to historical trends
and the accuracy of the predictions
made for spending in 2016. Further,
although based on a careful analysis
of key trends and factors expected to
affect medication spending, our fore-
cast was based primarily on the expert
opinion of the authors. We have ana-
lyzed the accuracy of our past predic-
tions, and, while not without error,
they have been comparable in accu-
racy to those of annual estimates from
CMS.58
Still, we caution readers not to
blindly use our projections as “mul-
tipliers” to adjust prior-year budgets
for the next period. Instead, local data
should be carefully and systematically
incorporated into an organization-
specific drug expenditure forecast,
with proper consideration of external
trends relevant to drug expenditures,
as described in this article.59,60
Conclusion
We project an 11–13% increase
in total drug expenditures across all
settings in 2016, with a 15–17% in-
crease in clinic spending and a 10–
12% increase in hospital spending.
Health-system pharmacy leaders
should carefully examine local drug
utilization patterns in projecting
their own organization’s drug spend-
ing in 2016.
Acknowledgments
The authors thank all of the individuals
who served as reviewers for this article
and the ASHP Section of Pharmacy Prac-
tice Managers for supporting this effort.
The statements, findings, conclusions, and
views contained and expressed herein are
those of the authors and do not necessarily
represent the views of ASHP, the U.S. gov-
ernment, the Department of Veterans Af-
fairs, or IMS Health Incorporated or any of
its affiliated or subsidiary entities.
Disclosures
Dr. Schumock has consulted for or received
research funding from Abbvie, Astellas, and
Baxter in the past three years; both he and
Mr. Vermeulen are uncompensated mem-
bers of the IMS Health Services Research
Network Steering Committee, from which
much of the evaluated data was obtained.
Dr. Li has received honoraria for advising
and/or speaking from Amgen, Hospira,
Merck, Pfizer, and Sandoz. The other au-
thors have declared no potential conflicts
of interest.
References
1.	Martin AB, Hartman M, Benson J,
Catlin A. National health spend-
ing in 2014: faster growth driven by
coverage expansion and prescription
drug spending. Health Aff (Millwood).
2016; 35:150-60.
2.	Keehan SP, Cuckler GA, Sisko AM et
al. National health expenditure pro-
jections, 2014-24: spending growth
faster than recent trends. Health Aff
(Millwood). 2015; 34:1407-17.
3.	Freundlich N. Keep the focus on rising
drug prices, not smirking Shkreli (Feb-
ruary 8, 2016). http://reforminghealth.
org/2016/02/08/keep-the-focus-on-
rising-drug-prices-not-smirking-
shkreli/ (accessed 2016 Mar 2).
4.	 Thomas Z, SwiftT.Who is Martin
Shkreli—’the most hated man in Amer-
SPECIAL FEATURE	 PROJECTING FUTURE DRUG EXPENDITURES
e372    AM J HEALTH-SYST PHARM | VOLUME 73 | 2016
ica’? (September 23, 2015). www.bbc.
com/news/world-us-canada-34331761
(accessed 2016 Mar 3).
5.	Winslow R. Cost of skin drugs rising
rapidly, study shows (November
26, 2015). www.wsj.com/articles/
prescription-skin-drugs-explode-
in-costs-study-shows-1448467254
(accessed 2016 Mar 2).
6.	Leopold C, Chambers JD, Wagner
AK. Thirty years of media coverage
on high drug prices in the United
States—a never-ending story or a
time for change? Value Health. 2016;
19:14-6.
7.	Johnson C, Dennis B. How an $84,000
drug got its price: ‘let’s hold our
position . . . whatever the head-
lines.’ (December 1, 2015). www.
washingtonpost.com/news/wonk/
wp/2015/12/01/how-an-84000-drug-
got-its-price-lets-hold-our-position-
whatever-the-headlines/ (accessed
2016 Mar 2).
8.	Tefferi A, Kantarjian H, Rajkumar SV
et al. In support of a patient-driven
initiative and petition to lower the
high price of cancer drugs. Mayo Clin
Proc. 2015; 90:996-1000.
9.	Rocco P, Gellad W, Donohue J. How
much does Congress care about drug
prices? Less than it should (January
13, 2016). http://healthaffairs.org/
blog/2016/01/13/how-much-does-
congress-care-about-drug-prices-
less-than-it-should/ (accessed 2016
Mar 2).
10.	Schumock GT, Li EC, Suda KJ et al.
National trends in prescription drug
expenditures and projections for
2014. Am J Health-Syst Pharm. 2014;
71:482-99.
11.	Schumock GT, Li EC, Suda KJ et al.
National trends in prescription drug
expenditures and projections for
2015. Am J Health-Syst Pharm. 2015;
72:717-36.
12.	National Sales Perspectives [propri-
etary database]. Plymouth Meeting,
PA: IMS Health; 2016.
13.	 IMS Health. Uniform System of Classi-
fication (March 2008). www.imshealth.
com/files/web/IMSH%20Institute/
USC_Classiification_Process_2011.pdf
(accessed 2016 Mar 30).
14.	 Biogen. FDA accepts biologics license
application for Zinbryta (daclizumab
high-yield process) for treatment of MS
(April 29, 2015). http://media.biogen.
com/press-release/corporate/fda-
accepts-biologics-license-application-
zinbryta-daclizumab-high-yield-pro
(accessed 2016 Feb 22).
15.	Gilead Sciences. Gilead submits
new drug application to U.S. Food
and Drug Administration for single
tablet regimen for HIV contain-
ing rilpivirine, emtricitabine and
tenofovir alafenamide (R/F/TAF)
(July 1, 2015). www.gilead.com/
news/press-releases/2015/7/gilead-
submits-new-drug-application-to-
us-food-and-drug-administration-
for-single-tablet-regimen-for-hiv-
containing-rilpivirine-emtricitabine-
and-tenofovir-alafenamide-rftaf
(accessed 2016 Feb 22).
16.	 GileadSciences.Gileadsubmitsnewdrug
applicationtoU.S.FoodandDrugAd-
ministrationforfixed-dosecombination
ofemtricitabine/tenofoviralafenamide
forHIVtreatment(April7,2015).www.
gilead.com/news/press-releases/2015/4/
gilead-submits-new-drug-application-
to-us-food-and-drug-administration-for-
fixeddose-combination-of-emtricitabine-
tenofovir-alafenamide-for-hiv-treatment
(accessed2016Feb22).
17.	 PR Newswire. FDA accepts Bayer’s bio-
logics license application for investiga-
tional treatment option in hemophilia
A (March 4, 2015). www.prnewswire.
com/news-releases/fda-accepts-
bayers-biologics-license-application-
for-investigational-treatment-option-
in-hemophilia-a-300045306.html
(accessed 2016 Feb 22).
18.	PR Newswire. Jazz Pharmaceuticals
announces U.S. FDA acceptance for
filing with priority review of NDA for
defibrotide for hepatic veno-occlusive
disease (September 30, 2105). www.
prnewswire.com/news-releases/
jazz-pharmaceuticals-announces-
us-fda-acceptance-for-filing-
with-priority-review-of-nda-for-
defibrotide-for-hepatic-veno-
occlusive-disease-300151412.html
(accessed 2016 Feb 22).
19.	Business Wire. Xadago (safinamide)
new drug application (NDA) ac-
cepted for filing by the U.S. Food and
Drug Administration (FDA) (March
2, 2015). www.businesswire.com/
news/home/20150302006405/en/
Xadago%C2%AE-safinamide-Drug-
Application-NDA-Accepted-Filing
(accessed 2016 Feb 22).
20.	 GileadSciences.GileadannouncesU.S.
FDApriorityreviewdesignationfor
sofosbuvir/velpatasvirfortreatment
ofallgenotypesofchronichepatitisC
infection(January4,2016).www.gilead.
com/news/press-releases/2016/1/
gilead-announces-us-fda-priority-review-
designation-for-sofosbuvirvelpatasvir-for-
treatment-of-all-genotypes-of-chronic-
hepatitis-c-infection(accessed2016Feb
2).
21.	TevaPharmaceuticalIndustriesLtd.Teva
announcesFDAacceptanceofthebiolog-
icslicenseapplicationforreslizumab
(June15,2015).www.tevapharm.com/
news/teva_announces_fda_acceptance_
of_the_biologics_license_application_for_
reslizumab_06_15.aspx(accessed2016
Feb22).
22.	Intercept. FDA extends PDUFA
date for obeticholic acid for the
treatment of PBC (December 17,
2015). https://globenewswire.com/
news-release/2015/12/17/796641/0/
en/FDA-Extends-PDUFA-Date-for-
Obeticholic-Acid-for-the-Treatment-
of-PBC.html (accessed 2016 Feb 22).
23.	Sanofi. Sanofi new drug applica-
tion for lixisenatide accepted
for review by FDA (September
29, 2015). www.news.sanofi.
us/2015-09-29-Sanofi-New-Drug-
Application-for-Lixisenatide-
Accepted-for-Review-by-FDA
(accessed 2016 Feb 22).
24.	Business Wire. Acadia Pharma-
ceuticals announces FDA priority
review of Nuplazid (pimavanserin)
new drug application for Parkin-
son’s disease psychosis (November
2, 2015). www.businesswire.com/
news/home/20151102005516/
en/ACADIA-Pharmaceuticals-
Announces-FDA-Priority-Review-
NUPLAZID%E2%84%A2 (accessed
2016 Feb 22).
25.	 BusinessWire.Teva announces FDA
acceptance of NDA for SD-809 for
treatment in Huntington disease
(August 12, 2015). www.businesswire.
com/news/home/20150812005421/
en/Teva-Announces-FDA-Acceptance-
NDA-SD-809-Treatment (accessed
2016 Feb 22).
26.	 Roche.FDAgrantspriorityreviewfor
venetoclaxnewdrugapplication(Janu-
ary12,2016).www.roche.com/investors/
updates/inv-update-2016-01-12.htm
(accessed2016Feb22).
27.	PR Newswire. FDA accepts Amgen’s
new drug application for novel
intravenous calcimimetic Etelcal-
cetide (November 6, 2015). www.
prnewswire.com/news-releases/
fda-accepts-amgens-new-drug-
application-for-novel-intravenous-
calcimimetic-etelcalcetide-300174208.
html (accessed 2016 Feb 22).
28.	PR Newswire. Valeant announces
FDA acceptance of BLA submission
for brodalumab in moderate-to-
severe plaque psoriasis (January
25, 2015). www.prnewswire.com/
news-releases/valeant-announces-
fda-acceptance-of-bla-submission-
for-brodalumab-in-moderate-to-
severe-plaque-psoriasis-300208845.
html (accessed 2016 Feb 22).
29.	 PR Newswire. Regeneron and Sanofi an-
nounce sarilumab biologics license ap-
PROJECTING FUTURE DRUG EXPENDITURES	 SPECIAL FEATURE
	 AM J HEALTH-SYST PHARM | VOLUME 73 | 2016  e373
plication accepted for review by US FDA
(January 8, 2016). www.prnewswire.
com/news-releases/regeneron-and-
sanofi-announce-sarilumab-biologics-
license-application-accepted-for-
review-by-us-fda-300201389.html
(accessed 2016 Feb 22).
30.	Taylor P. Roche prepares to file
atezolizumab for bladder cancer
(January 8, 2016). www.pmlive.
com/pharma_news/roche_prepares_
to_file_atezolizumab_for_bladder_
cancer_901572 (accessed 2016 Feb 22).
31.	Eli Lilly and Company. Lilly and
Incyte announce submission of new
drug application to FDA for oral
once-daily baricitinib for treatment
of moderate-to-severe rheumatoid
arthritis (January 19, 2016). https://
investor.lilly.com/releasedetail.
cfm?ReleaseID=950678 (accessed
2016 Feb 22).
32.	Food and Drug Administration. FDA
news release: FDA approves Zepatier
for treatment of chronic hepatitis
C genotypes 1 and 4 (January 28,
2016). www.fda.gov/NewsEvents/
Newsroom/PressAnnouncements/
ucm483828.htm (accessed 2016 Mar
30).
33.	 FoodandDrugAdministration.FDA
newsrelease:FDAapprovesfirstcoagu-
lationfactor–albuminfusionproteinto
treatpatientswithhemophiliaB(March
4,2016).www.fda.gov/NewsEvents/
Newsroom/PressAnnouncements/
ucm489266.htm(accessed2016Mar30).
34.	Taylor S. Digest: generic and biosimilar
pipeline September 2015 to December
2018 (2015). https://www.futurescripts.
com/FutureScripts/pdfs/for_members/
Q3_2015_Generic_Pipeline_Report.pdf
(accessed 2016 Mar 30).
35.	Express Scripts. Issues document:
patent expirations (2013–2017) (May 6,
2013). www.centerlighthealthcare.org/
images/uploads/Brand_Name_Drugs_
with_Patent_Expirations_2013_-_2017.
pdf (accessed 2016 Mar 30).
36.	 Stone K.Which popular drugs are
going off patent in 2013–2016?
(December 16, 2014). http://pharma.
about.com/od/BigPharma/a/Which-
Popular-Drugs-Are-Going-Off-Patent-
In-2013-2016.htm (accessed 2016 Feb
29).
37.	 EPVantage. Breakthrough designation
quickens FDA approval pace in 2014
(January 5, 2015). http://epvantage.
com/Universal/View.aspx?type=Story&
id=550480&isEPVantage=yes (accessed
2016 Feb 22).
38.	 Eli Lilly and Company. Lilly receives
FDA breakthrough therapy designa-
tion for abemaciclib—a CDK 4 and 6
inhibitor—in advanced breast cancer
(October 8, 2015). www.prnewswire.
com/news-releases/lilly-receives-fda-
breakthrough-therapy-designation-for-
abemaciclib–a-cdk-4-and-6-inhibitor–
in-advanced-breast-cancer-300156371.
html (accessed 2016 Feb 22).
39.	AstraZeneca. Durvalumab granted
breakthrough therapy designation
by US FDA for treatment of patients
with PD-L1 positive urothelial
bladder cancer (February 17, 2016).
www.astrazeneca.com/media-centre/
press-releases/2016/Durvalumab-
granted-Breakthrough-Therapy-
designation-by-US-FDA-for-treatment-
of-patients-with-PD-L1-positive-
urothelial-bladder-cancer-17022016.
html (accessed 2016 Feb 22).
40.	Redbook Online [online database].
Greenwood Village, CO: Truven
Health Analytics (accessed 2016 Feb
22).
41.	Food and Drug Administration. Un-
approved drugs initiative (December
15, 2014). www.fda.gov/Drugs/
GuidanceComplianceRegulatory
Information/EnforcementActivities
byFDA/SelectedEnforcementActions
onUnapprovedDrugs/ucm118990.
htm (accessed 2016 Mar 2).
42.	Aitken M, Kleinrock M. Global
medicines use in 2020: outlook and
implications. Parsippany, NJ: IMS
Institute for Healthcare Informatics;
2015 Nov.
43.	Conti RM, Rosenthal MB. Pharma-
ceutical policy reform—balancing
affordability with incentives for
innovation. N Engl J Med. 2016;
374:703-6.
44.	Sisko AM, Keehan SP, Cuckler GA
et al. National health expenditure
projections, 2013–23: faster growth
expected with expanded coverage
and improving economy. Health Aff
(Millwood). 2014; 33:1841-50.
45.	The Express Scripts Labs. Express
Scripts 2015 drug trend report (March
2016). http://lab.express-scripts.
com/lab/drug-trend-report (accessed
2016 Apr 4).
46.	 Food and Drug Administration. Novel
new drugs: 2014 summary (Janu-
ary 2015). www.fda.gov/downloads/
Drugs/DevelopmentApprovalProcess/
DrugInnovation/UCM430299.pdf (ac-
cessed 2016 Mar 30).
47.	Denniston MM, Jiles RB, Drobeniuc J
et al. Chronic hepatitis C virus infec-
tion in the United States, National
Health and Nutrition Examination
Survey 2003 to 2010. Ann Intern Med.
2014; 160:293-300.
48.	American Association for the Study
of Liver Diseases and Infectious
Diseases Society of America. HCV
guidance: recommendations for test-
ing, managing, and treating hepatitis
C (2016). www.hcvguidelines.org
(accessed 2016 Mar 30).
49.	 CentersforMedicareandMedicaid
Services.Medicaiddrugrebateprogram
notice:assuringMedicaidbeneficia-
ries’accesstohepatitisC(HCV)drugs
(November5,2015).www.medicaid.gov/
Medicaid-CHIP-Program-Information/
By-Topics/Benefits/Prescription-Drugs/
Downloads/Rx-Releases/State-Releases/
state-rel-172.pdf(accessed2016Mar30).
50.	Rodriguez-Gutierrez R, Shah ND,
Montori VM. Predicting the overuse
of PCSK-9 inhibitors. JAMA. 2015;
314:1909-10.
51.	EMD Serono. EMD Serono spe-
cialty digest, 11th edition. www.
specialtydigest.emdserono.com/
Digest.aspx (accessed 2016 Feb 1).
52.	Colgan K, Stubbings J, Choudry R,
Knoer S. Developing a specialty phar-
macy strategy: building a successful
business model. Abstract presented
at ASHP Midyear Clinical Meeting.
New Orleans, LA; 2015 Dec.
53.	Ignjatovic T. Biosimilars still to make
an impact in the UK (July 10, 2013).
www.datamonitorhealthcare.com/
biosimilars-still-to-make-an-impact-
in-the-uk/ (accessed 2016 Mar 2).
54.	Pollack A. Drug goes from $13.50
a tablet to $750 overnight (Sep-
tember 20, 2015). www.nytimes.
com/2015/09/21/business/a-huge-
overnight-increase-in-a-drugs-price-
raises-protests.html?_r=0 (accessed
2016 Mar 30).
55.	American Society of Health-System
Pharmacists. ASHP statement for
the record: “developments in the
prescription drug market” (February
4, 2016). www.ashp.org/menu/
Advocacy/FederalIssues/OtherIssues/
ASHP-Statement-for-the-Record-
Developments-in-the-Prescription-
Drug-Market.html (accessed 2016
Mar 2).
56.	Wiske CP, Ogbechie OA, Schulman
KA. Options to promote competitive
generics markets in the United States.
JAMA. 2015; 314:2129-30.
57.	Health Resources and Services
Administration. 340B Drug Pricing
Program omnibus guidance (August
28, 2015). www.federalregister.
gov/articles/2015/08/28/2015-
21246/340b-drug-pricing-program-
omnibus-guidance (accessed 2016
Mar 30).
58.	Hartke PL, Vermeulen LC, Hoffman
JM et al. Accuracy of annual prescrip-
tion drug expenditure forecasts in
AJHP. Am J Health-Syst Pharm. 2015;
72:1642-8.
SPECIAL FEATURE	 PROJECTING FUTURE DRUG EXPENDITURES
e374    AM J HEALTH-SYST PHARM | VOLUME 73 | 2016
59.	Hoffman JM, Shah ND, Vermeulen
LC et al. Projecting future drug
expenditures—2005. Am J Health-
Syst Pharm. 2005; 62:149-67.
60.	American Society of Health-System
Pharmacists. ASHP guidelines on
medication cost management strate-
gies for hospitals and health systems.
Am J Health-Syst Pharm. 2008;
65:1368-84.
61.	Amgen. FDA approves Imlygic
(talimogene laherparepvec) as first
oncolytic viral therapy in the US
(October 27, 2015). www.amgen.
com/media/news-releases/2015/10/
fda-approves-imlygic-talimogene-
laherparepvec-as-first-oncolytic-
viral-therapy-in-the-us/ (accessed
2016 Feb 22).

Weitere ähnliche Inhalte

Was ist angesagt?

A New Approach at Conducting Post-Market Drug Safety Surveillance
A New Approach at Conducting Post-Market Drug Safety SurveillanceA New Approach at Conducting Post-Market Drug Safety Surveillance
A New Approach at Conducting Post-Market Drug Safety SurveillanceArete-Zoe, LLC
 
Prescription Medicines Costs in Context November 2019
Prescription Medicines Costs in Context November 2019Prescription Medicines Costs in Context November 2019
Prescription Medicines Costs in Context November 2019PhRMA
 
Prescription Medicines Costs in Context May 2020
Prescription Medicines Costs in Context May 2020Prescription Medicines Costs in Context May 2020
Prescription Medicines Costs in Context May 2020PhRMA
 
Investigation of the accessibility and affordability of medicines in speciali...
Investigation of the accessibility and affordability of medicines in speciali...Investigation of the accessibility and affordability of medicines in speciali...
Investigation of the accessibility and affordability of medicines in speciali...Cornelis Jan Diepeveen
 
Prescription Medicines Costs in Context October 2020
Prescription Medicines Costs in Context October 2020Prescription Medicines Costs in Context October 2020
Prescription Medicines Costs in Context October 2020PhRMA
 
Measuring the Relationship between Innovative Drugs and AE_2015
Measuring the Relationship between Innovative Drugs and AE_2015Measuring the Relationship between Innovative Drugs and AE_2015
Measuring the Relationship between Innovative Drugs and AE_2015Jonathan Bryan
 
Problems and challenges faced in consumer reporting of adverse drug reactions...
Problems and challenges faced in consumer reporting of adverse drug reactions...Problems and challenges faced in consumer reporting of adverse drug reactions...
Problems and challenges faced in consumer reporting of adverse drug reactions...Mohammed Alshakka
 
Prescription Medicines - Costs in Context - October 2018
Prescription Medicines - Costs in Context - October 2018Prescription Medicines - Costs in Context - October 2018
Prescription Medicines - Costs in Context - October 2018PhRMA
 
How is drug spending affected in the year 2017
How is drug spending affected in the year 2017How is drug spending affected in the year 2017
How is drug spending affected in the year 2017Steve Martin
 
AVAILABILITY OF ESSENTIAL MEDICINES IN THE CZECH REPUBLIC-2017
AVAILABILITY OF ESSENTIAL MEDICINES IN THE CZECH REPUBLIC-2017AVAILABILITY OF ESSENTIAL MEDICINES IN THE CZECH REPUBLIC-2017
AVAILABILITY OF ESSENTIAL MEDICINES IN THE CZECH REPUBLIC-2017Market Research Report Store
 
Prescription Medicines Costs in Context April 2021
Prescription Medicines Costs in Context April 2021Prescription Medicines Costs in Context April 2021
Prescription Medicines Costs in Context April 2021PhRMA
 
Pharmaceutical Supply Chain Integrity and Security (2016)
Pharmaceutical Supply Chain Integrity and Security (2016)Pharmaceutical Supply Chain Integrity and Security (2016)
Pharmaceutical Supply Chain Integrity and Security (2016)Arete-Zoe, LLC
 
Canada and Drug Costs (Pharmacare)| How to reform Drug Policy
Canada and Drug Costs (Pharmacare)| How to reform Drug PolicyCanada and Drug Costs (Pharmacare)| How to reform Drug Policy
Canada and Drug Costs (Pharmacare)| How to reform Drug Policypaul young cpa, cga
 
Cost-Savings Study: Analysis of Health Management Options
Cost-Savings Study: Analysis of Health Management OptionsCost-Savings Study: Analysis of Health Management Options
Cost-Savings Study: Analysis of Health Management OptionsYour Health at Hand
 
Pharmaceutical pricing and reimbursement usa
Pharmaceutical pricing and reimbursement usaPharmaceutical pricing and reimbursement usa
Pharmaceutical pricing and reimbursement usaNeha Kalal
 
Availability of essential medicines in Hungary (2017)
 Availability of essential medicines in Hungary (2017) Availability of essential medicines in Hungary (2017)
Availability of essential medicines in Hungary (2017)Arete-Zoe, LLC
 
Challenges of pharmaceutical industry in 2015
Challenges of pharmaceutical industry in 2015Challenges of pharmaceutical industry in 2015
Challenges of pharmaceutical industry in 2015yahyasultan
 
Principles Of Drug Information 2008
Principles Of Drug Information 2008Principles Of Drug Information 2008
Principles Of Drug Information 2008brosenthal
 

Was ist angesagt? (20)

A New Approach at Conducting Post-Market Drug Safety Surveillance
A New Approach at Conducting Post-Market Drug Safety SurveillanceA New Approach at Conducting Post-Market Drug Safety Surveillance
A New Approach at Conducting Post-Market Drug Safety Surveillance
 
Prescription Medicines Costs in Context November 2019
Prescription Medicines Costs in Context November 2019Prescription Medicines Costs in Context November 2019
Prescription Medicines Costs in Context November 2019
 
New study supports notion of skewed opioid prescribing
New study supports notion of skewed opioid prescribingNew study supports notion of skewed opioid prescribing
New study supports notion of skewed opioid prescribing
 
Prescription Medicines Costs in Context May 2020
Prescription Medicines Costs in Context May 2020Prescription Medicines Costs in Context May 2020
Prescription Medicines Costs in Context May 2020
 
Investigation of the accessibility and affordability of medicines in speciali...
Investigation of the accessibility and affordability of medicines in speciali...Investigation of the accessibility and affordability of medicines in speciali...
Investigation of the accessibility and affordability of medicines in speciali...
 
Prescription Medicines Costs in Context October 2020
Prescription Medicines Costs in Context October 2020Prescription Medicines Costs in Context October 2020
Prescription Medicines Costs in Context October 2020
 
Measuring the Relationship between Innovative Drugs and AE_2015
Measuring the Relationship between Innovative Drugs and AE_2015Measuring the Relationship between Innovative Drugs and AE_2015
Measuring the Relationship between Innovative Drugs and AE_2015
 
Problems and challenges faced in consumer reporting of adverse drug reactions...
Problems and challenges faced in consumer reporting of adverse drug reactions...Problems and challenges faced in consumer reporting of adverse drug reactions...
Problems and challenges faced in consumer reporting of adverse drug reactions...
 
Prescription Medicines - Costs in Context - October 2018
Prescription Medicines - Costs in Context - October 2018Prescription Medicines - Costs in Context - October 2018
Prescription Medicines - Costs in Context - October 2018
 
How is drug spending affected in the year 2017
How is drug spending affected in the year 2017How is drug spending affected in the year 2017
How is drug spending affected in the year 2017
 
AVAILABILITY OF ESSENTIAL MEDICINES IN THE CZECH REPUBLIC-2017
AVAILABILITY OF ESSENTIAL MEDICINES IN THE CZECH REPUBLIC-2017AVAILABILITY OF ESSENTIAL MEDICINES IN THE CZECH REPUBLIC-2017
AVAILABILITY OF ESSENTIAL MEDICINES IN THE CZECH REPUBLIC-2017
 
Prescription Medicines Costs in Context April 2021
Prescription Medicines Costs in Context April 2021Prescription Medicines Costs in Context April 2021
Prescription Medicines Costs in Context April 2021
 
Pharmaceutical Supply Chain Integrity and Security (2016)
Pharmaceutical Supply Chain Integrity and Security (2016)Pharmaceutical Supply Chain Integrity and Security (2016)
Pharmaceutical Supply Chain Integrity and Security (2016)
 
Canada and Drug Costs (Pharmacare)| How to reform Drug Policy
Canada and Drug Costs (Pharmacare)| How to reform Drug PolicyCanada and Drug Costs (Pharmacare)| How to reform Drug Policy
Canada and Drug Costs (Pharmacare)| How to reform Drug Policy
 
Cost-Savings Study: Analysis of Health Management Options
Cost-Savings Study: Analysis of Health Management OptionsCost-Savings Study: Analysis of Health Management Options
Cost-Savings Study: Analysis of Health Management Options
 
Pharmaceutical pricing and reimbursement usa
Pharmaceutical pricing and reimbursement usaPharmaceutical pricing and reimbursement usa
Pharmaceutical pricing and reimbursement usa
 
Availability of essential medicines in Hungary (2017)
 Availability of essential medicines in Hungary (2017) Availability of essential medicines in Hungary (2017)
Availability of essential medicines in Hungary (2017)
 
Challenges of pharmaceutical industry in 2015
Challenges of pharmaceutical industry in 2015Challenges of pharmaceutical industry in 2015
Challenges of pharmaceutical industry in 2015
 
Strong Medicine
Strong MedicineStrong Medicine
Strong Medicine
 
Principles Of Drug Information 2008
Principles Of Drug Information 2008Principles Of Drug Information 2008
Principles Of Drug Information 2008
 

Andere mochten auch

Sustaining Gift-ALAC
Sustaining Gift-ALACSustaining Gift-ALAC
Sustaining Gift-ALACSusan Parini
 
Home Matters - Drone Safety
Home Matters - Drone SafetyHome Matters - Drone Safety
Home Matters - Drone SafetyNicholas Toscano
 
Ipa kelas 3 bab ii
Ipa kelas 3 bab iiIpa kelas 3 bab ii
Ipa kelas 3 bab iiNaylilizza
 
Consumer insights-tools-google-brandlab-b
Consumer insights-tools-google-brandlab-bConsumer insights-tools-google-brandlab-b
Consumer insights-tools-google-brandlab-bGeorgi Daskalov
 
Getting cytisine licensed for use world-wide: a call to action
Getting cytisine licensed for use world-wide: a call to actionGetting cytisine licensed for use world-wide: a call to action
Getting cytisine licensed for use world-wide: a call to actionGeorgi Daskalov
 
Mm henry danger_17_br (1)
Mm henry danger_17_br (1)Mm henry danger_17_br (1)
Mm henry danger_17_br (1)Meio & Mensagem
 
Mm shimmer shine_17_br (1)
Mm shimmer shine_17_br (1)Mm shimmer shine_17_br (1)
Mm shimmer shine_17_br (1)Meio & Mensagem
 
Mm padrinhos mágicos_17_br
Mm padrinhos mágicos_17_brMm padrinhos mágicos_17_br
Mm padrinhos mágicos_17_brMeio & Mensagem
 
Mm tartarugas ninjas 17_br (2)
Mm tartarugas ninjas 17_br (2)Mm tartarugas ninjas 17_br (2)
Mm tartarugas ninjas 17_br (2)Meio & Mensagem
 

Andere mochten auch (13)

Sustaining Gift-ALAC
Sustaining Gift-ALACSustaining Gift-ALAC
Sustaining Gift-ALAC
 
My peach branches
My peach branchesMy peach branches
My peach branches
 
My pottery design ideas
My pottery design ideasMy pottery design ideas
My pottery design ideas
 
Home Matters - Drone Safety
Home Matters - Drone SafetyHome Matters - Drone Safety
Home Matters - Drone Safety
 
Ipa kelas 3 bab ii
Ipa kelas 3 bab iiIpa kelas 3 bab ii
Ipa kelas 3 bab ii
 
Consumer insights-tools-google-brandlab-b
Consumer insights-tools-google-brandlab-bConsumer insights-tools-google-brandlab-b
Consumer insights-tools-google-brandlab-b
 
La planificación
La planificaciónLa planificación
La planificación
 
Getting cytisine licensed for use world-wide: a call to action
Getting cytisine licensed for use world-wide: a call to actionGetting cytisine licensed for use world-wide: a call to action
Getting cytisine licensed for use world-wide: a call to action
 
Consolidação Mic&Mac Soluções em TI
Consolidação Mic&Mac Soluções em TIConsolidação Mic&Mac Soluções em TI
Consolidação Mic&Mac Soluções em TI
 
Mm henry danger_17_br (1)
Mm henry danger_17_br (1)Mm henry danger_17_br (1)
Mm henry danger_17_br (1)
 
Mm shimmer shine_17_br (1)
Mm shimmer shine_17_br (1)Mm shimmer shine_17_br (1)
Mm shimmer shine_17_br (1)
 
Mm padrinhos mágicos_17_br
Mm padrinhos mágicos_17_brMm padrinhos mágicos_17_br
Mm padrinhos mágicos_17_br
 
Mm tartarugas ninjas 17_br (2)
Mm tartarugas ninjas 17_br (2)Mm tartarugas ninjas 17_br (2)
Mm tartarugas ninjas 17_br (2)
 

Ähnlich wie National trends..

Prescription Medicines - Costs in Context - September 2018
Prescription Medicines - Costs in Context - September 2018Prescription Medicines - Costs in Context - September 2018
Prescription Medicines - Costs in Context - September 2018PhRMA
 
Prescription Medicines - Costs in Context - September 2018
Prescription Medicines - Costs in Context - September 2018Prescription Medicines - Costs in Context - September 2018
Prescription Medicines - Costs in Context - September 2018PhRMA
 
Ims global use_of_meds_report_2013
 Ims global use_of_meds_report_2013 Ims global use_of_meds_report_2013
Ims global use_of_meds_report_2013Utai Sukviwatsirikul
 
Medicines outlook through_2016_report (1)
Medicines outlook through_2016_report (1)Medicines outlook through_2016_report (1)
Medicines outlook through_2016_report (1)Juan Manuel Santa Maria
 
Medicines outlook through_2016_report
Medicines outlook through_2016_reportMedicines outlook through_2016_report
Medicines outlook through_2016_reportUtai Sukviwatsirikul
 
Iihi us use_of_meds_for_2013
Iihi us use_of_meds_for_2013Iihi us use_of_meds_for_2013
Iihi us use_of_meds_for_2013Georgi Daskalov
 
Medicines Use and Spending Shifts: A Review of the Use of Medicines
Medicines Use and Spending Shifts: A Review of the Use of MedicinesMedicines Use and Spending Shifts: A Review of the Use of Medicines
Medicines Use and Spending Shifts: A Review of the Use of MedicinesIMS Health US
 
Medicines outlook through 2016 report
Medicines outlook through 2016 reportMedicines outlook through 2016 report
Medicines outlook through 2016 reportAtef Khayat, MD, MBA
 
Medicines outlook through_2016_report
Medicines outlook through_2016_reportMedicines outlook through_2016_report
Medicines outlook through_2016_reportUtai Sukviwatsirikul
 
White Paper: Best Practices for Medical Benefit Management (MBM)
White Paper: Best Practices for Medical Benefit Management (MBM)White Paper: Best Practices for Medical Benefit Management (MBM)
White Paper: Best Practices for Medical Benefit Management (MBM)Tai Freligh
 
The economic burden of prescription opioid overdose... 2013.
The economic burden of prescription opioid overdose... 2013.The economic burden of prescription opioid overdose... 2013.
The economic burden of prescription opioid overdose... 2013.Paul Coelho, MD
 
Changes in Provider Prescribing Patterns After Implementation of an Emergency...
Changes in Provider Prescribing Patterns After Implementation of an Emergency...Changes in Provider Prescribing Patterns After Implementation of an Emergency...
Changes in Provider Prescribing Patterns After Implementation of an Emergency...Virginia Mason Internal Medicine Residency
 
Harm reduction on a large scale
Harm reduction on a large scaleHarm reduction on a large scale
Harm reduction on a large scalePaul Coelho, MD
 
Cadth 2015 b5 symposium oral - cost-drivers in public drug plans in canada
Cadth 2015 b5 symposium   oral - cost-drivers in public drug plans in canadaCadth 2015 b5 symposium   oral - cost-drivers in public drug plans in canada
Cadth 2015 b5 symposium oral - cost-drivers in public drug plans in canadaCADTH Symposium
 
COMMUNITY PHARMACY PRESENTATION FINAL.pptx
COMMUNITY PHARMACY PRESENTATION FINAL.pptxCOMMUNITY PHARMACY PRESENTATION FINAL.pptx
COMMUNITY PHARMACY PRESENTATION FINAL.pptxsardarjarrar
 
Prescription Medicines Costs in Context July 2021
Prescription Medicines Costs in Context July 2021Prescription Medicines Costs in Context July 2021
Prescription Medicines Costs in Context July 2021PhRMA
 
Genoa Pharmacy Med adherence & outcomes study
Genoa Pharmacy Med adherence & outcomes studyGenoa Pharmacy Med adherence & outcomes study
Genoa Pharmacy Med adherence & outcomes studyJohn Muilenburg
 
Pharmaceutical Industry Analytics
Pharmaceutical Industry AnalyticsPharmaceutical Industry Analytics
Pharmaceutical Industry AnalyticsJatin Arora
 

Ähnlich wie National trends.. (20)

Prescription Medicines - Costs in Context - September 2018
Prescription Medicines - Costs in Context - September 2018Prescription Medicines - Costs in Context - September 2018
Prescription Medicines - Costs in Context - September 2018
 
Prescription Medicines - Costs in Context - September 2018
Prescription Medicines - Costs in Context - September 2018Prescription Medicines - Costs in Context - September 2018
Prescription Medicines - Costs in Context - September 2018
 
Ims global use_of_meds_report_2013
 Ims global use_of_meds_report_2013 Ims global use_of_meds_report_2013
Ims global use_of_meds_report_2013
 
Medicines outlook through_2016_report (1)
Medicines outlook through_2016_report (1)Medicines outlook through_2016_report (1)
Medicines outlook through_2016_report (1)
 
Medicines outlook through_2016_report
Medicines outlook through_2016_reportMedicines outlook through_2016_report
Medicines outlook through_2016_report
 
Iihi us use_of_meds_for_2013
Iihi us use_of_meds_for_2013Iihi us use_of_meds_for_2013
Iihi us use_of_meds_for_2013
 
Medicines Use and Spending Shifts: A Review of the Use of Medicines
Medicines Use and Spending Shifts: A Review of the Use of MedicinesMedicines Use and Spending Shifts: A Review of the Use of Medicines
Medicines Use and Spending Shifts: A Review of the Use of Medicines
 
IMS Global Pharma Outlook 2016
IMS Global Pharma Outlook 2016IMS Global Pharma Outlook 2016
IMS Global Pharma Outlook 2016
 
Medicines outlook through 2016 report
Medicines outlook through 2016 reportMedicines outlook through 2016 report
Medicines outlook through 2016 report
 
Medicines outlook through_2016_report
Medicines outlook through_2016_reportMedicines outlook through_2016_report
Medicines outlook through_2016_report
 
White Paper: Best Practices for Medical Benefit Management (MBM)
White Paper: Best Practices for Medical Benefit Management (MBM)White Paper: Best Practices for Medical Benefit Management (MBM)
White Paper: Best Practices for Medical Benefit Management (MBM)
 
The economic burden of prescription opioid overdose... 2013.
The economic burden of prescription opioid overdose... 2013.The economic burden of prescription opioid overdose... 2013.
The economic burden of prescription opioid overdose... 2013.
 
Changes in Provider Prescribing Patterns After Implementation of an Emergency...
Changes in Provider Prescribing Patterns After Implementation of an Emergency...Changes in Provider Prescribing Patterns After Implementation of an Emergency...
Changes in Provider Prescribing Patterns After Implementation of an Emergency...
 
Harm reduction on a large scale
Harm reduction on a large scaleHarm reduction on a large scale
Harm reduction on a large scale
 
Cadth 2015 b5 symposium oral - cost-drivers in public drug plans in canada
Cadth 2015 b5 symposium   oral - cost-drivers in public drug plans in canadaCadth 2015 b5 symposium   oral - cost-drivers in public drug plans in canada
Cadth 2015 b5 symposium oral - cost-drivers in public drug plans in canada
 
China
ChinaChina
China
 
COMMUNITY PHARMACY PRESENTATION FINAL.pptx
COMMUNITY PHARMACY PRESENTATION FINAL.pptxCOMMUNITY PHARMACY PRESENTATION FINAL.pptx
COMMUNITY PHARMACY PRESENTATION FINAL.pptx
 
Prescription Medicines Costs in Context July 2021
Prescription Medicines Costs in Context July 2021Prescription Medicines Costs in Context July 2021
Prescription Medicines Costs in Context July 2021
 
Genoa Pharmacy Med adherence & outcomes study
Genoa Pharmacy Med adherence & outcomes studyGenoa Pharmacy Med adherence & outcomes study
Genoa Pharmacy Med adherence & outcomes study
 
Pharmaceutical Industry Analytics
Pharmaceutical Industry AnalyticsPharmaceutical Industry Analytics
Pharmaceutical Industry Analytics
 

Mehr von Georgi Daskalov

2006 a space oddity – the great pluto debate science _ the guardian
2006  a space oddity – the great pluto debate   science _ the guardian2006  a space oddity – the great pluto debate   science _ the guardian
2006 a space oddity – the great pluto debate science _ the guardianGeorgi Daskalov
 
Evaluation of the efficacy and safety of tribulus terrestris in male sexual d...
Evaluation of the efficacy and safety of tribulus terrestris in male sexual d...Evaluation of the efficacy and safety of tribulus terrestris in male sexual d...
Evaluation of the efficacy and safety of tribulus terrestris in male sexual d...Georgi Daskalov
 
Syafen broshura pacienti_a5_print_2
Syafen broshura pacienti_a5_print_2Syafen broshura pacienti_a5_print_2
Syafen broshura pacienti_a5_print_2Georgi Daskalov
 
Lifecycle mgmt-pharmaceutical-bwp-070014
Lifecycle mgmt-pharmaceutical-bwp-070014Lifecycle mgmt-pharmaceutical-bwp-070014
Lifecycle mgmt-pharmaceutical-bwp-070014Georgi Daskalov
 
Extreme trans neptunian objects and the kozai mechanism
Extreme trans neptunian objects and the kozai mechanismExtreme trans neptunian objects and the kozai mechanism
Extreme trans neptunian objects and the kozai mechanismGeorgi Daskalov
 
Some In Vitro/In Vivo Chemically-Induced Experimental Models of Liver Oxidati...
Some In Vitro/In Vivo Chemically-Induced Experimental Models of Liver Oxidati...Some In Vitro/In Vivo Chemically-Induced Experimental Models of Liver Oxidati...
Some In Vitro/In Vivo Chemically-Induced Experimental Models of Liver Oxidati...Georgi Daskalov
 
Gphc eea pharmacist_standard_information_pack_april_2015
Gphc eea pharmacist_standard_information_pack_april_2015Gphc eea pharmacist_standard_information_pack_april_2015
Gphc eea pharmacist_standard_information_pack_april_2015Georgi Daskalov
 
Marketing and promotion_facts_071108_final
Marketing and promotion_facts_071108_finalMarketing and promotion_facts_071108_final
Marketing and promotion_facts_071108_finalGeorgi Daskalov
 
Product lifecycle management in the pharmaceutical industry
Product lifecycle management in the pharmaceutical industryProduct lifecycle management in the pharmaceutical industry
Product lifecycle management in the pharmaceutical industryGeorgi Daskalov
 
Health-care interventions to promote and assist tobacco cessation: a review o...
Health-care interventions to promote and assist tobacco cessation: a review o...Health-care interventions to promote and assist tobacco cessation: a review o...
Health-care interventions to promote and assist tobacco cessation: a review o...Georgi Daskalov
 
http://www.lse.ac.uk/LSEHealthAndSocialCare/pdf/eurohealth/Vol14No3/Bond.pdfBond
http://www.lse.ac.uk/LSEHealthAndSocialCare/pdf/eurohealth/Vol14No3/Bond.pdfBondhttp://www.lse.ac.uk/LSEHealthAndSocialCare/pdf/eurohealth/Vol14No3/Bond.pdfBond
http://www.lse.ac.uk/LSEHealthAndSocialCare/pdf/eurohealth/Vol14No3/Bond.pdfBondGeorgi Daskalov
 
The rising tide_of_otc_europe
The rising tide_of_otc_europeThe rising tide_of_otc_europe
The rising tide_of_otc_europeGeorgi Daskalov
 
Acute activation, desensitization and smoldering activation of human acetylch...
Acute activation, desensitization and smoldering activation of human acetylch...Acute activation, desensitization and smoldering activation of human acetylch...
Acute activation, desensitization and smoldering activation of human acetylch...Georgi Daskalov
 
Hysiologie, biologie, anatomie u. morphologie. gruérin, p v. recherches sur l...
Hysiologie, biologie, anatomie u. morphologie. gruérin, p v. recherches sur l...Hysiologie, biologie, anatomie u. morphologie. gruérin, p v. recherches sur l...
Hysiologie, biologie, anatomie u. morphologie. gruérin, p v. recherches sur l...Georgi Daskalov
 
cytisine and lobeline 1974
cytisine and lobeline 1974cytisine and lobeline 1974
cytisine and lobeline 1974Georgi Daskalov
 

Mehr von Georgi Daskalov (20)

2006 a space oddity – the great pluto debate science _ the guardian
2006  a space oddity – the great pluto debate   science _ the guardian2006  a space oddity – the great pluto debate   science _ the guardian
2006 a space oddity – the great pluto debate science _ the guardian
 
Evaluation of the efficacy and safety of tribulus terrestris in male sexual d...
Evaluation of the efficacy and safety of tribulus terrestris in male sexual d...Evaluation of the efficacy and safety of tribulus terrestris in male sexual d...
Evaluation of the efficacy and safety of tribulus terrestris in male sexual d...
 
Syafen broshura pacienti_a5_print_2
Syafen broshura pacienti_a5_print_2Syafen broshura pacienti_a5_print_2
Syafen broshura pacienti_a5_print_2
 
Lifecycle mgmt-pharmaceutical-bwp-070014
Lifecycle mgmt-pharmaceutical-bwp-070014Lifecycle mgmt-pharmaceutical-bwp-070014
Lifecycle mgmt-pharmaceutical-bwp-070014
 
THERAPY INDEX
THERAPY INDEXTHERAPY INDEX
THERAPY INDEX
 
Extreme trans neptunian objects and the kozai mechanism
Extreme trans neptunian objects and the kozai mechanismExtreme trans neptunian objects and the kozai mechanism
Extreme trans neptunian objects and the kozai mechanism
 
Some In Vitro/In Vivo Chemically-Induced Experimental Models of Liver Oxidati...
Some In Vitro/In Vivo Chemically-Induced Experimental Models of Liver Oxidati...Some In Vitro/In Vivo Chemically-Induced Experimental Models of Liver Oxidati...
Some In Vitro/In Vivo Chemically-Induced Experimental Models of Liver Oxidati...
 
Gphc eea pharmacist_standard_information_pack_april_2015
Gphc eea pharmacist_standard_information_pack_april_2015Gphc eea pharmacist_standard_information_pack_april_2015
Gphc eea pharmacist_standard_information_pack_april_2015
 
Marketing and promotion_facts_071108_final
Marketing and promotion_facts_071108_finalMarketing and promotion_facts_071108_final
Marketing and promotion_facts_071108_final
 
Product lifecycle management in the pharmaceutical industry
Product lifecycle management in the pharmaceutical industryProduct lifecycle management in the pharmaceutical industry
Product lifecycle management in the pharmaceutical industry
 
Ufo1
Ufo1Ufo1
Ufo1
 
Ufo1
Ufo1Ufo1
Ufo1
 
Health-care interventions to promote and assist tobacco cessation: a review o...
Health-care interventions to promote and assist tobacco cessation: a review o...Health-care interventions to promote and assist tobacco cessation: a review o...
Health-care interventions to promote and assist tobacco cessation: a review o...
 
http://www.lse.ac.uk/LSEHealthAndSocialCare/pdf/eurohealth/Vol14No3/Bond.pdfBond
http://www.lse.ac.uk/LSEHealthAndSocialCare/pdf/eurohealth/Vol14No3/Bond.pdfBondhttp://www.lse.ac.uk/LSEHealthAndSocialCare/pdf/eurohealth/Vol14No3/Bond.pdfBond
http://www.lse.ac.uk/LSEHealthAndSocialCare/pdf/eurohealth/Vol14No3/Bond.pdfBond
 
The rising tide_of_otc_europe
The rising tide_of_otc_europeThe rising tide_of_otc_europe
The rising tide_of_otc_europe
 
Acute activation, desensitization and smoldering activation of human acetylch...
Acute activation, desensitization and smoldering activation of human acetylch...Acute activation, desensitization and smoldering activation of human acetylch...
Acute activation, desensitization and smoldering activation of human acetylch...
 
R Greinwald
R GreinwaldR Greinwald
R Greinwald
 
Hysiologie, biologie, anatomie u. morphologie. gruérin, p v. recherches sur l...
Hysiologie, biologie, anatomie u. morphologie. gruérin, p v. recherches sur l...Hysiologie, biologie, anatomie u. morphologie. gruérin, p v. recherches sur l...
Hysiologie, biologie, anatomie u. morphologie. gruérin, p v. recherches sur l...
 
cytisine and lobeline 1974
cytisine and lobeline 1974cytisine and lobeline 1974
cytisine and lobeline 1974
 
главная
главнаяглавная
главная
 

Kürzlich hochgeladen

Call Girls in Tughlakabad Delhi 9654467111 Shot 2000 Night 7000
Call Girls in Tughlakabad Delhi 9654467111 Shot 2000 Night 7000Call Girls in Tughlakabad Delhi 9654467111 Shot 2000 Night 7000
Call Girls in Tughlakabad Delhi 9654467111 Shot 2000 Night 7000Sapana Sha
 
83778-876O7, Cash On Delivery Call Girls In South- EX-(Delhi) Escorts Service...
83778-876O7, Cash On Delivery Call Girls In South- EX-(Delhi) Escorts Service...83778-876O7, Cash On Delivery Call Girls In South- EX-(Delhi) Escorts Service...
83778-876O7, Cash On Delivery Call Girls In South- EX-(Delhi) Escorts Service...dollysharma2066
 
labradorite energetic gems for well beings.pdf
labradorite energetic gems for well beings.pdflabradorite energetic gems for well beings.pdf
labradorite energetic gems for well beings.pdfAkrati jewels inc
 
Unlocking Radiant Skin: The Ultimate Skincare Guide( beyonist)
Unlocking Radiant Skin: The Ultimate Skincare Guide( beyonist)Unlocking Radiant Skin: The Ultimate Skincare Guide( beyonist)
Unlocking Radiant Skin: The Ultimate Skincare Guide( beyonist)beyonistskincare
 
《QUT毕业文凭网-认证昆士兰科技大学毕业证成绩单》
《QUT毕业文凭网-认证昆士兰科技大学毕业证成绩单》《QUT毕业文凭网-认证昆士兰科技大学毕业证成绩单》
《QUT毕业文凭网-认证昆士兰科技大学毕业证成绩单》rnrncn29
 
'the Spring 2024- popular Fashion trends
'the Spring 2024- popular Fashion trends'the Spring 2024- popular Fashion trends
'the Spring 2024- popular Fashion trendsTangledThoughtsCO
 
Uttoxeter & Cheadle Voice, Issue 122.pdf
Uttoxeter & Cheadle Voice, Issue 122.pdfUttoxeter & Cheadle Voice, Issue 122.pdf
Uttoxeter & Cheadle Voice, Issue 122.pdfNoel Sergeant
 
BOOK NIGHT-Call Girls In Noida City Centre Delhi ☎️ 8377877756
BOOK NIGHT-Call Girls In Noida City Centre Delhi ☎️ 8377877756BOOK NIGHT-Call Girls In Noida City Centre Delhi ☎️ 8377877756
BOOK NIGHT-Call Girls In Noida City Centre Delhi ☎️ 8377877756dollysharma2066
 
Call In girls Delhi Safdarjung Enclave/WhatsApp 🔝 97111⇛⇛47426
Call In girls Delhi Safdarjung Enclave/WhatsApp 🔝  97111⇛⇛47426Call In girls Delhi Safdarjung Enclave/WhatsApp 🔝  97111⇛⇛47426
Call In girls Delhi Safdarjung Enclave/WhatsApp 🔝 97111⇛⇛47426jennyeacort
 
8377877756 Full Enjoy @24/7 Call Girls In Mayur Vihar Delhi Ncr
8377877756 Full Enjoy @24/7 Call Girls In Mayur Vihar Delhi Ncr8377877756 Full Enjoy @24/7 Call Girls In Mayur Vihar Delhi Ncr
8377877756 Full Enjoy @24/7 Call Girls In Mayur Vihar Delhi Ncrdollysharma2066
 
8 Easy Ways to Keep Your Heart Healthy this Summer | Amit Kakkar Healthyway
8 Easy Ways to Keep Your Heart Healthy this Summer | Amit Kakkar Healthyway8 Easy Ways to Keep Your Heart Healthy this Summer | Amit Kakkar Healthyway
8 Easy Ways to Keep Your Heart Healthy this Summer | Amit Kakkar HealthywayAmit Kakkar Healthyway
 
Virat Kohli Centuries In Career Age Awards and Facts.pdf
Virat Kohli Centuries In Career Age Awards and Facts.pdfVirat Kohli Centuries In Career Age Awards and Facts.pdf
Virat Kohli Centuries In Career Age Awards and Facts.pdfkigaya33
 
Traditional vs. Modern Parenting: Unveiling the Pros and Cons for Your Child’...
Traditional vs. Modern Parenting: Unveiling the Pros and Cons for Your Child’...Traditional vs. Modern Parenting: Unveiling the Pros and Cons for Your Child’...
Traditional vs. Modern Parenting: Unveiling the Pros and Cons for Your Child’...bluetroyvictorVinay
 
Call Girls in New Friends Colony Delhi 💯Call Us 🔝8264348440🔝
Call Girls in New Friends Colony Delhi 💯Call Us 🔝8264348440🔝Call Girls in New Friends Colony Delhi 💯Call Us 🔝8264348440🔝
Call Girls in New Friends Colony Delhi 💯Call Us 🔝8264348440🔝soniya singh
 

Kürzlich hochgeladen (16)

Call Girls in Tughlakabad Delhi 9654467111 Shot 2000 Night 7000
Call Girls in Tughlakabad Delhi 9654467111 Shot 2000 Night 7000Call Girls in Tughlakabad Delhi 9654467111 Shot 2000 Night 7000
Call Girls in Tughlakabad Delhi 9654467111 Shot 2000 Night 7000
 
83778-876O7, Cash On Delivery Call Girls In South- EX-(Delhi) Escorts Service...
83778-876O7, Cash On Delivery Call Girls In South- EX-(Delhi) Escorts Service...83778-876O7, Cash On Delivery Call Girls In South- EX-(Delhi) Escorts Service...
83778-876O7, Cash On Delivery Call Girls In South- EX-(Delhi) Escorts Service...
 
labradorite energetic gems for well beings.pdf
labradorite energetic gems for well beings.pdflabradorite energetic gems for well beings.pdf
labradorite energetic gems for well beings.pdf
 
Unlocking Radiant Skin: The Ultimate Skincare Guide( beyonist)
Unlocking Radiant Skin: The Ultimate Skincare Guide( beyonist)Unlocking Radiant Skin: The Ultimate Skincare Guide( beyonist)
Unlocking Radiant Skin: The Ultimate Skincare Guide( beyonist)
 
《QUT毕业文凭网-认证昆士兰科技大学毕业证成绩单》
《QUT毕业文凭网-认证昆士兰科技大学毕业证成绩单》《QUT毕业文凭网-认证昆士兰科技大学毕业证成绩单》
《QUT毕业文凭网-认证昆士兰科技大学毕业证成绩单》
 
'the Spring 2024- popular Fashion trends
'the Spring 2024- popular Fashion trends'the Spring 2024- popular Fashion trends
'the Spring 2024- popular Fashion trends
 
Stunning ➥8448380779▻ Call Girls In Jasola Vihar Delhi NCR
Stunning ➥8448380779▻ Call Girls In Jasola Vihar Delhi NCRStunning ➥8448380779▻ Call Girls In Jasola Vihar Delhi NCR
Stunning ➥8448380779▻ Call Girls In Jasola Vihar Delhi NCR
 
Uttoxeter & Cheadle Voice, Issue 122.pdf
Uttoxeter & Cheadle Voice, Issue 122.pdfUttoxeter & Cheadle Voice, Issue 122.pdf
Uttoxeter & Cheadle Voice, Issue 122.pdf
 
BOOK NIGHT-Call Girls In Noida City Centre Delhi ☎️ 8377877756
BOOK NIGHT-Call Girls In Noida City Centre Delhi ☎️ 8377877756BOOK NIGHT-Call Girls In Noida City Centre Delhi ☎️ 8377877756
BOOK NIGHT-Call Girls In Noida City Centre Delhi ☎️ 8377877756
 
Call In girls Delhi Safdarjung Enclave/WhatsApp 🔝 97111⇛⇛47426
Call In girls Delhi Safdarjung Enclave/WhatsApp 🔝  97111⇛⇛47426Call In girls Delhi Safdarjung Enclave/WhatsApp 🔝  97111⇛⇛47426
Call In girls Delhi Safdarjung Enclave/WhatsApp 🔝 97111⇛⇛47426
 
Call Girls 9953525677 Call Girls In Delhi Call Girls 9953525677 Call Girls In...
Call Girls 9953525677 Call Girls In Delhi Call Girls 9953525677 Call Girls In...Call Girls 9953525677 Call Girls In Delhi Call Girls 9953525677 Call Girls In...
Call Girls 9953525677 Call Girls In Delhi Call Girls 9953525677 Call Girls In...
 
8377877756 Full Enjoy @24/7 Call Girls In Mayur Vihar Delhi Ncr
8377877756 Full Enjoy @24/7 Call Girls In Mayur Vihar Delhi Ncr8377877756 Full Enjoy @24/7 Call Girls In Mayur Vihar Delhi Ncr
8377877756 Full Enjoy @24/7 Call Girls In Mayur Vihar Delhi Ncr
 
8 Easy Ways to Keep Your Heart Healthy this Summer | Amit Kakkar Healthyway
8 Easy Ways to Keep Your Heart Healthy this Summer | Amit Kakkar Healthyway8 Easy Ways to Keep Your Heart Healthy this Summer | Amit Kakkar Healthyway
8 Easy Ways to Keep Your Heart Healthy this Summer | Amit Kakkar Healthyway
 
Virat Kohli Centuries In Career Age Awards and Facts.pdf
Virat Kohli Centuries In Career Age Awards and Facts.pdfVirat Kohli Centuries In Career Age Awards and Facts.pdf
Virat Kohli Centuries In Career Age Awards and Facts.pdf
 
Traditional vs. Modern Parenting: Unveiling the Pros and Cons for Your Child’...
Traditional vs. Modern Parenting: Unveiling the Pros and Cons for Your Child’...Traditional vs. Modern Parenting: Unveiling the Pros and Cons for Your Child’...
Traditional vs. Modern Parenting: Unveiling the Pros and Cons for Your Child’...
 
Call Girls in New Friends Colony Delhi 💯Call Us 🔝8264348440🔝
Call Girls in New Friends Colony Delhi 💯Call Us 🔝8264348440🔝Call Girls in New Friends Colony Delhi 💯Call Us 🔝8264348440🔝
Call Girls in New Friends Colony Delhi 💯Call Us 🔝8264348440🔝
 

National trends..

  • 1. PROJECTING FUTURE DRUG EXPENDITURES SPECIAL FEATURE AM J HEALTH-SYST PHARM | VOLUME 73 | 2016  e357 National trends in prescription drug expenditures and projections for 2016 Glen T. Schumock, Pharm.D., M.B.A., Ph.D., FCCP, Department of Pharmacy Systems, Outcomes and Policy, College of Pharmacy, University of Illinois at Chicago, Chicago, IL. Edward C. Li, Pharm.D., M.P.H., BCOP, Department of Pharmacy Practice, College of Pharmacy, University of New England, Portland, ME. Katie J. Suda, Pharm.D., M.S., Department of Veterans Affairs, Center of Innovation for Complex Chronic Healthcare, Edwards Hines Jr. VA Hospital, Hines, IL, and Department of Pharmacy Systems, Outcomes and Policy, College of Pharmacy, University of Illinois at Chicago, Chicago, IL. Michelle D. Wiest, Pharm.D., BCPS, FASHP, UC Health, Cincinnati, OH, and James L. Winkle College of Pharmacy, University of Cincinnati, Cincinnati, OH. JoAnn Stubbings, B.S.Pharm., M.H.C.A., Department of Pharmacy Systems, Outcomes and Policy, College of Pharmacy, University of Illinois at Chicago, Chicago, IL. Linda M. Matusiak, B.A., IMS Health, Plymouth Meeting, PA. Robert J. Hunkler, M.B.A., IMS Health, Plymouth Meeting, PA. Lee C. Vermeulen, B.S.Pharm., M.S., FCCP, FFIP, Center for Clinical Knowledge Management, UW Health, Madison, WI, and School of Pharmacy, University of Wisconsin, Madison, WI. Address correspondence to Dr. Schumock (schumock@uic.edu). This article will appear in the July 15, 2016, issue of AJHP. DOI 10.2146/ajhp160205 Supplementary material is available with the full text of this article at www.ajhp.org. Purpose. Historical trends and factors likely to influence future pharmaceu- tical expenditures are discussed, and projections are made for drug spend- ing in 2016 in nonfederal hospitals, clinics, and overall (all sectors). Methods. Drug expenditure data through calendar year 2015 were obtained from the IMS Health National Sales Perspectives database and analyzed. Other factors that may influence drug spending in hospitals and clinics in 2016, including new drug approvals and patent expirations, were also re- viewed. Expenditure projections for 2016 were based on a combination of quantitative analyses and expert opinion. Results. Total U.S. prescription sales in the 2015 calendar year were $419.4 billion, which was 11.7% higher than sales in 2014. Prescription expendi- tures in clinics and nonfederal hospitals totaled $56.7 billion (a 15.9% in- crease) and $33.6 billion (a 10.7% increase), respectively, in 2015. In nonfed- eral hospitals, growth in spending was driven primarily by increased prices for existing drugs. The hepatitis C combination drug ledipasvir–sofosbuvir was the top drug overall in terms of 2015 expenditures ($14.3 billion); in both clinics and nonfederal hospitals, infliximab was the top drug. Individual drugs with the greatest increases in expenditures in 2015 were specialty agents and older generics; these agents are likely to continue to influence total spending in 2016. Conclusion. We project an 11–13% increase in total drug expenditures overall in 2016, with a 15–17% increase in clinic spending and a 10–12% increase in hospital spending. Health-system pharmacy leaders should care- fully examine local drug utilization patterns in projecting their own organiza- tion’s drug spending in 2016. Am J Health-Syst Pharm. 2016; 73:e357-73 Recent data show that healthcare spending in the United States in- creased at a faster pace in 2014 than previously. While total spending in- creased 2.9% in 2013, it increased 5.3% in 2014 to a total of $3.03 trillion, or 17.5% of the U.S. gross domestic prod- uct.1 Total healthcare expenditures in 2015 are estimated to have been $3.23 trillion, a 5.3% increase from 2014.2 This growth rate was partially attribut- able to economic recovery and partly due to increased healthcare coverage resulting from the Affordable Care Act (ACA). Nevertheless, at $3.23 trillion annually, the United States outspends all other countries on healthcare. Pharmaceuticals have generally been viewed as a reasonable invest- ment because of the potentially large impact on clinical outcomes and the relatively small amount spent on drugs as a percentage of total healthcare expenditures. While the high rate of growth in pharmaceutical spending in the 1990s and early 2000s was a chal- lenge for pharmacy and health-system leaders, its moderation over the past decade—largely driven by patent expi- rationsandtheincreaseduseofgeneric medications—led to somewhat dimin- ished scrutiny of drug costs. However, recently there has been a dramatic shift, and high drug costs are now a top An audio interview that supplements the informa- tion in this article is avail- able on AJHP’s website at www.ajhpvoices.org. Read- ers can also access this interview through AJHP’s augmented reality (AR) feature by launching the Layar app and scanning this page with their mobile device.
  • 2. SPECIAL FEATURE PROJECTING FUTURE DRUG EXPENDITURES e358    AM J HEALTH-SYST PHARM | VOLUME 73 | 2016 to those used in previous years.10,11 We examined both historical trends in drug expenditures and expected changes in the drug marketplace that may influence drug expenditures in nonfederal hospitals and clinics, in- cluding anticipated new drug approv- als and patent expirations. Data for the analysis of historical trends in expen- ditures were obtained from the IMS Health National Sales Perspectives (NSP) database; data coverage extend- ed through December 31, 2015 (i.e., the most recent available data were used).12 NSP data are derived from a statistically valid audit that projects 100% of the purchases in every major class of trade and distribution chan- nel for prescription pharmaceuticals, nonprescription products, and select self-administered diagnostic prod- ucts in the United States, measuring both unit volume and invoice dollars. The NSP database has been described KEY POINTS • Total prescription sales in the United States in the 2015 cal- endar year were $419.4 billion, which was 11.7% higher than sales in 2014. • Prescription expenditures in nonfederal hospitals in 2015 totaled $33.6 billion (a 10.7% increase from 2014), driven primarily by price increases for existing drugs. • We project that overall pre- scription drug spending will rise by 11–13% in 2016, with increases in the clinic and hospital settings of 15–17% and 10–12%, respectively. • Health-system pharmacists should carefully consider the mix of medications used in their own institution when forecasting drug expenditures for budgetary purposes. concern not just of pharmacists but of the media and the public as well. This was perhaps best illustrated by the case of pyrimethamine (Daraprim). Turing Pharmaceuticals acquired the exclusive marketing rights to pyri- methamine in August 2015 and then raised the price by over 5,000%—from $13.50 to $750 per tablet.3 The public outcry, which included street protests, was inflamed by the brash comments of Turing’s then chief executive offi- cer, Martin Shkreli.4 In fact, pyrimeth- amine is just one of many older drug products that have been subject to huge price increases that typically oc- cur after manufacturer consolidation, drug shortages, or other situations that limit competition. These drugs then become targets for predatory pricing practices, and companies such asVale- ant Pharmaceuticals have apparently pursued this as a business model.5 However, the media and consumer outcry has not been isolated to older drugs.3,6 The $100,000-plus-per-year price tags of new drugs for cancer and hepatitis C infection have also raised enormous concern and have even led to physicians and policymakers weigh- ing in on the matter.7-9 This article describes drug expen- diture trends in 2015, reviews factors likely to influence future drug expen- ditures, and projects drug spending for 2016. Our intent is to provide informa- tion to aid health-system pharmacists and other healthcare leaders in deter- mining how future clinical, regulatory and fiscal changes will affect drug ex- penditures in their own organizations. We examine trends in pharmaceutical expenditures, both generally and by setting (with an emphasis on nonfeder- al hospitals and clinics), that may help predict expenditures in 2016. We also examine other factors that may influ- ence future pharmaceutical spending, including new drugs and newly avail- able generics. Finally, drug expenditure growth for 2016 is predicted for non- federal hospitals, clinics, and overall. Methods The methods used were similar in detail in previous versions of this forecast.10 All drug dosage forms were included in the analysis (except where noted), and drug class groupings were based on IMS Health’s proprietary Uniform System of Classification.13 For all drug expenditure data from NSP, we reported total dollars spent as well as growth, with the latter be- ing the percentage change (increase or decrease) in expenditures from the previous 12 months. All of the analy- ses in this article were based on full- calendar-year data, which was not the case in previous editions of this report. Our historical analysis included data on expenditures across all pharma- ceutical distribution channels (e.g., retail, mail order).Within channels, we categorized factors that drive changes in pharmaceutical expenditures as (1) new products, (2) price inflation, and (3) volume and mix. Definitions of these categories were provided in a previous version of this report.10 We also examined the top medica- tions based on expenditures, as well as the medications with the greatest growth in expenditures from the pre- vious year. In these analyses, expen- ditures for each drug were totaled for all brand and generic products and for the various dosage forms. Because the primary focus of this forecast is drug expenditures in nonfederal hospitals and clinics, we analyzed trends in these sectors in more detail. We also conducted separate analy- ses of selected drug classes thought likely to significantly influence drug spending in hospitals or clinics, includ- ing antimicrobials, with special empha- sis on drugs indicated for treatment of hepatitis C virus (HCV) infection and biosimilars. Antimicrobials were cat- egorized, based on their spectrum of activity, as antibacterials, antifungals, and antivirals. Antivirals were further stratified into antiretrovirals, non-hu- man immunodeficiency virus (HIV)– targeted agents (i.e., not including those targeting HIV), and HCV antivi- rals. HCV antiviral agents included rib- avirin, interferon, telaprevir, simepre- vir, sofosbuvir, boceprevir, daclatasvir,
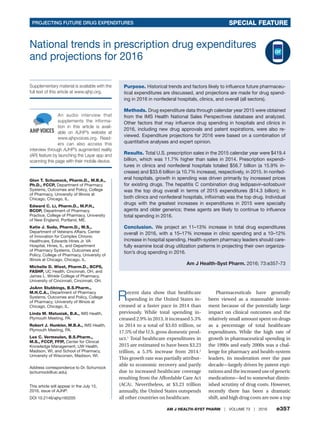
  • 3. PROJECTING FUTURE DRUG EXPENDITURES SPECIAL FEATURE AM J HEALTH-SYST PHARM | VOLUME 73 | 2016  e359 ledipasvir–sofosbuvir, and ombitasvir– paritaprevir–ritonavir (available with or without dasaburvir). The analysis of biosimilars included filgrastim, tbo- filgrastim, and filgrastim-sndz. We as- sessed the impact of tbo-filgrastim and filgrastim-sndz on overall expenditures and units of granulocyte colony-stimu- lating factor (GCSF) products sold from January 2014 through December 2015; one unit was defined as 480 mg, with the number of units sold calculated by dividing the total quarterly expendi- tures of a product by the corresponding quarterly average sales price (ASP) for a 480-mg dose. Drug approvals anticipated in 2016 were reviewed because they are expected to contribute to increased drug expenditures; the methods for this analysis were similar to those described in our 2015 report.11 Infor- mation for new drug approvals was obtained from company websites and the Food and Drug Administra- tion (FDA).14-33 Pharmaceuticals an- ticipated to lose patent protection in 2016 and become available in generic form were reviewed to understand the potential for reducing drug expendi- tures; these products were identified from several sources, including FDA and pharmaceutical company web- sites and pharmaceutical and biotech- nology business news sources.34-36 Ad- ditionally, NSP data on generic drug expenditure trends were analyzed. Special emphasis was placed on ge- neric products likely to have a signifi- cant impact on expenditures for the entire market and those of particular importance in the hospital or clinic setting. Finally, we projected drug expen- diture growth in 2016 for nonfed- eral hospitals, clinics, and all settings combined. These estimates were generated through a combination of quantitative and qualitative analyses but should be viewed as opinions of the authors made in consideration of major factors believed to influence fu- ture drug expenditures, as discussed herein. Projections from other sourc- es were also examined. These inputs were evaluated by the authors, and consensus opinion was reached as to anticipated ranges for drug expendi- ture growth in 2016. Results Historical trends in prescrip- tion expenditures. Total prescrip- tion expenditures in the United States for the 2015 calendar year were $419.4 billion, which was 11.7% higher than total expenditures in 2014. Table 1 shows drug spending in 2015 across each of the various distribution chan- nels and sectors. The retail pharmacy sector continued to account for the largest portion of prescription ex- penditures ($203.8 billion, or 48.6% of total expenditures), followed by mail-order pharmacy ($96.7 billion, or 23.0% of total expenditures), clinics ($56.7 billion, or 13.5% of total expen- ditures), nonfederal hospitals ($33.6 billion, or 8.0% of total expenditures), and long-term care ($16.5 billion, or 3.9% of total expenditures). Among these top sectors, mail-order pharma- cies had the largest percent growth from the previous year (18.9%), which was also the case in 2014. Clinics and nonfederal hospitals also experienced double-digit growth in 2015 (15.9% and 10.7%, respectively). Factors driving growth. The 11.7% growth in overall pharmaceutical expenditures in 2015 resulted from increased prices of existing drugs (8.4%), spending on new drugs (2.7%), and changes in the volume of drug use (0.5%). Factors that drove growth in 2015 differed by sector. For example, in the clinic setting the 15.9% total growth was driven mostly by an in- creased volume of drug use (9.0%), as shown in Table 2, with increased pric- es of existing products and spending on new products contributing 3.8% and 3.1%, respectively. In the clinic environment, the majority of spend- ing ($43.9 billion of $56.7 billion) was for injectable products. However, growth in spending in clinics in 2015 was greater for noninjectables ver- sus injectables—particularly branded noninjectables, which saw a 26.4% increase from 2014. In nonfederal hospitals, the 10.7% increase in drug spending in 2015 was driven primar- ily by increased prices of existing drugs (7.6%); new products and volume changes contributed 2.6% and 0.5%, respectively. As was the case in the clin- ic setting, the majority of spending in hospitals ($24.9 billion of $33.6 billion) in 2015 was for injectable products, but in this setting generics and branded generics saw the largest growth (16.5% and 19.5%, respectively). Trends in overall drug spending. Figure 1 shows the annual changes (in- creases or decreases) in prescription drug expenditures in the United States from 1999 to 2015 in clinics, nonfed- eral hospitals, and all sectors overall. Although erratic, the patterns suggest a general decline in the rate of growth through 2008, followed by a leveling- off period and then a steep increase beginning in 2013. The growth in drug expenditures in 2015 (15.9%, 10.7%, and 11.7% for clinics, for nonfederal hospitals, and overall, respectively) was higher than anticipated.11 Top drugs overall. The top 25 drugs based on expenditures across all sec- tors during the 2015 calendar year are shown in Table 3. The HCV combina- tion drug ledipasvir–sofosbuvir was the top drug, accounting for $14.3 bil- lion in expenditures in 2015. It replaced sofosbuvir (single agent), which was the number 1 drug in 2014 but fell to 24th place in 2015, with a 61.9% year-over- year decline in expenditures (to $3 bil- lion). Adalimumab (at $10.6 billion in expenditures), insulin glargine (at $9.2 billion), and etanercept and rosuvatatin (each at approximately $6.5 billion) rounded out the top 5. Aripiprazole, which became available as a generic in 2015, fell from 2nd to 6th place, with an annual reduction in expenditures of 20.6%. Esomeprazole expenditures dropped 23.0% after the oral product became available as a generic in 2015. Epoetin alfa (–9.1%) and oxycodone (–3.4%) also experienced reductions in expenditures from 2014 levels, which is a continuing trend for both. Among the top 25 drugs by expenditures in 2015,
  • 4. SPECIAL FEATURE PROJECTING FUTURE DRUG EXPENDITURES e360    AM J HEALTH-SYST PHARM | VOLUME 73 | 2016 those with the largest percentage in- creases from 2014 were adalimumab (37.1%), pregabalin (23.4%), and sev- eral insulin products, including insulin detemir (34.8%), insulin aspart (28.8%), and insulin lispro (23.2%). Top drugs in clinics. The top 25 drug products by 2015 expenditures in the clinic setting are listed in Table 4. Table 1. Prescription Drug Expenditures and Growth by Sectora Sectorb 2015 Expenditures ($ Millions) Percent of Total Expenditures Percent Change From 2014 Retail pharmacies 203,802 48.6 8.2 Mail-order pharmacies 96,668 23.0 18.9 Clinics 56,709 13.5 15.9 Nonfederal hospitals 33,580 8.0 10.7 Long-term care 16,495 3.9 2.9 Staff-model HMO 4,766 1.1 25.3 Home healthcare 3,640 0.9 18.4 Federal facilities 2,698 0.6 –2.0 Other 1,083 0.3 14.5 Total 419,440 11.7 a HMO = health maintenance organization. b Retail pharmacies including standalone chain and independent stores, as well as mass merchandisers and food and convenience stores with a licensed pharmacy. Mail-order pharmacies include licensed mail service pharmacies, including both private-sector and federal facilities. Clinics include physician offices and outpatient clinics, including general, family medicine, and specialty clinics covering oncology, nephrology, dialysis, family plan- ning, orthopedics, and urgent care centers. Nonfederal hospitals include all non–federally owned facilities licensed as hospitals, including inpatient treatment and rehabilitation facilities, in addition to general and specialty acute care institutions. Long-term care includes nursing homes and residential care facilities. Staff-model HMO includes closed-panel HMO pharmacies and hospitals, union clinics and pharmacies, and workers’ compensation clinics. Home healthcare includes licensed home health organizations and visiting nurse entities. Federal facilities include Public Health Service and other federal hospitals and U.S. ships at sea (Veterans Health Administration facilities are normally included in the federal facility sector, but data on expenditures were not available after December 31, 2013). Other covers a variety of otherwise unclassified government accounts, as well as entities such as jails, prisons, and veterinary hospitals and clinics. Table 2. Factors Driving Growth of Pharmaceutical Expenditures in Clinics and Nonfederal Hospitals in 2015, by Product Categorya Clinics Nonfederal Hospitals Total Percent Growth Percent Growth Due to Factor Total Percent Growth Percent Growth Due to Factor Product Category New Products Price Volume and Mix New Products Price Volume and Mix All products 15.9 3.1 3.8 9.0 10.7 2.6 7.6 0.5 Injectables 13.9 2.0 3.4 8.5 11.3 2.4 7.3 1.6 Brands 13.9 1.8 3.6 8.5 8.6 1.2 4.2 3.1 Generics 7.3 4.4 –1.7 4.6 16.5 9.1 6.4 1.0 Branded generics 20.3 1.7 6.2 12.5 19.5 0.3 25.7 –6.4 Noninjectables 23.3 7.2 5.3 10.9 9.2 3.4 8.4 –2.6 Brands 26.4 7.9 6.4 12.1 10.4 3.3 11.4 –4.3 Generics 19.5 8.3 –1.0 12.2 15.2 7.4 5.2 2.5 Branded generics 8.1 0.8 6.8 0.5 1.7 0.1 6.8 –5.3 a Total growth comprised growth due to three factors: new products (products that were not on the market during the previous year), primarily newly approved and marketed agents; price (changes in the unit cost of drugs that were on the market in the previous year; and volume and mix (changes in volume of utilization of existing products or changes in utilization patterns [e.g., a shift from one product to another, as when prescribing moves from brand to generic products]).
  • 5. PROJECTING FUTURE DRUG EXPENDITURES SPECIAL FEATURE AM J HEALTH-SYST PHARM | VOLUME 73 | 2016  e361 Figure1.Annualgrowthindrugexpenditures,1999–2015. Nonfederalhospitals Year 15 20 10 5 0 %AnnualChangeinExpenditures 25 30 –5 19.7 15.3 18.1 12.4 12.6 9.3 5.9 8.7 4.05.2 2.7 4.0 1.82.3 13.311.7 14.8 4.9 26.8 9.7 6.2 6.4 5.9 3.8 1.6 2.12.8 1.5 0.8 0.6 3.0 5.5 10.7 26.3 24.6 23.0 21.4 22.5 12.8 13.5 20.9 9.9 1.0 5.1 5.7 8.2 14.5 15.9 19992000200120022003200420052006200720082009201020112012201320142015 TotalexpendituresClinics 1.8 6.0 2.1
  • 6. SPECIAL FEATURE PROJECTING FUTURE DRUG EXPENDITURES e362    AM J HEALTH-SYST PHARM | VOLUME 73 | 2016 Infliximab was the top drug, account- ing for $3.3 billion in expenditures, followed by pegfilgrastim, rituximab, epoetin alfa, and bevacizumab—each accounting for expenditures of $2–3 billion. Among the top 25 drugs in clinics, those with the biggest percent- age increases in expenditures from 2014 to 2015 were pneumococcal vac- cine (73.8%), pertuzumab (47.8%), sevelamer (41.9%), darbepoetin alfa (29.5%), immune globulin (26.9%), and denosumab (20.5%). Among the top 25 drugs in clinics, the only agents with reduced expenditures in 2015 versus 2014 were ranibizumab (–13.4%), epoetin alfa (–9.7%), and pemetrexed. Top drugs in nonfederal hospitals. The top 25 prescription products by 2015 expenditures in the nonfederal hospitalsettingarelistedinTable5.The 5 top-ranked drugs were unchanged from 2014. These were infliximab (with $1.0 billion in expenditures), ritux- imab, pegfilgrastim, immune globulin, and alteplase. Among drugs included in the top 25 for nonfederal hospitals, those with the largest increases in ex- penditures were pneumococcal vac- cine (90.1%), radium-223 (45.3%), tras- tuzumab (22.8%), alteplase (20.8%), and natalizumab (20.6%); drugs with large decreases in expenditures in 2015 were linezolid (–39.4%), bivalirudin (–27.7%), and enoxaparin (–16.7%). The therapeutic drug categories that accounted for the highest per- centages of drug expenditures in non- federal hospitals in 2015 are shown in Table 6. The top 25 categories shown in the table represented 82.7% of all ex- penditures in hospitals. As in the past, antineoplastic agents were the top category, accounting for 17.3% of the drug spend in hospitals. As a class, an- tineoplastic drugs also had significant growth in 2015 (16.6%). Among other categories within the hospital sector with high growth in expenditures in 2015 were hormones (49.9%), cardiac agents (47.8%), antiarthritics (34.6%), vascular agents (32.5%), biologicals (27.0%), and antiviral drugs (26.9%). Trends in antimicrobials. In 2015, $48.4 billion was spent on antimicro- bials across all healthcare sectors, of which 42.8% of the total spend was for antivirals (not including those target- ing HIV), 34.2% was for antiretrovirals, 18.1% was for antibacterials, and 4.9% was for antifungals. Expenditures on antibacterial agents decreased (–5.2%) in 2015, as compared with 2014, while spending on antifungals, antiretrovi- rals, and antivirals increased by 18.8%, 36.0%, and 35.8%, respectively. Almost half (45.3%) of antimicrobial expen- ditures were in retail pharmacies, followed by mail-order pharmacies (29.7%), nonfederal hospitals (9.1%), and clinics (6.9%). The top antimicrobials by expen- ditures in clinics and nonfederal hos- pitals in 2015 are shown in eTable 1 (available at www.ajhp.org). Clinic antimicrobial expenditures increased 6.9% from 2014. In nonfederal hospi- tals, antimicrobial expenditures (in- cluding antivirals and antifungals) in- creased 8.3%. Interestingly, at a period when infections by multidrug-resistant organisms were increasing and new parenteral agents were added to the antibiotic armamentarium, antibacte- rials (as a class) had only a small (1.9%) increase in expenditures. Table 3. Top 25 Drugs by Expenditures Overall in 2015 Druga 2015 Expenditures ($ Thousands) Percent Change From 2014 Ledipasvir–sofosbuvir 14,256,452 . . .b Adalimumab 10,555,712 37.1 Insulin glargine 9,199,002 16.3 Etanercept 6,558,015 13.3 Rosuvastatin 6,415,420 9.3 Aripiprazole 6,364,092 –20.6 Fluticasone salmeterol 5,348,330 1.9 Infliximab 4,983,314 10.7 Esomeprazole 4,581,231 –23.0 Insulin aspart 4,519,650 28.8 Glatiramer 4,493,395 12.1 Pegfilgrastim 4,111,876 7.3 Sitagliptin 4,107,780 18.5 Insulin lispro 3,829,984 23.2 Pregabalin 3,820,486 23.4 Interferon beta-1a 3,750,432 1.1 Rituximab 3,634,107 4.9 Tiotropium bromide 3,573,982 7.2 Insulin detemir 3,558,944 34.8 Dimethyl fumarate 3,469,448 20.0 Bevacizumab 3,137,829 8.8 Epoetin alfa 3,078,543 –9.1 Albuterol 3,051,641 10.2 Sofosbuvir 2,988,767 –61.9 Oxycodone 2,960,431 –3.4 a For each drug listed, the expenditures shown are the total for brand and generic products and for various dosage forms. b Not calculated because product was not available for entire year in 2014.
  • 7. PROJECTING FUTURE DRUG EXPENDITURES SPECIAL FEATURE AM J HEALTH-SYST PHARM | VOLUME 73 | 2016  e363 HCV antivirals as a class continued to experience significant growth in expenditures—an increase of 60.8%, from $11.5 billion in 2014 to $18.4 billion in 2015. Mail-order and retail pharmacies constituted the majority (82.8%) of all HCV agent expenditures, as shown in eTable 2 (available at www.ajhp.org). However, while clinics and nonfederal hospitals accounted for small proportions of HCV antivi- ral expenditures (6.7% and 1.2%, re- spectively) in 2015, spending on those agents in these sectors grew signifi- cantly, by 74.2% and 242.4%, respec- tively. As described previously,11 utili- zation (and thus expenditures) in this class tends to shift rapidly to newer agents. For example, the combination agent ledipasvir–sofosbuvir, which became available in 2014, accounted for the largest portion (77.4%) of HCV antiviral expenditures in 2015. Trends in biosimilars. Data on total expenditures and units sold for each GCSF product on the market in 2014 and 2015 are shown in eFigure 1 (available at www.ajhp.org). During the first quarter of 2014, expenditures for tbo-filgrastim were approximately $11 million, representing 5.0% of to- tal GCSF expenditures. Tbo-filgrastim expenditures grew to approximately $39 million (17.8% of total GCSF ex- penditures) by the last quarter of 2015. Filgrastim-sndz was launched during the last quarter of 2015 and so cap- tured only a small percentage of the market (2.7% of all GCSF expendi- tures). The number of 480-mg units of GCSFs sold was slightly higher in 2015 (2,003,185) than in 2014 (1,979,181), while total expenditures for all GCSF products decreased slightly, from 2014 ($947 million) to 2015 ($915 million). Recent and anticipated drug approvals. Selected novel agents that may receive FDA approval for sale in the United States by the end of 2016 are shown in Table 7. As in recent years, new approvals expected in 2016 are largely specialty products. Agents for treating inflammatory disorders (e.g., rheumatoid arthritis, psoriasis) and viral infections (HIV and HCV in- fections) are well represented in the list of expected approvals in 2016. A relatively low proportion of expected approvals are oncology agents, but it has been more difficult to predict on- cology approvals due to the fact that most of these agents are granted the “breakthrough” designation by FDA and thus have an average approval time of approximately four months.37 For example, there are several agents targeting immune checkpoint PD- L1 (atezolizumab and durvalumab) and cyclin-dependent kinase (CDK) proteins 4 and 6 (abemaciclib) that currently have the FDA breakthrough designation, but the corresponding new drug application or biologics li- cense application has yet to be filed with FDA.30,38,39 It is likely that these agents will be approved in 2016 or early 2017. As in the past, we analyzed recent oncology drug approvals to under- stand the potential impact of these agents on future expenditures. As shown in Table 8, 16 oncology drugs were approved in 2015; data on the ap- Table 4. Top 25 Drugs by Expenditures in Clinics in 2015 Druga 2015 Expenditures ($ Thousands) Percent Change From 2014 Infliximab 3,280,663 11.2 Pegfilgrastim 2,976,527 9.7 Rituximab 2,462,831 3.6 Epoetin alfa 2,456,606 –9.7 Bevacizumab 2,382,695 7.0 Trastuzumab 1,923,290 12.8 Pneumococcal vaccineb 1,815,005 73.8 Ranibizumab 1,522,626 –13.4 Denosumab 1,345,258 20.5 Pemetrexed 949,987 –2.0 Ledipasvir–sofosbuvir 932,428 . . .c Immune globulin 850,967 26.9 Sevelamer 815,945 41.9 Influenza virus vaccines 781,295 4.0 Natalizumab 652,902 13.6 Pertuzumab 646,794 47.8 Darbepoetin alfa 644,625 29.5 Varicella virus vaccine 637,381 0.4 Human papillomavirus vaccine 614,987 12.1 Paclitaxel 593,923 6.4 Nivolumab 577,649 . . . Bendamustine 575,377 7.2 Octreotide 552,099 12.4 Abatacept 540,298 18.7 Bortezomib 496,842 9.1 a For each drug listed, the expenditures shown are the total for brand and generic products and for various dosage forms (unless otherwise indicated). b Includes Prevnar (Wyeth) and Pneumovax (Merck Sharp & Dohme) products. c Not calculated because product was not available for entire year in 2014.
  • 8. SPECIAL FEATURE PROJECTING FUTURE DRUG EXPENDITURES e364    AM J HEALTH-SYST PHARM | VOLUME 73 | 2016 proximate cost for 28 days of therapy, based on average wholesale price, are presented.40 Of note, most of these drugs are indicated for use in treating tumor types with a relatively low in- cidence (e.g., multiple myeloma, thy- roid cancer, soft tissue sarcoma), and most of those used to treat a higher- incidence cancer such as lung cancer are targeted toward patients with a specific genetic mutation; thus, the overall impact of new oncology agents on expenditures may be limited. Fur- ther, 10 of the 16 drugs are oral agents. These are also not likely to raise in- patient expenditures but may have a spending impact at institutions that manage their own specialty pharmacy. Institutions that have a pharmacist- led oral oncology monitoring program may observe an increase in the work- load for adherence and toxicity moni- toring. The anticipated new i.v. agents for treatment of multiple myeloma (daratumumab and elotuzumab) are likely to raise outpatient drug expen- ditures, especially for institutions that have a robust oncology program, be- cause these agents address a previ- ously unmet need. It should be noted that in analyz- ing 2015 drug expenditures, we found that the drugs with the highest per- centage growth in spending tended to be recently released cancer agents. For example, the immune checkpoint inhibitors nivolumab ($764 million in expenditures in 2015) and pem- brolizumab ($393 million in 2015) were among the drugs with the high- est growth increases from 2014. The orally administered CDK4/6 inhibitor palbociclib, used in the treatment of breast cancer, entered the market in early 2015 and quickly rose toward the top of the list of oncology drugs by ex- penditures that year, with $749 million in expenditures. Patent expirations and gener- ics. Generic drugs, including brand- ed generics, continued to capture a significant proportion of the overall drug spend, accounting for 17.3% of injectable drug spending and 30.9% of noninjectable drug spending across all channels in 2015. In the nonfederal hospital sector, generics accounted for 32.7% of drug spending (30.5% of expenditures on injectables and 38.9% of expenditures on noninjectables). In this sector, spending for noninject- ables grew 2.0% for generics and 3.0% for branded generics in 2015, as com- pared with 2014, and this was largely due to increased prices (Table 2). In the clinic setting, generics accounted for 15.9% of spending (13.6% of ex- penditures on injectables and 24.0% of expenditures on noninjectables). Much of the growth in expenditures for generics in clinics was due to in- creased utilization of these agents— although increased prices also con- tributed to spending growth in the case of branded generics. Medications with patent expira- tions in late 2014 or early 2015 were mostly items used in the retail setting; those expirations were thus unlikely to have had a meaningful impact on hos- pital and clinic spending. However, some generics launched in 2015 had a significant impact on spending in nonfederal hospitals; these included bivalirudin and linezolid, for which expenditures were reduced by 27.7% and 39.4%, respectively (Table 5). Ge- Table 5. Top 25 Drugs by Expenditures in Nonfederal Hospitals in 2015 Druga 2015 Expenditures ($ Thousands) Percent Change From 2014 Infliximab 1,044,624 8.1 Rituximab 1,007,033 8.1 Pegfilgrastim 846,688 –1.2 Immune globulin 825,446 –1.2 Alteplase 731,292 20.8 Natalizumab 698,851 20.6 Daptomycin 644,964 –6.1 Bevacizumab 619,684 14.0 Pneumococcal vaccineb 619,468 90.1 Trastuzumab 509,862 22.8 Piperacillin–tazobactam 440,142 11.6 Radium-223 437,472 45.3 Influenza virus vaccine 356,889 10.8 Epoetin alfa 325,962 –1.9 Filgrastim 320,024 –8.1 Bivalirudin 312,217 –27.7 Regadenoson 299,820 0.6 Denosumab 297,575 18.4 Enoxaparin 281,336 –16.7 Albumin 265,580 7.2 Darbepoetin alfa 220,151 –0.4 Pemetrexed 219,543 –5.4 Acetaminophen (i.v. only) 218,605 4.5 Iohexol 216,268 1.8 Linezolid 212,269 –39.4 a For each drug listed, the expenditures shown are the total for brand and generic products and for various dosage forms (unless otherwise indicated). b Includes Prevnar (Wyeth) and Pneumovax (Merck Sharp & Dohme) products.
  • 9. PROJECTING FUTURE DRUG EXPENDITURES SPECIAL FEATURE AM J HEALTH-SYST PHARM | VOLUME 73 | 2016  e365 Table 6. Top 25 Therapeutic Drug Categories by Expenditures in Nonfederal Hospitals in 2015 Drug Category 2015 Expenditures ($ Thousands) Percent Change From 2014 Percent of Total 2015 Expenditures Antineoplastic agents 5,848,224 16.6 17.3 Hemostatic modifiers 3,071,269 0.7 9.1 Antiinfectives, systemic 2,724,544 1.0 8.1 Blood factors 2,029,880 –0.7 6.0 Biologicals 1,845,266 27.0 5.5 Gastrointestinal agents 1,817,896 10.2 5.4 Immunologic agents 1,489,837 19.8 4.4 Antiviral drugs 1,297,264 26.9 3.8 Hospital solutions 1,194,442 1.0 3.5 Respiratory therapy agents 1,132,022 4.7 3.4 Anesthetics 1,101,273 –5.5 3.3 Miscellaneous 1,000,847 7.5 3.0 Diagnostic aids 998,702 1.6 3.0 Analgesics 807,730 2.5 2.4 Psychotherapeutics 806,528 2.1 2.4 Hormones 615,854 49.9 1.8 Vascular agents 608,866 32.5 1.8 Musculoskeletal agents 594,240 15.7 1.8 Cardiac agents 545,775 47.8 1.6 Neurologic disorder drugs 524,528 21.9 1.6 Antiarthritics 472,793 34.6 1.4 Diabetes therapy 412,858 5.8 1.2 Antifungal agents 371,481 10.4 1.1 Ophthalmic preparations 367,374 –0.5 1.1 Enzymes 336,925 5.9 1.0 neric aripiprazole and esomeprazole products contributed to reductions in expenditures across all channels, with 2015 spending declines of 20.6% and 23.0% from 2014 levels, respectively (Table 3). Select branded agents expected to lose patent protection in 2016 are shown in Table 9. Estimating when a patent will expire is complex due to potential litigation, exclusivities, and other factors. However, medications important to drug expenditures in hos- pitals and clinics that could be avail- able in generic versions in 2016 include albuterol sulfate (for delivery via dry powder inhaler), daptomycin, imati- nib, oseltamivir, and rosuvastatin. While the availability of generics usually reduces overall expenditures, recently there have been sharp in- creases in the prices of some generic drugs that have led to growth in ex- penditures. Such increases may be spurred by consolidation of manufac- turers, arbitrary price hikes, or drug shortages. We examined the top 15 generic products with high growth in expenditures in 2015 (Table 10). The 15 drugs listed collectively accounted for an increase in expenditures of $2.4 billion (85.6%) over the previous year. One factor influencing high drug ex- penditure growth for certain generic drugs is the FDA “Unapproved Drugs Initiative,” which targeted for enforce- ment older unapproved products and, as a consequence, reduced the number of manufacturers of some drugs.41 In 2015, this initiative had a drastic im- pact on the prices of and subsequent expenditures on vasopressin, neostig- mine, and hydroxyprogesterone, for which annual spending increased by 697.7%, 409.2%, and 270.9%, respec- tively. Other drugs such as isoprotere- nol, flucytosine, and nitroprusside had dramatic expenditure growth (275.7%, 126.4%, and 112.8%, respectively) due to consolidation of manufacturers. Drug expenditure forecast for 2016. Based on the drug expenditure trends described above, anticipated new drug approvals, expected approv-
  • 10. SPECIAL FEATURE PROJECTING FUTURE DRUG EXPENDITURES e366    AM J HEALTH-SYST PHARM | VOLUME 73 | 2016 Table 7. Selected Drugs and Biologicals That Have Received or May Receive FDA-Approved Labeling in 2016a Drug or Biological Manufacturer Indication Route Quarter and Year of PDUFA Dateb Elbasvir–grazoprevir Merck Chronic hepatitis C (genotypes 1 and 4) Oral Q1 2016 Coagulation factor IX (recombinant), albumin fusion protein CSL Behring Hemophilia B I.V. Q1 2016 Brivaracetam UCB Partial-onset seizures I.V. or oral Q1 2016 Daclizumab high-yield process Biogen and AbbVie Relapsed multiple sclerosis Subcutaneous Q1 2016 Rilpivirine–emtricitabine– enofovir alafenamide Gilead HIV-1 infection (in combination with other HIV antiretroviral agents) Oral Q1 2016 Emtricitabine–tenofovir alafenamide fumarate Gilead HIV-1 infection (in combination with other HIV antiretroviral agents) Oral Q1 2016 Recombinant factor VIII Bayer Hemophilia A I.V. Q1 2016 Eteplirsen Sarepta Therapeutics Duchenne muscular dystrophy amenable to exon 51 skipping I.V. Q1 2016 Defibrotide Jazz Pharmaceuticals Hepatic venoocclusive disease with multiorgan dysfunction after hematopoietic stem cell transplantation I.V. Q1 2016 Safinamide Newron Pharmaceuticals Add-on therapy in early- and mid- to late-stage Parkinson’s disease Oral Q1 2016 Sofosbuvir–velpatasvir Gilead Chronic hepatitis C (genotypes 1–6) Oral Q2 2016 Reslizumab Teva Pharmaceutical Industries Asthma and elevated blood eosinophils inadequately controlled on inhaled corticosteroids I.V. Q2 2016 Obeticholic acid Intercept Primary biliary cholangitis Oral Q2 2016 Lixisenatide Sanofi Adult type 2 diabetes mellitus Subcutaneous Q2 2016 Pimavanserin Acadia Pharmaceuticals Psychosis associated with Parkinson’s disease Oral Q2 2016 Deutetrabenazine Teva Pharmaceutical Industries Chorea associated with Huntington disease Oral Q2 2016 Venetoclax Roche Chronic lymphocytic leukemia Oral Q3 2016 Etelcalcetide Amgen Secondary hyperparathyroidism in chronic kidney disease requiring hemodialysis I.V. Q3 2016 Brodalumab Valeant Pharmaceuticals Moderate-to-severe plaque psoriasis Subcutaneous Q4 2016 Sarilumab Regeneron Pharmaceuticals and Sanofi Moderately to severely active rheumatoid arthritis Subcutaneous Q4 2016 Atezolizumab Roche Locally advanced or metastatic urothelial carcinoma I.V. Q4 2016 Baricitinib Eli Lilly and Company Moderately to severely active rheumatoid arthritis Oral Q1 2017 a FDA = Food and Drug Administration, HIV = human immunodeficiency virus, PDUFA = Prescription Drug User Fee Act, Q = quarter. b Extrapolated based on new drug application submission date and review status (i.e., 10 months for standard review and 6 months for priority review).
  • 11. PROJECTING FUTURE DRUG EXPENDITURES SPECIAL FEATURE AM J HEALTH-SYST PHARM | VOLUME 73 | 2016  e367 als of generic drugs in 2016, and our overall assessment of the impact of an- ticipated changes in the industry, we estimate an overall increase of 11–13% in pharmaceutical expenditures in 2016.We also predict that drug spend- ing in clinics will increase by 15–17% while spending in nonfederal hospi- tals will grow 10–12% in 2016. These estimates for growth are considerably higher than those we have made in the past but consistent with recent trends and other forecasts.2,42 In the hospital environment, we have observed con- sistent increases in growth over the past three years. Factors driving this continued growth, including price increases by manufacturers, are not likely to change in the next year. Fur- ther, while politicians have lamented drug price increases, actual legisla- tion to rein in price hikes has not oc- curred; even if such legislation or bal- lott initiatives were enacted, it would likely not be targeted toward curbing hospital drug expenditures.43 In the clinic setting, expensive new drugs for cancer and specialty medications will drive continued high growth. Discussion Growth in drug expenditures in 2015 in both clinics and nonfederal hospitals continued to be marked by a pattern of steep increases that be- gan in 2013. While the overall growth (i.e., growth in all sectors) was slightly lower in 2015, it was still higher than it had been for most of the past decade. We predict continued high growth in 2016 for prescription drug expen- ditures in clinics, hospitals, and all sectors combined. Our estimates for anticipated growth in 2016 are higher than those of the Centers for Medicare and Medicaid Services (CMS), which has projected that U.S. retail prescrip- tion drug expenditures will increase 6.4% in 2016 and 5.5% in 2018.2,44 Our estimates are also higher than those of Express Scripts, a provider of in- tegrated pharmacy benefit manage- ment services, which projected a 6.8% increase in 2016, followed by increases of 7.3% in 2017 and 8.4% in 2018.45 However, both the CMS and Express Scripts forecasts are specific to retail drug expenditures, whereas ours are focused on drug spending in hospitals and clinics. Table 8. Oncology Agents That Received FDA-Approved Labeling in 2015a Drug Indication Route Approximate Price for 28 Days of Therapy ($)b Alectinib ALK-positive non-small-cell lung cancer Oral 13,800 Cobimetinib BRAF mutation–positive melanoma Oral 7,300 Daratumumab Multiple myeloma I.V. 24,000c Elotuzumab Multiple myeloma I.V. 9,946 Gefitinib Non-small-cell lung cancer involving specific EGFR mutations Oral 8,104 Irinotecan liposome Pancreatic cancer I.V. 10,941 Ixazomib Multiple myeloma Oral 10,404 Lenvatinib Thyroid cancer Oral 24,192 Necitumumab Squamous non-small-cell lung cancer I.V. 12,800 Osimertinib Non-small-cell lung cancer involving specific EGFR mutation Oral 14,280 Palbociclib Breast cancer Oral 12,411 Panobinostat Multiple myeloma Oral 11,733 Sonidegib Basal cell carcinoma Oral 11,267 Talimogene laherparepvec Melanoma Local injection 65,000d Trabectedin Soft tissue sarcoma I.V. 11,232 Trifluridine–tipiracil Colorectal cancer Oral 6,569 a FDA = Food and Drug Administration. b Approximate cost was calculated based on average wholesale price listed in Redbook Online.40 For drugs that are dosed by weight or body surface area, standards of 70 kg and 1.73 m2 (respectively) were used. For talimogene laherparepvec, the price estimate was obtained from the manufacturer.61 c Price per 28 days for the first two months. After the first two months, the price decreases to $12,000 per 28 days for the next four months and to $6,000 per 28 days thereafter. d Price for one course.
  • 12. SPECIAL FEATURE PROJECTING FUTURE DRUG EXPENDITURES e368    AM J HEALTH-SYST PHARM | VOLUME 73 | 2016 Overall spending on drugs in the United States is influenced by many different factors, the most important of which are changes in the economy, the population, and the healthcare system. While the economy is difficult to predict, it has been strengthening for the past several years, and most analysts forecast continued growth. The United States also continues to experience the long-term trend of population aging and the associated increases in healthcare needs and spending. At the same time, while the ACA has been credited for mod- erating growth in healthcare spend- ing, increased access to health insur- ance with prescription coverage has boosted medication expenditures ac- cordingly. These and other factors are expected to contribute to continued growth in drug spending in 2016 and beyond.2 In this article we have analyzed specific drugs and drug classes that contributed to growth in prescription expenditures in 2015 and may be ex- pected to do so in 2016. Much of the recent and projected future growth has been or will be driven by specialty drugs. In 2015, FDA approved 45 novel agents, most of which were specialty drugs.46 New drugs were approved in all major specialty classes in 2015, in- cluding palbociclib for advanced met- astatic breast cancer, secukinumab for plaque psoriasis, daclatasvir for HCV infection, lumacaftor–ivacaftor for cystic fibrosis, and selexipag for pul- monary arterial hypertension. In ad- dition to the focus on complex, chron- ic, or rare diseases, specialty drugs are often high-cost products and may have extensive monitoring, storage, dispensing, administration, patient education, safety, and data reporting requirements. Because the pipeline for specialty drugs is rich and with over 1000 targeted cancer drugs cur- rently in development, we anticipate that these drugs will continue to be a Table 9. Selected Potential Patent Expirations in 2016a Drug Brand Name Indication(s) Abacavir–lamivudine–zidovudine Epzicom HIV infection Abacavir sulfate–lamivudine Trizivir HIV infection Albuterol sulfate (dry powder inhaler) Proair HFA Asthma Amlodipine besylate–olmesartan medoxomil Azor Hypertension Amlodipine–hydrochlorothiazide–olmesartan Tribenzor Hypertension Armodafinil Nuvigil Apnea, narcolepsy Bexarotene Targretin Skin cancer Clindamycin phosphate–tretinoin Ziana Acne Daptomycin Cubicin Infection Darifenacin hydrobromide Enablex Overactive bladder Diclofenac (gel) Solaraze Arthritis, pain Dofetilide Tikosyn Irregular heartbeat Eletriptan hydrobromide Relpax Migraine Ezetimibe Zetia Hyperlipidemia Imatinib mesylate Gleevec Cancer Lopinavir–ritonavir Kaletra HIV infection Mesalamine Asacol HD Ulcerative colitis Metformin Glumetza Diabetes Olmesartan medoxomil Benicar Hypertension Olmesartan medoxomil–hydrochlorothiazide Benicar HCT Hypertension Oseltamivir phosphate Tamiflu Influenza Quetiapine fumarate Seroquel XR Antipsychotic Ritonavir Norvir HIV infection Rosuvastatin calcium Crestor Hypertension Tigecycline Tygacil Infection a HIV = human immunodeficiency virus.
  • 13. PROJECTING FUTURE DRUG EXPENDITURES SPECIAL FEATURE AM J HEALTH-SYST PHARM | VOLUME 73 | 2016  e369 major contributor to drug expenditure growth in 2016 and beyond.45 Among the specialty drugs, those used to treat HCV infection were among the top-ranked agents by ex- penditures in 2015. Clinics and non- federal hospitals accounted for a small portion of total HCV antiviral expenditures but are playing a great- er role in HCV infection treatment due in part to the growth of health system–based specialty pharmacies. While competition from newer HCV drugs is expected to decrease prices, subsequent savings may be offset by increased utilization as new patients with less severe disease are diagnosed and treated. The Centers for Disease Control and Prevention estimates that chronic HCV infection affects 3.2 mil- lion Americans, most of whom have not yet been diagnosed.47 Although payers have attempted to restrict use of these medications to patients with more advanced disease, guidelines from the American Association for the Study of Liver Diseases recommend that all patients with chronic HCV in- fection receive treatment,48 and CMS has warned state Medicaid programs not to unreasonably restrict coverage of effective HCV-targeted treatment.49 Regardless, spending on HCV anti- virals will continue to present an ex- treme challenge for insurers, patients, and healthcare providers. Therapeutic categories that were traditionally dominated by lower-cost generics are also likely to be affected by new specialty drugs in the future. In late 2015, two new biologicals— arilocumab and evolocumab—were approved for the treatment of sub- groups of adults who require ad- ditional lowering of low-density li- poprotein (LDL) cholesterol levels; these drugs target the liver protein PCSK9 (proprotein convertase sub- tilisin/kexin type 9), inactivating it and thereby reducing circulating LDL cholesterol. There is concern about potential overuse of these PCSK9 inhibitors and subsequent high spending.50 As a result, the pay- er community instituted strict prior- authorization criteria and coverage policies. Nevertheless, both products are on the type of steep growth curve that is typical for a highly promoted new product in a novel class. Dur- ing only a short time on the market in 2015, PCSK9 inhibitors accounted for a total of about 4000 filled pre- scriptions in retail and mail-order pharmacies, with expenditures of nearly $6 million for each product.12 As the specialty drug market grows, hospitals and health systems continue to face barriers to access because of manufacturer-instituted restricted distribution channels. Dis- ruptions in continuity of care may occur, adding to administrative bur- dens on pharmacy staff. There is also a trend toward more restricted distribu- tion in which specialty drugs can only be dispensed or administered from a network of one or more specialty pharmacies or infusion centers.51 These restrictions present challenges for health systems, especially those undertaking risk-based global pay- ment or population health initiatives. To address these challenges, some health systems have implemented in- tegrated specialty pharmacy as a new ambulatory care pharmacy practice model, which may include a variety of services such as prior-authorization submissions, medication assistance, medication adherence management, and prescription dispensing and de- livery to patients. Although more than 100 such programs are established or in development in the United States, fewer than 20 are operated by fully ac- credited specialty pharmacies; com- pared with other pharmacy programs, these programs have reported faster prior-authorization approvals, higher medication adherence, and greater patient satisfaction.52 Another increasingly used third- party payer tactic is the site-of-service management strategy for infusion of specialty injectable drugs. Under this approach, health plans restrict pa- tients to a contracted provider of infu- sion services. In 2015, 31% of health plans reported implementation of a site-of-service management strategy, Table 10. Top 15 Older Agents With High Growth in 2015 Expenditures Druga 2015 Expenditures ($ Thousands) Percent Change From 2014 Vasopressin 160,977 697.7 Neostigmine 288,273 409.2 Isoproterenol 219,748 275.7 Hydroxyprogesterone 191,250 270.9 Hydroxychloroquine 506,761 237.6 Flucytosine 49,157 126.4 Flecainide 88,321 123.8 Nitroprusside 218,022 112.8 Allopurinol 180,478 106.2 Metformin 1,383,663 85.8 Pyridostigmine hydroxide 88,318 77.4 Amitriptyline 185,415 77.3 Chlorpromazine 202,104 66.8 Ursodiol 316,091 63.2 Bupropion 1,131,214 12.7 a For each drug listed, the expenditures shown are the total for brand and generic products and for various dosage forms.
  • 14. SPECIAL FEATURE PROJECTING FUTURE DRUG EXPENDITURES e370    AM J HEALTH-SYST PHARM | VOLUME 73 | 2016 with 43% indicating plans to imple- ment one in the next 12 months.51 While site-of-service restrictions may save money for health plans, these programs can disrupt continuity of care and reduce revenue for clinic and hospital pharmacies. Promising to moderate the growth of expenditures in the specialty drug category in the future are biosimi- lars. To date, the only class of drugs with biosimilar product options is the GCSFs. Our analyses show that total expenditures for all GCSF prod- ucts decreased after the market entry of competing products and with the general lowering of prices. This may be due to the significant difference in the ASPs of tbo-filgrastim and filgra- stim. Although tbo-filgrastim is not technically a biosimilar, its ASP de- clined significantly over the past two years (from $405 to $370 per 480-mg unit). By the fourth quarter of 2015, the ASP of tbo-filgrastim was 24% less than that of filgrastim. Further, rising utilization of the less expensive prod- uct (tbo-filgrastim), coupled with the market entry of filgrastim-sndz, led to an increase in the total number of GCSF units sold from 2014 to 2015. The phenomenon of biosimilars in- creasing the total volume of GCSFs sold has also been observed in Europe and may be due to relaxed restrictions on use or increased affordability.53 Increasing patient access to ex- pensive medications was one goal of efforts to expand the availability of biosimilars in the United States. The next biosimilar likely to hit the U.S. market in 2016 is infliximab. Its mar- ket entry (and presumptive ability to moderate expenditure growth in this area) has been hampered by launch delays because of FDA review setbacks and patent challenges. Other drugs for which biosimilar applications have been submitted to FDA include pegfil- grastim, etanercept, and adalimumab. In the hospital setting, an issue that has generated significant concern for health-system pharmacy admini- strators in the past year is high-cost generics. While generic drugs gene- rally continue to have a moderating influence on prescription drug expen- ditures overall, this impact has been lessened by a decline in blockbuster drugs subject to patent expiration and changes in the generic marketplace that influence prices. Substantial price increases for some generic drugs have been observed across dosage forms and widely reported in the lay press.6 Injectable medications with triple- digit price increases include calcito- nin, hydralazine, and vasopressin. A number of oral medications, includ- ing hydroxychloroquine, fluoxetine, atenolol, propranolol, digoxin, ami- triptyline, tetracycline, phytonadione, and captopril, were subjected to mas- sive price increases in the last year. These and other notable cases of massive drug price increases— including that of pyrimethamine mentioned earlier—have led to sub- stantial discussions by politicians about potential solutions.54 On Febru- ary 4, 2016, the House Committee on Oversight and Government Reform held a hearing titled “Developments in the Prescription Drug Market: Over- sight” to investigate the practices of Turing Pharmaceuticals and Valeant Pharmaceuticals. ASHP submitted a statement urging Congress to explore potential policy options and market- based solutions to address the recent trend of dramatic price increases for generic drugs.55 It is unknown to what extent congressional or organizational efforts will influence pharmaceuti- cal company pricing of medications. A viewpoint article published in the Journal of the American Medical Asso- ciation identified three market-based proposals to optimize generic drug cost and availability, which included restricting market entry, encouraging long-term contracts with wholesal- ers, and creating a futures market.56 While efforts to curb price increases in the generic markets are explored, pharmacists need to continue to con- trol costs through proper formulary management tactics such as waste re- duction, implementation of stocking efficiencies, and initiatives to ensure appropriate medication use through adherence to clinical criteria. Another issue with the potential to affect drug expenditures in some health systems is the implementation of major revisions to the federal 340B Drug Pricing Program, which pro- vides discounted drug prices on cov- ered drugs to participating hospitals and other eligible entities. The Health Resources and Services Administra- tion (HRSA) released the 340B Drug Pricing Program omnibus guidance on August 28, 2015.57 The guidance, which touches on every aspect of the 340B program, proposes new criteria for 340B program eligibility for offsite outpatient facilities and clinics that require that each facility be listed on the covered entity’s Medicare cost re- port and provide services that have associated outpatient Medicare costs and charges. These criteria would, if implemented, prohibit the purchase of 340B-covered drugs for offsite cor- rectional facilities, since these facili- ties do not have Medicare charges. The guidance also proposes sweeping changes to the definition of a patient and requires that patients receive pre- scriptions from a provider who is ei- ther employed by the covered entity or who is an independent contractor for the covered entity. This would ex- clude prescriptions generated as the result of a referral to an outside pre- scriber, such as in the case of cancer patients who, after receiving prescrip- tions from an outside specialist who is not contracted with the covered entity, return to their community hospital for treatment. Patients must also re- ceive prescriptions that result from a billable outpatient visit, which would exclude discharge prescriptions. Pa- tients with emergency department or observation visits would not be eligible if the visit led to an inpatient admission. HRSA received 1264 comments to the proposed guidance, and the final guidance is expected in late 2016 or in 2017. Covered entities can expect re- ductions in their 340B program–related savings if any or all of the aforemen-
  • 15. PROJECTING FUTURE DRUG EXPENDITURES SPECIAL FEATURE AM J HEALTH-SYST PHARM | VOLUME 73 | 2016  e371 tioned proposals are approved, which could have an impact on the breadth of services they provide to uninsured or underinsured patients. As we have suggested previously, pharmacy leaders must keep abreast of important developments in healthcare policy, finance, technol- ogy, and practice in order to be opti- mally prepared for changes that may influence practice and thus have an impact on medication spending. The analyses and projections presented here focus on factors likely to influ- ence healthcare spending and pre- scription drug expenditures in 2016, but pharmacy leaders should also carefully monitor other develop- ments that are likely to have an im- pact on departmental budgets in the coming years. Additional guidance on emerging issues that may influ- ence drug spending can be found in the newly released fourth annual edition of the ASHP Foundation re- port Pharmacy Forecast 2016–2020: Strategic Planning Advice for Phar- macy Departments in Hospitals and Health Systems. We strongly urge readers to review and use this report in financial and strategic planning. The complete report is freely avail- able online (www.ashpfoundation. org/pharmacyforecast). Our analysis and forecast should be considered with an understanding of its important limitations. The pri- mary source of the drug expenditure trend data was the IMS Health NSP database; while this is a very reliable database, there are characteristics of the data sets used in our analyses that should be considered when interpret- ing our results. The NSP database is continually updated, and any analysis may yield slightly different results de- pending on the timing of data access. For this article, data were extracted on February 2, 2016. We refer readers to a previous version of this forecast for a complete description of other characteristics and potential limita- tions.10 One such limitation was that the IMS data do not include expendi- tures by the Veterans Affairs system. The absence of these data began in calendar year 2014. This limitation af- fected our estimates of expenditures for federal facilities, as shown in Table 1, and, to a lesser extent, the total for all channels. Another limitation (one not previously noted) was our catego- rization of medication expenditures by therapeutic drug class. Drugs that are used across multiple indications are categorized only by the primary therapeutic drug class. On the other hand, a previously noted limitation that we have rectified in this version of the annual forecast is the use of full- calendar-year data for our analysis of historical trends; previously in our analysis of trends, data collection for each year extended only through the end of September, potentially leading to conclusions unduly influenced by seasonal fluctuations in utilization. Finally, as in previous years, our anal- ysis was also based on the availability of information on new drug approv- als and patent expirations, much of which came from FDA sources as well as pharmaceutical company news re- ports. Because of the dynamic nature of this information, some drugs may have been overlooked, and accurate information on some drugs may have been unavailable. The limitations noted above all may have influenced both our find- ings with regard to historical trends and the accuracy of the predictions made for spending in 2016. Further, although based on a careful analysis of key trends and factors expected to affect medication spending, our fore- cast was based primarily on the expert opinion of the authors. We have ana- lyzed the accuracy of our past predic- tions, and, while not without error, they have been comparable in accu- racy to those of annual estimates from CMS.58 Still, we caution readers not to blindly use our projections as “mul- tipliers” to adjust prior-year budgets for the next period. Instead, local data should be carefully and systematically incorporated into an organization- specific drug expenditure forecast, with proper consideration of external trends relevant to drug expenditures, as described in this article.59,60 Conclusion We project an 11–13% increase in total drug expenditures across all settings in 2016, with a 15–17% in- crease in clinic spending and a 10– 12% increase in hospital spending. Health-system pharmacy leaders should carefully examine local drug utilization patterns in projecting their own organization’s drug spend- ing in 2016. Acknowledgments The authors thank all of the individuals who served as reviewers for this article and the ASHP Section of Pharmacy Prac- tice Managers for supporting this effort. The statements, findings, conclusions, and views contained and expressed herein are those of the authors and do not necessarily represent the views of ASHP, the U.S. gov- ernment, the Department of Veterans Af- fairs, or IMS Health Incorporated or any of its affiliated or subsidiary entities. Disclosures Dr. Schumock has consulted for or received research funding from Abbvie, Astellas, and Baxter in the past three years; both he and Mr. Vermeulen are uncompensated mem- bers of the IMS Health Services Research Network Steering Committee, from which much of the evaluated data was obtained. Dr. Li has received honoraria for advising and/or speaking from Amgen, Hospira, Merck, Pfizer, and Sandoz. The other au- thors have declared no potential conflicts of interest. References 1. Martin AB, Hartman M, Benson J, Catlin A. National health spend- ing in 2014: faster growth driven by coverage expansion and prescription drug spending. Health Aff (Millwood). 2016; 35:150-60. 2. Keehan SP, Cuckler GA, Sisko AM et al. National health expenditure pro- jections, 2014-24: spending growth faster than recent trends. Health Aff (Millwood). 2015; 34:1407-17. 3. Freundlich N. Keep the focus on rising drug prices, not smirking Shkreli (Feb- ruary 8, 2016). http://reforminghealth. org/2016/02/08/keep-the-focus-on- rising-drug-prices-not-smirking- shkreli/ (accessed 2016 Mar 2). 4. Thomas Z, SwiftT.Who is Martin Shkreli—’the most hated man in Amer-
  • 16. SPECIAL FEATURE PROJECTING FUTURE DRUG EXPENDITURES e372    AM J HEALTH-SYST PHARM | VOLUME 73 | 2016 ica’? (September 23, 2015). www.bbc. com/news/world-us-canada-34331761 (accessed 2016 Mar 3). 5. Winslow R. Cost of skin drugs rising rapidly, study shows (November 26, 2015). www.wsj.com/articles/ prescription-skin-drugs-explode- in-costs-study-shows-1448467254 (accessed 2016 Mar 2). 6. Leopold C, Chambers JD, Wagner AK. Thirty years of media coverage on high drug prices in the United States—a never-ending story or a time for change? Value Health. 2016; 19:14-6. 7. Johnson C, Dennis B. How an $84,000 drug got its price: ‘let’s hold our position . . . whatever the head- lines.’ (December 1, 2015). www. washingtonpost.com/news/wonk/ wp/2015/12/01/how-an-84000-drug- got-its-price-lets-hold-our-position- whatever-the-headlines/ (accessed 2016 Mar 2). 8. Tefferi A, Kantarjian H, Rajkumar SV et al. In support of a patient-driven initiative and petition to lower the high price of cancer drugs. Mayo Clin Proc. 2015; 90:996-1000. 9. Rocco P, Gellad W, Donohue J. How much does Congress care about drug prices? Less than it should (January 13, 2016). http://healthaffairs.org/ blog/2016/01/13/how-much-does- congress-care-about-drug-prices- less-than-it-should/ (accessed 2016 Mar 2). 10. Schumock GT, Li EC, Suda KJ et al. National trends in prescription drug expenditures and projections for 2014. Am J Health-Syst Pharm. 2014; 71:482-99. 11. Schumock GT, Li EC, Suda KJ et al. National trends in prescription drug expenditures and projections for 2015. Am J Health-Syst Pharm. 2015; 72:717-36. 12. National Sales Perspectives [propri- etary database]. Plymouth Meeting, PA: IMS Health; 2016. 13. IMS Health. Uniform System of Classi- fication (March 2008). www.imshealth. com/files/web/IMSH%20Institute/ USC_Classiification_Process_2011.pdf (accessed 2016 Mar 30). 14. Biogen. FDA accepts biologics license application for Zinbryta (daclizumab high-yield process) for treatment of MS (April 29, 2015). http://media.biogen. com/press-release/corporate/fda- accepts-biologics-license-application- zinbryta-daclizumab-high-yield-pro (accessed 2016 Feb 22). 15. Gilead Sciences. Gilead submits new drug application to U.S. Food and Drug Administration for single tablet regimen for HIV contain- ing rilpivirine, emtricitabine and tenofovir alafenamide (R/F/TAF) (July 1, 2015). www.gilead.com/ news/press-releases/2015/7/gilead- submits-new-drug-application-to- us-food-and-drug-administration- for-single-tablet-regimen-for-hiv- containing-rilpivirine-emtricitabine- and-tenofovir-alafenamide-rftaf (accessed 2016 Feb 22). 16. GileadSciences.Gileadsubmitsnewdrug applicationtoU.S.FoodandDrugAd- ministrationforfixed-dosecombination ofemtricitabine/tenofoviralafenamide forHIVtreatment(April7,2015).www. gilead.com/news/press-releases/2015/4/ gilead-submits-new-drug-application- to-us-food-and-drug-administration-for- fixeddose-combination-of-emtricitabine- tenofovir-alafenamide-for-hiv-treatment (accessed2016Feb22). 17. PR Newswire. FDA accepts Bayer’s bio- logics license application for investiga- tional treatment option in hemophilia A (March 4, 2015). www.prnewswire. com/news-releases/fda-accepts- bayers-biologics-license-application- for-investigational-treatment-option- in-hemophilia-a-300045306.html (accessed 2016 Feb 22). 18. PR Newswire. Jazz Pharmaceuticals announces U.S. FDA acceptance for filing with priority review of NDA for defibrotide for hepatic veno-occlusive disease (September 30, 2105). www. prnewswire.com/news-releases/ jazz-pharmaceuticals-announces- us-fda-acceptance-for-filing- with-priority-review-of-nda-for- defibrotide-for-hepatic-veno- occlusive-disease-300151412.html (accessed 2016 Feb 22). 19. Business Wire. Xadago (safinamide) new drug application (NDA) ac- cepted for filing by the U.S. Food and Drug Administration (FDA) (March 2, 2015). www.businesswire.com/ news/home/20150302006405/en/ Xadago%C2%AE-safinamide-Drug- Application-NDA-Accepted-Filing (accessed 2016 Feb 22). 20. GileadSciences.GileadannouncesU.S. FDApriorityreviewdesignationfor sofosbuvir/velpatasvirfortreatment ofallgenotypesofchronichepatitisC infection(January4,2016).www.gilead. com/news/press-releases/2016/1/ gilead-announces-us-fda-priority-review- designation-for-sofosbuvirvelpatasvir-for- treatment-of-all-genotypes-of-chronic- hepatitis-c-infection(accessed2016Feb 2). 21. TevaPharmaceuticalIndustriesLtd.Teva announcesFDAacceptanceofthebiolog- icslicenseapplicationforreslizumab (June15,2015).www.tevapharm.com/ news/teva_announces_fda_acceptance_ of_the_biologics_license_application_for_ reslizumab_06_15.aspx(accessed2016 Feb22). 22. Intercept. FDA extends PDUFA date for obeticholic acid for the treatment of PBC (December 17, 2015). https://globenewswire.com/ news-release/2015/12/17/796641/0/ en/FDA-Extends-PDUFA-Date-for- Obeticholic-Acid-for-the-Treatment- of-PBC.html (accessed 2016 Feb 22). 23. Sanofi. Sanofi new drug applica- tion for lixisenatide accepted for review by FDA (September 29, 2015). www.news.sanofi. us/2015-09-29-Sanofi-New-Drug- Application-for-Lixisenatide- Accepted-for-Review-by-FDA (accessed 2016 Feb 22). 24. Business Wire. Acadia Pharma- ceuticals announces FDA priority review of Nuplazid (pimavanserin) new drug application for Parkin- son’s disease psychosis (November 2, 2015). www.businesswire.com/ news/home/20151102005516/ en/ACADIA-Pharmaceuticals- Announces-FDA-Priority-Review- NUPLAZID%E2%84%A2 (accessed 2016 Feb 22). 25. BusinessWire.Teva announces FDA acceptance of NDA for SD-809 for treatment in Huntington disease (August 12, 2015). www.businesswire. com/news/home/20150812005421/ en/Teva-Announces-FDA-Acceptance- NDA-SD-809-Treatment (accessed 2016 Feb 22). 26. Roche.FDAgrantspriorityreviewfor venetoclaxnewdrugapplication(Janu- ary12,2016).www.roche.com/investors/ updates/inv-update-2016-01-12.htm (accessed2016Feb22). 27. PR Newswire. FDA accepts Amgen’s new drug application for novel intravenous calcimimetic Etelcal- cetide (November 6, 2015). www. prnewswire.com/news-releases/ fda-accepts-amgens-new-drug- application-for-novel-intravenous- calcimimetic-etelcalcetide-300174208. html (accessed 2016 Feb 22). 28. PR Newswire. Valeant announces FDA acceptance of BLA submission for brodalumab in moderate-to- severe plaque psoriasis (January 25, 2015). www.prnewswire.com/ news-releases/valeant-announces- fda-acceptance-of-bla-submission- for-brodalumab-in-moderate-to- severe-plaque-psoriasis-300208845. html (accessed 2016 Feb 22). 29. PR Newswire. Regeneron and Sanofi an- nounce sarilumab biologics license ap-
  • 17. PROJECTING FUTURE DRUG EXPENDITURES SPECIAL FEATURE AM J HEALTH-SYST PHARM | VOLUME 73 | 2016  e373 plication accepted for review by US FDA (January 8, 2016). www.prnewswire. com/news-releases/regeneron-and- sanofi-announce-sarilumab-biologics- license-application-accepted-for- review-by-us-fda-300201389.html (accessed 2016 Feb 22). 30. Taylor P. Roche prepares to file atezolizumab for bladder cancer (January 8, 2016). www.pmlive. com/pharma_news/roche_prepares_ to_file_atezolizumab_for_bladder_ cancer_901572 (accessed 2016 Feb 22). 31. Eli Lilly and Company. Lilly and Incyte announce submission of new drug application to FDA for oral once-daily baricitinib for treatment of moderate-to-severe rheumatoid arthritis (January 19, 2016). https:// investor.lilly.com/releasedetail. cfm?ReleaseID=950678 (accessed 2016 Feb 22). 32. Food and Drug Administration. FDA news release: FDA approves Zepatier for treatment of chronic hepatitis C genotypes 1 and 4 (January 28, 2016). www.fda.gov/NewsEvents/ Newsroom/PressAnnouncements/ ucm483828.htm (accessed 2016 Mar 30). 33. FoodandDrugAdministration.FDA newsrelease:FDAapprovesfirstcoagu- lationfactor–albuminfusionproteinto treatpatientswithhemophiliaB(March 4,2016).www.fda.gov/NewsEvents/ Newsroom/PressAnnouncements/ ucm489266.htm(accessed2016Mar30). 34. Taylor S. Digest: generic and biosimilar pipeline September 2015 to December 2018 (2015). https://www.futurescripts. com/FutureScripts/pdfs/for_members/ Q3_2015_Generic_Pipeline_Report.pdf (accessed 2016 Mar 30). 35. Express Scripts. Issues document: patent expirations (2013–2017) (May 6, 2013). www.centerlighthealthcare.org/ images/uploads/Brand_Name_Drugs_ with_Patent_Expirations_2013_-_2017. pdf (accessed 2016 Mar 30). 36. Stone K.Which popular drugs are going off patent in 2013–2016? (December 16, 2014). http://pharma. about.com/od/BigPharma/a/Which- Popular-Drugs-Are-Going-Off-Patent- In-2013-2016.htm (accessed 2016 Feb 29). 37. EPVantage. Breakthrough designation quickens FDA approval pace in 2014 (January 5, 2015). http://epvantage. com/Universal/View.aspx?type=Story& id=550480&isEPVantage=yes (accessed 2016 Feb 22). 38. Eli Lilly and Company. Lilly receives FDA breakthrough therapy designa- tion for abemaciclib—a CDK 4 and 6 inhibitor—in advanced breast cancer (October 8, 2015). www.prnewswire. com/news-releases/lilly-receives-fda- breakthrough-therapy-designation-for- abemaciclib–a-cdk-4-and-6-inhibitor– in-advanced-breast-cancer-300156371. html (accessed 2016 Feb 22). 39. AstraZeneca. Durvalumab granted breakthrough therapy designation by US FDA for treatment of patients with PD-L1 positive urothelial bladder cancer (February 17, 2016). www.astrazeneca.com/media-centre/ press-releases/2016/Durvalumab- granted-Breakthrough-Therapy- designation-by-US-FDA-for-treatment- of-patients-with-PD-L1-positive- urothelial-bladder-cancer-17022016. html (accessed 2016 Feb 22). 40. Redbook Online [online database]. Greenwood Village, CO: Truven Health Analytics (accessed 2016 Feb 22). 41. Food and Drug Administration. Un- approved drugs initiative (December 15, 2014). www.fda.gov/Drugs/ GuidanceComplianceRegulatory Information/EnforcementActivities byFDA/SelectedEnforcementActions onUnapprovedDrugs/ucm118990. htm (accessed 2016 Mar 2). 42. Aitken M, Kleinrock M. Global medicines use in 2020: outlook and implications. Parsippany, NJ: IMS Institute for Healthcare Informatics; 2015 Nov. 43. Conti RM, Rosenthal MB. Pharma- ceutical policy reform—balancing affordability with incentives for innovation. N Engl J Med. 2016; 374:703-6. 44. Sisko AM, Keehan SP, Cuckler GA et al. National health expenditure projections, 2013–23: faster growth expected with expanded coverage and improving economy. Health Aff (Millwood). 2014; 33:1841-50. 45. The Express Scripts Labs. Express Scripts 2015 drug trend report (March 2016). http://lab.express-scripts. com/lab/drug-trend-report (accessed 2016 Apr 4). 46. Food and Drug Administration. Novel new drugs: 2014 summary (Janu- ary 2015). www.fda.gov/downloads/ Drugs/DevelopmentApprovalProcess/ DrugInnovation/UCM430299.pdf (ac- cessed 2016 Mar 30). 47. Denniston MM, Jiles RB, Drobeniuc J et al. Chronic hepatitis C virus infec- tion in the United States, National Health and Nutrition Examination Survey 2003 to 2010. Ann Intern Med. 2014; 160:293-300. 48. American Association for the Study of Liver Diseases and Infectious Diseases Society of America. HCV guidance: recommendations for test- ing, managing, and treating hepatitis C (2016). www.hcvguidelines.org (accessed 2016 Mar 30). 49. CentersforMedicareandMedicaid Services.Medicaiddrugrebateprogram notice:assuringMedicaidbeneficia- ries’accesstohepatitisC(HCV)drugs (November5,2015).www.medicaid.gov/ Medicaid-CHIP-Program-Information/ By-Topics/Benefits/Prescription-Drugs/ Downloads/Rx-Releases/State-Releases/ state-rel-172.pdf(accessed2016Mar30). 50. Rodriguez-Gutierrez R, Shah ND, Montori VM. Predicting the overuse of PCSK-9 inhibitors. JAMA. 2015; 314:1909-10. 51. EMD Serono. EMD Serono spe- cialty digest, 11th edition. www. specialtydigest.emdserono.com/ Digest.aspx (accessed 2016 Feb 1). 52. Colgan K, Stubbings J, Choudry R, Knoer S. Developing a specialty phar- macy strategy: building a successful business model. Abstract presented at ASHP Midyear Clinical Meeting. New Orleans, LA; 2015 Dec. 53. Ignjatovic T. Biosimilars still to make an impact in the UK (July 10, 2013). www.datamonitorhealthcare.com/ biosimilars-still-to-make-an-impact- in-the-uk/ (accessed 2016 Mar 2). 54. Pollack A. Drug goes from $13.50 a tablet to $750 overnight (Sep- tember 20, 2015). www.nytimes. com/2015/09/21/business/a-huge- overnight-increase-in-a-drugs-price- raises-protests.html?_r=0 (accessed 2016 Mar 30). 55. American Society of Health-System Pharmacists. ASHP statement for the record: “developments in the prescription drug market” (February 4, 2016). www.ashp.org/menu/ Advocacy/FederalIssues/OtherIssues/ ASHP-Statement-for-the-Record- Developments-in-the-Prescription- Drug-Market.html (accessed 2016 Mar 2). 56. Wiske CP, Ogbechie OA, Schulman KA. Options to promote competitive generics markets in the United States. JAMA. 2015; 314:2129-30. 57. Health Resources and Services Administration. 340B Drug Pricing Program omnibus guidance (August 28, 2015). www.federalregister. gov/articles/2015/08/28/2015- 21246/340b-drug-pricing-program- omnibus-guidance (accessed 2016 Mar 30). 58. Hartke PL, Vermeulen LC, Hoffman JM et al. Accuracy of annual prescrip- tion drug expenditure forecasts in AJHP. Am J Health-Syst Pharm. 2015; 72:1642-8.
  • 18. SPECIAL FEATURE PROJECTING FUTURE DRUG EXPENDITURES e374    AM J HEALTH-SYST PHARM | VOLUME 73 | 2016 59. Hoffman JM, Shah ND, Vermeulen LC et al. Projecting future drug expenditures—2005. Am J Health- Syst Pharm. 2005; 62:149-67. 60. American Society of Health-System Pharmacists. ASHP guidelines on medication cost management strate- gies for hospitals and health systems. Am J Health-Syst Pharm. 2008; 65:1368-84. 61. Amgen. FDA approves Imlygic (talimogene laherparepvec) as first oncolytic viral therapy in the US (October 27, 2015). www.amgen. com/media/news-releases/2015/10/ fda-approves-imlygic-talimogene- laherparepvec-as-first-oncolytic- viral-therapy-in-the-us/ (accessed 2016 Feb 22).