SlideShare ist ein Scribd-Unternehmen logo
1 von 7
Downloaden Sie, um offline zu lesen
February 26, 2013


COMPANY UPDATE
Maroc Telecom (IAM.PA)
Sell                                                                                                                                          Equity Research

Structural challenges in place despite short term ease; Sell
What's changed                                                                           Investment Profile
                                                                                         Low                                                                            High
Maroc Telecom reported full-year 2012 financial results (February 21).
                                                                                         Growth                                                                         Growth
Revenues came in line with our estimate and slightly below Bloomberg
                                                                                         Returns *                                                                      Returns *
consensus with 3.2% yoy decline for the full year. EBITDA came above
                                                                                         Multiple                                                                       Multiple
expectations with profitability reaching 57.0% in 4Q2012. The EBITDA                     Volatility                                                                     Volatility
surprise was driven by foreign operations where the margin increased to                       Percentile           20th       40th       60th        80th       100th
                                                                                             Maroc Telecom (IAM.PA)
50.3% in 4Q. The company also announced dividend in respect of 2012 at
                                                                                             Europe New Markets TMT Peer Group Average
Dh7.4, 7% below consensus estimates. For 2013, the company expects the
                                                                                       * Returns = Return on Capital For a complete description of the
EBITDA margin to stay around 56% and to deliver improvement in                                                       investment profile measures please refer to
                                                                                                                     the disclosure section of this document.
EBITDA-capex driven by yoy reduction in capex.
                                                                                       Key data                                                                            Current
                                                                                       Price (€)                                                                               9.57
Implications                                                                           12 month price target (€)                                                               6.80
We incorporate the reported results in to our estimates and raise our 2013-            Upside/(downside) (%)                                                                    (29)
                                                                                       Market cap (€ mn)                                                                    8,412.9
15 EBITDA forecast by an average 1.4% on the back competitive pressure                 Enterprise value (Dh mn)                                                           105,923.3
                                                                                                                             12/12          12/13E           12/14E         12/15E
ease and cost optimization program in international operations. We keep                Revenue (Dh mn) New                 29,849.0        29,422.0         29,265.5       29,352.5
our domestic wireless estimates largely unchanged as we still see ongoing              Revenue revision (%)                     0.2            (0.3)            (0.8)          (0.9)
                                                                                       EBIT (Dh mn) New                    11,757.0        11,262.9         11,081.0       11,041.8
price cuts and margin pressure. We believe that risks for incumbent                    EBIT revision (%)                        2.7              1.1            (0.3)          (0.9)
margin will be building up in Morocco as a result of fixed-line access                 EPS (Dh) New                            7.63            8.40             8.27           8.27
                                                                                       EPS (Dh) Old                            7.94            8.40             8.38           8.42
unbundling (2013) and LTE auction (expected to come in 2H2013-1H2014)                  EV/EBITDA (X)                            7.1              6.5              6.5            6.5
                                                                                       P/E (X)                                 15.6            12.7             12.9           12.9
may bring incremental competition to mobile market. We hence reiterate                 Dividend yield (%)                       6.2              7.9              7.7            7.7
our Sell rating.                                                                       FCF yield (%)                           NM               NM               NM             NM
                                                                                       CROCI (%)                               15.1            14.9             13.9           13.1


Valuation                                                                              Price performance chart
Our 12-month price target of €6.8 (down from €6.9) is based on a 9% three-             13.0                                                                                        380
                                                                                       12.5                                                                                        370
year forward target dividend yield (CEEMEA fixed-line sector average),                 12.0                                                                                        360
discounted at a 10% COE. The stock trades on 6.5x 2013E EV/EBITDA, a                   11.5                                                                                        350
                                                                                       11.0                                                                                        340
substantial premium to the CEEMEA telecoms average, supporting our                     10.5                                                                                        330
                                                                                       10.0                                                                                        320
Sell rating.
                                                                                        9.5                                                                                        310
                                                                                        9.0                                                                                        300
                                                                                        8.5                                                                                        290
Key risks                                                                               8.0                                                                                        280
More aggressive dividend increase and cost reduction; higher share in the                Feb-12                Jun-12                Sep-12               Dec-12

broadband and mobile market; and higher data center and government
                                                                                                                  Maroc Telecom (L)           MSCI EM EMEA (R)
revenues, weaker macro dynamics and regulatory changes.
INVESTMENT LIST MEMBERSHIP                                                             Share price performance (%)                       3 month         6 month 12 month
                                                                                       Absolute                                              (4.3)             0.7   (23.4)
Pan-Europe Sell List                                                                   Rel. to MSCI EM EMEA                                  (9.1)           (4.4)   (20.4)
                                                                                       Source: Company data, Goldman Sachs Research estimates, FactSet. Price as of 2/26/2013 close.


Coverage View: Neutral
Alexander Balakhnin                                                 Goldman Sachs does and seeks to do business with companies
+7(495)645-4016 alexander.balakhnin@gs.com OOO Goldman Sachs Bank
Daria Fomina
                                                                    covered in its research reports. As a result, investors should be
+7(495)645-4017 daria.fomina@gs.com OOO Goldman Sachs Bank          aware that the firm may have a conflict of interest that could
                                                                    affect the objectivity of this report. Investors should consider
                                                                    this report as only a single factor in making their investment
                                                                    decision. For Reg AC certification and other important
                                                                    disclosures, see the Disclosure Appendix, or go to
                                                                    www.gs.com/research/hedge.html. Analysts employed by non-
                                                                    US affiliates are not registered/qualified as research analysts
                                                                    with FINRA in the U.S.

The Goldman Sachs Group, Inc.                                                                                                             Global Investment Research
February 26, 2013                                                                                                                                                      Maroc Telecom (IAM.PA)


 Maroc Telecom: Summary Financials
Profit model (Dh mn)                        12/12      12/13E       12/14E       12/15E     Balance sheet (Dh mn)                                12/12           12/13E           12/14E           12/15E
Total revenue                             29,849.0     29,422.0     29,265.5     29,352.5
Operating costs                         (13,146.0)   (13,048.8)   (13,097.8)   (13,235.8)   Cash & equivalents                                   964.0          2,393.7          3,067.0          4,047.8
R&D                                            0.0          0.0          0.0          0.0   Accounts receivable                               10,291.0         10,143.8         10,089.8         10,119.8
Lease payments                                 0.0          0.0          0.0          0.0   Inventory                                            468.0            461.3            458.9            460.2
Other operating profit/(expense)               0.0          0.0          0.0          0.0   Other current assets                                 106.0            106.0            106.0            106.0
EBITDA                                    16,703.0     16,373.1     16,167.7     16,116.7   Total current assets                              11,829.0         13,104.8         13,721.7         14,733.8
Depreciation & amortisation              (4,946.0)    (5,110.2)    (5,086.7)    (5,074.9)   Net PP&E                                          25,476.0         25,152.3         24,691.6         24,258.7
EBIT                                      11,757.0     11,262.9     11,081.0     11,041.8   Net intangibles                                   10,322.0         10,390.2         10,446.6         10,501.0
Net interest income/(expense)              (344.0)      (349.0)      (342.8)      (303.4)   Total investments                                    266.0            266.0            266.0            266.0
Associates                                     0.0          0.0          0.0          0.0   Other long-term assets                                56.0             56.0             56.0             56.0
Profit/(loss) on disposals                     0.0          0.0          0.0          0.0   Total assets                                      47,949.0         48,969.2         49,181.9         49,815.5
Others (recurring)                         (862.0)          0.0          0.0          0.0
Pretax profits                            10,551.0     10,914.0     10,738.3     10,738.4   Accounts payable                                  17,394.0         17,145.2         17,054.0         17,104.7
Income tax                               (3,272.0)    (3,219.6)    (3,167.8)    (3,167.8)   Short-term debt                                    7,259.0          7,259.0          7,259.0          7,259.0
Tax rate (%)                                  31.0         29.5         29.5         29.5   Other current liabilities                            649.0            649.0            649.0            649.0
Minorities                                 (574.0)      (307.8)      (302.8)      (302.8)   Total current liabilities                         25,302.0         25,053.2         24,962.0         25,012.7
Preferred dividends                            0.0          0.0          0.0          0.0   Long-term debt                                       886.0            966.0          1,086.0          1,366.0
Net income (pre-exceptionals)              6,705.0      7,386.6      7,267.7      7,267.8   Other long-term liabilities                        1,068.0          1,068.0          1,068.0          1,068.0
Other non-recurring items post tax            42.8          0.0          0.0          0.0   Total long-term liabilities                        1,954.0          2,034.0          2,154.0          2,434.0
Net income                                 6,747.8      7,386.6      7,267.7      7,267.8   Total liabilities                                 27,256.0         27,087.2         27,116.0         27,446.7
EPS (underlying) (Dh)                         7.63         8.40         8.27         8.27
EPS (basic, reported) (Dh)                    7.68         8.40         8.27         8.27   Preferred shares                                       0.0              0.0              0.0              0.0
Weighted shares outstanding (mn)             879.1        879.1        879.1        879.1   Total common equity                               16,294.0         17,175.3         17,056.3         17,056.5
                                                                                            Minority interest                                  4,399.0          4,706.8          5,009.6          5,312.4
Common dividends declared                 6,505.3      7,386.6      7,267.7      7,267.8
DPS (Dh)                                      7.40         8.40         8.27        8.27    Total liabilities & equity                        47,949.0         48,969.2         49,181.9         49,815.5
Dividend payout ratio (%)                     97.0       100.0        100.0        100.0    Capitalised leases                                     0.0              0.0              0.0              0.0
Dividend cover (X)                             1.0          1.0          1.0          1.0   Capital employed                                  28,838.0         30,107.0         30,410.9         30,993.9
Growth & margins (%)                       12/12       12/13E       12/14E       12/15E
Revenue growth                               (3.2)        (1.4)        (0.5)          0.3   Adj for unfunded pensions & GW                  (10,322.0)        (10,390.2)      (10,446.6)       (10,501.0)
EBITDA growth                                (1.7)        (2.0)        (1.3)        (0.3)   Adj capital employed                              18,516.0          19,716.9        19,964.3         20,492.8
EBIT growth                                  (5.0)        (4.2)        (1.6)        (0.4)   Gross cash invested                               87,605.0          92,796.7        97,747.5       102,658.8
Net income growth                           (17.4)          9.5        (1.6)          0.0
EPS growth                                  (17.5)         10.2        (1.6)          0.0   Ratios                                               12/12           12/13E           12/14E           12/15E
DPS growth                                  (20.1)         13.5        (1.6)          0.0
EBITDA margin                                 56.0         55.6         55.2        54.9    CROCI (%)                                              15.1             14.9             13.9             13.1
EBIT margin                                   39.4         38.3         37.9        37.6    CROCI/WACC (X)                                            --               --               --               --
Cash flow statement (Dh mn)                 12/12      12/13E       12/14E       12/15E     ROIC (%)                                               44.4             42.8             40.5             39.6
Net income                                6,705.0      7,386.6      7,267.7      7,267.8    ROIC/WACC (X)                                             --               --               --               --
D&A add-back (incl. ESO)                  4,946.0      5,110.2      5,086.7      5,074.9    ROA (%)                                                15.6             16.4             15.9             15.7
Minority interest add-back                  574.0        307.8        302.8        302.8    WACC (%)                                                  --               --               --               --
Net (inc)/dec working capital             1,145.0        (94.9)       (34.8)        19.3    Inventory days                                          7.2              5.8              5.7              5.7
Other operating cash flow                   504.0        349.0        342.8        303.4    Asset turnover (X)                                      1.2              1.2              1.2              1.2
Cash flow from operations                13,874.0     13,058.6     12,965.2     12,968.2    Net debt/equity (%)                                    34.7             26.6             23.9             20.5
                                                                                            EBITDA interest cover (X)                              48.6             46.9             47.2             53.1
Capital expenditures                     (5,106.0)    (4,854.6)    (4,682.5)    (4,696.4)
Acquisitions                                   0.0          0.0          0.0          0.0   Valuation                                            12/12           12/13E           12/14E           12/15E
Divestitures                                  37.0          0.0          0.0          0.0   EV/sales (X)                                           4.0               3.6              3.6              3.6
Others                                        71.0          0.0          0.0          0.0   EV/EBITDAR (X)                                         7.1               6.5              6.5              6.5
Cash flow from investing                 (4,998.0)    (4,854.6)    (4,682.5)    (4,696.4)   EV/EBITDA (X)                                          7.1               6.5              6.5              6.5
                                                                                            EV/EBIT (X)                                           10.1               9.4              9.5              9.5
Dividends paid (common & pref)           (8,317.0)    (6,505.3)    (7,386.6)    (7,267.7)   P/E (X)                                               15.6              12.7             12.9             12.9
Inc/(dec) in debt                            916.0         80.0        120.0        280.0   Dividend yield (%)                                     6.2               7.9              7.7              7.7
Other financing cash flows               (1,119.0)      (349.0)      (342.8)      (303.4)   FCF yield (%)                                          NM               NM               NM               NM
Cash flow from financing                 (8,520.0)    (6,774.3)    (7,609.4)    (7,291.1)   EV/GCI (X)                                             1.4               1.1              1.1              1.0
Total cash flow                              347.0      1,429.7        673.3        980.7   EV/adj. capital employed (X)                           6.7               6.1              6.2              6.4
                                                                                            Price/book (X)                                         6.0               5.5              5.5              5.5
Capex/D&A (%)                               103.2         95.0         92.1         92.5
Reinvestment rate (%)                        40.1         36.9         36.0         36.3    Note: Ratios are adjusted for leases where appropriate. Only separately disclosed where significant and ongoing.
Cash flow cover of dividends (X)              2.0          1.8          1.8          1.8
Free cash flow cover of dividends (X)         1.5          1.2          1.2          1.2    Note: Last actual year may include reported and estimated data.
Free cash flow                                  --           --           --           --   Source: Company data, Goldman Sachs Research estimates.


 Analyst Contributors

 Alexander Balakhnin
 alexander.balakhnin@gs.com

 Daria Fomina
 daria.fomina@gs.com


 Goldman Sachs Global Investment Research                                                                                                                                                                      2
February 26, 2013                                                                                                           Maroc Telecom (IAM.PA)


Exhibit 1: Maroc Telecom estimate changes
(Dh mn, per share data Dh)

                                             Old                                    New                                     Change
                                2012     2013E   2014E      2015E       2012    2013E   2014E        2015E        2012    2013E   2014E    2015E
Revenues                      29,777     29,509   29,510    29,625     29,849   29,422   29,266      29,353       0.2%    -0.3%   -0.8%    -0.9%
EBITDA                        16,391     16,051   15,935    16,012     16,703   16,373   16,168      16,117        1.9%    2.0%    1.5%     0.7%
EBITDA margin                 55.0%      54.4%    54.0%     54.0%      56.0%    55.6%    55.2%       54.9%       91 bps 126 bps 125 bps   86 bps
Net income                     6,984      7,381    7,370     7,405      6,705    7,387    7,268       7,268       -4.0%   0.1%    -1.4%    -1.9%
EPS (MAD)                        7.94      8.40     8.38      8.42       7.63     8.40     8.27           8.27    -4.0%   0.1%    -1.4%    -1.9%


Source: Company data, Goldman Sachs Research estimates.


                                    Exhibit 2: Our new 12 month price target is €6.8

                                                                            DPS (MAD)
                                                                                2014        2015
                                                                                 8.3         8.27

                                                           Valuation
                                        Average DPS                                               8.27

                                        Target dividend yeild                                       9%

                                        Target price (EUR)                                          6.8


                                    Source: Goldman Sachs Research estimates.


Goldman Sachs Global Investment Research                                                                                                           3
February 26, 2013                                                                                                                Maroc Telecom (IAM.PA)


Disclosure Appendix


Reg AC
We, Alexander Balakhnin and Daria Fomina, hereby certify that all of the views expressed in this report accurately reflect our personal views about
the subject company or companies and its or their securities. We also certify that no part of our compensation was, is or will be, directly or
indirectly, related to the specific recommendations or views expressed in this report.


Investment Profile
The Goldman Sachs Investment Profile provides investment context for a security by comparing key attributes of that security to its peer group and
market. The four key attributes depicted are: growth, returns, multiple and volatility. Growth, returns and multiple are indexed based on composites
of several methodologies to determine the stocks percentile ranking within the region's coverage universe.
The precise calculation of each metric may vary depending on the fiscal year, industry and region but the standard approach is as follows:
Growth is a composite of next year's estimate over current year's estimate, e.g. EPS, EBITDA, Revenue. Return is a year one prospective
aggregate of various return on capital measures, e.g. CROCI, ROACE, and ROE. Multiple is a composite of one-year forward valuation ratios, e.g.
P/E, dividend yield, EV/FCF, EV/EBITDA, EV/DACF, Price/Book. Volatility is measured as trailing twelve-month volatility adjusted for dividends.


Quantum
Quantum is Goldman Sachs' proprietary database providing access to detailed financial statement histories, forecasts and ratios. It can be used for
in-depth analysis of a single company, or to make comparisons between companies in different sectors and markets.


GS SUSTAIN
GS SUSTAIN is a global investment strategy aimed at long-term, long-only performance with a low turnover of ideas. The GS SUSTAIN focus list
includes leaders our analysis shows to be well positioned to deliver long term outperformance through sustained competitive advantage and
superior returns on capital relative to their global industry peers. Leaders are identified based on quantifiable analysis of three aspects of corporate
performance: cash return on cash invested, industry positioning and management quality (the effectiveness of companies' management of the
environmental, social and governance issues facing their industry).


Disclosures

Coverage group(s) of stocks by primary analyst(s)
Alexander Balakhnin: EMEA New Markets-MENA Non Financials, EMEA New Markets-Media, EMEA New Markets-Telecoms.
EMEA New Markets-MENA Non Financials: Abdullah Abdul Mohsin Al-Khodari Sons Company (Al Khodari), Abdullah Al Othaim Markets Company,
Abu Dhabi National Energy (Taqa), Abu Dhabi National Hotels, Advanced Petrochemical Company, Agility The Public Warehousing Company
(Agility), Agthia Group, Air Arabia, Aldar Properties, Aldrees Petroleum and Transport Services, Almarai Company, Arab Potash Company, Arabian
Cement, Arabtec Holding, Aramex, Bahrain Telecom, Ciments du Maroc, Citadel Capital, Dana Gas, Dar Al Arkan Real Estate Development
Company (Dar Al-Arkan), Drake and Scull International, Elsewedy Electric Company, Emaar Properties, Emirates Integrated Telecommunications
Company (Du), Emirates Telecommunications Corporation (Etisalat), Etihad Etisalat Co, Fawaz Abdulaziz Alhokair and Company, GB Auto, Galfar
Engineering & Contracting, Halwani Brothers, Herfy, Holcim Maroc, Industries Qatar, Jarir Marketing Company, Jordan Phosphate Mines Co.,
Jordan Telecom, Juhayna Food Industries, Kipco, Kuwait Food Company (Americana), Lafarge Ciments, Maridive and Oil Services, National
Industrialization Company (Tasnee), National Petrochemicals Company (Petrochem), Oman Telecom, Omani Qatari Telecommunication Company
(Nawras), Orascom Construction Industries, Orascom Development Holding AG, Palm Hills Developments, Qassim Cement Company, Qatar
Electricity and Water Company (QEWC), Qatar Gas Transport, Qatar National Cement Company, Rabigh Refineries and Petrochemical (Petro
Rabigh), Ras Al Khaimah Ceramic Company (RAK Ceramics), Red Sea Housing, Renaissance Services, Sahara Petrochemical, Saudi Arabia Fertilizer
Company (SAFCO), Saudi Arabian Amiantit Company, Saudi Arabian Mining (Maaden), Saudi Basic Industries Corporation (SABIC), Saudi Cement
Company (SCC), Saudi Ceramic Company, Saudi Dairy and Foodstuff Company (SADAFCO), Saudi Electricity Company (SEC), Saudi Industrial
Investment Group (SIIG), Saudi International Petrochemicals (Sipchem), Saudi Kayan., Saudi Steel Pipe, Saudi Telecom Company, Savola Group,
Sixth of October Development and Investment Company (SODIC), Solidere, Sorouh Real Estate, Southern Cement, Suez Cement Company, Talaat
Mostafa Group Holding Company (TMG Holding), The National Shipping Company of Saudi Arabia (NSCSA), United Electronics Co (Extra),
Vodafone Qatar, Yamama Cement, Yanbu Cement Company, Yanbu National Petrochemicals (YANSAB), Zain KSA, Zamil Industrial Investment
Company, ezzsteel.
EMEA New Markets-Media: CTC Media, Central European Media Enterprises, Mail.ru Group Ltd., Naspers Ltd., TVN S.A., Yandex N.V..


Goldman Sachs Global Investment Research                                                                                                                   4
February 26, 2013                                                                                                                                                             Maroc Telecom (IAM.PA)


EMEA New Markets-Telecoms: Bezeq, Cellcom Israel Ltd., IBS Group, MTN Group, Magyar Telekom, Maroc Telecom, MegaFon, Mobile
Telesystems, Orascom Telecom, Partner, Qtel, Rostelecom (Ord), Sistema JSFC (GDR), TP Group, Telecom Egypt, Telefonica CR, Telkom SA, Turk
Telekom, Turkcell (ADR), VimpelCom Ltd., Vodacom, Zain.

 Company-specific regulatory disclosures
The following disclosures relate to relationships between The Goldman Sachs Group, Inc. (with its affiliates, "Goldman Sachs") and companies
covered by the Global Investment Research Division of Goldman Sachs and referred to in this research.
Goldman Sachs has received compensation for investment banking services in the past 12 months: Maroc Telecom (€9.57)
Goldman Sachs expects to receive or intends to seek compensation for investment banking services in the next 3 months: Maroc Telecom (€9.57)
Goldman Sachs had an investment banking services client relationship during the past 12 months with: Maroc Telecom (€9.57)

 Distribution of ratings/investment banking relationships
Goldman Sachs Investment Research global coverage universe

                                                              Rating Distribution                                                          Investment Banking Relationships
                                               Buy                                Hold                           Sell                      Buy          Hold           Sell
   Global           31%            55%             14%                  48%             41%          36%
 As of January 1, 2013, Goldman Sachs Global Investment Research had investment ratings on 3,523 equity securities. Goldman Sachs assigns
stocks as Buys and Sells on various regional Investment Lists; stocks not so assigned are deemed Neutral. Such assignments equate to Buy, Hold
and Sell for the purposes of the above disclosure required by NASD/NYSE rules. See 'Ratings, Coverage groups and views and related definitions'
below.

 Price target and rating history chart(s)
     Maroc Te le com (IAM.PA)                                                                        Stock Price Currency : Euro
                                         Goldman Sachs rating and stock price target history
      16.00                                                                                                                 450
                                                                                            7.1
                                    10                                  9
      14.00                                                                 7.8      7.6
                                                                                                                            400
                                                                                                                   6.9
      12.00
                                                                                                                            350
      10.00
                                                     10.1                                                                   300
              8.00                                               9.2
                                                       9.7
                           9.9
              6.00                                                                                                          250
Stock Price


                                                                                                                             Index Price


                                                     S
                     F MA M J J A S O N D J F MA M J J A S O N D J F M A M J J A S O N D
                             2010                   2011                    2012
         Source: Goldman Sachs Investment Research for ratings and price targets; FactSet closing prices as of 12/31/2012.
                                                    Rating                          Covered by Alexander Balakhnin,
                                                         Price target                    as of Jun 2, 2010

                                                         Price target at removal           Not covered by current analyst
                                                         MSCI EM EMEA


The price targets show n should be considered in the context of all prior published Goldman Sachs research, w hich may or
may not have included price targets, as w ell as developments relating to the company, its industry and f inancial markets.


 Regulatory disclosures

 Disclosures required by United States laws and regulations
See company-specific regulatory disclosures above for any of the following disclosures required as to companies referred to in this report: manager
or co-manager in a pending transaction; 1% or other ownership; compensation for certain services; types of client relationships; managed/co-
managed public offerings in prior periods; directorships; for equity securities, market making and/or specialist role. Goldman Sachs usually makes a
market in fixed income securities of issuers discussed in this report and usually deals as a principal in these securities.
The following are additional required disclosures: Ownership and material conflicts of interest: Goldman Sachs policy prohibits its analysts,
professionals reporting to analysts and members of their households from owning securities of any company in the analyst's area of
coverage. Analyst compensation: Analysts are paid in part based on the profitability of Goldman Sachs, which includes investment banking
revenues. Analyst as officer or director: Goldman Sachs policy prohibits its analysts, persons reporting to analysts or members of their
households from serving as an officer, director, advisory board member or employee of any company in the analyst's area of coverage. Non-U.S.
Analysts: Non-U.S. analysts may not be associated persons of Goldman, Sachs & Co. and therefore may not be subject to NASD Rule 2711/NYSE
Rules 472 restrictions on communications with subject company, public appearances and trading securities held by the analysts.
Distribution of ratings: See the distribution of ratings disclosure above. Price chart: See the price chart, with changes of ratings and price targets
in prior periods, above, or, if electronic format or if with respect to multiple companies which are the subject of this report, on the Goldman Sachs
website at http://www.gs.com/research/hedge.html.

 Additional disclosures required under the laws and regulations of jurisdictions other than the United
 States
The following disclosures are those required by the jurisdiction indicated, except to the extent already made above pursuant to United States laws
and regulations. Australia: Goldman Sachs Australia Pty Ltd and its affiliates are not authorised deposit-taking institutions (as that term is defined
in the Banking Act 1959 (Cth)) in Australia and do not provide banking services, nor carry on a banking business, in Australia. This research, and any
access to it, is intended only for "wholesale clients" within the meaning of the Australian Corporations Act, unless otherwise agreed by Goldman
Sachs. Brazil: Disclosure information in relation to CVM Instruction 483 is available at http://www.gs.com/worldwide/brazil/area/gir/index.html.
Where applicable, the Brazil-registered analyst primarily responsible for the content of this research report, as defined in Article 16 of CVM
Instruction 483, is the first author named at the beginning of this report, unless indicated otherwise at the end of the text. Canada: Goldman, Sachs
& Co. has approved of, and agreed to take responsibility for, this research in Canada if and to the extent it relates to equity securities of Canadian
issuers. Analysts may conduct site visits but are prohibited from accepting payment or reimbursement by the company of travel expenses for such


Goldman Sachs Global Investment Research                                                                                                                                                          5
February 26, 2013                                                                                                               Maroc Telecom (IAM.PA)


visits. Hong Kong: Further information on the securities of covered companies referred to in this research may be obtained on request from
Goldman Sachs (Asia) L.L.C. India: Further information on the subject company or companies referred to in this research may be obtained from
Goldman Sachs (India) Securities Private Limited; Japan: See below. Korea: Further information on the subject company or companies referred to
in this research may be obtained from Goldman Sachs (Asia) L.L.C., Seoul Branch. New Zealand: Goldman Sachs New Zealand Limited and its
affiliates are neither "registered banks" nor "deposit takers" (as defined in the Reserve Bank of New Zealand Act 1989) in New Zealand. This research,
and any access to it, is intended for "wholesale clients" (as defined in the Financial Advisers Act 2008) unless otherwise agreed by Goldman
Sachs. Russia: Research reports distributed in the Russian Federation are not advertising as defined in the Russian legislation, but are information
and analysis not having product promotion as their main purpose and do not provide appraisal within the meaning of the Russian legislation on
appraisal activity. Singapore: Further information on the covered companies referred to in this research may be obtained from Goldman Sachs
(Singapore) Pte. (Company Number: 198602165W). Taiwan: This material is for reference only and must not be reprinted without permission.
Investors should carefully consider their own investment risk. Investment results are the responsibility of the individual investor. United
Kingdom: Persons who would be categorized as retail clients in the United Kingdom, as such term is defined in the rules of the Financial Services
Authority, should read this research in conjunction with prior Goldman Sachs research on the covered companies referred to herein and should
refer to the risk warnings that have been sent to them by Goldman Sachs International. A copy of these risks warnings, and a glossary of certain
financial terms used in this report, are available from Goldman Sachs International on request.
European Union: Disclosure information in relation to Article 4 (1) (d) and Article 6 (2) of the European Commission Directive 2003/126/EC is
available at http://www.gs.com/disclosures/europeanpolicy.html which states the European Policy for Managing Conflicts of Interest in Connection
with Investment Research.
Japan: Goldman Sachs Japan Co., Ltd. is a Financial Instrument Dealer registered with the Kanto Financial Bureau under registration number
Kinsho 69, and a member of Japan Securities Dealers Association, Financial Futures Association of Japan and Type II Financial Instruments Firms
Association. Sales and purchase of equities are subject to commission pre-determined with clients plus consumption tax. See company-specific
disclosures as to any applicable disclosures required by Japanese stock exchanges, the Japanese Securities Dealers Association or the Japanese
Securities Finance Company.

Ratings, coverage groups and views and related definitions
Buy (B), Neutral (N), Sell (S) -Analysts recommend stocks as Buys or Sells for inclusion on various regional Investment Lists. Being assigned a Buy
or Sell on an Investment List is determined by a stock's return potential relative to its coverage group as described below. Any stock not assigned
as a Buy or a Sell on an Investment List is deemed Neutral. Each regional Investment Review Committee manages various regional Investment
Lists to a global guideline of 25%-35% of stocks as Buy and 10%-15% of stocks as Sell; however, the distribution of Buys and Sells in any particular
coverage group may vary as determined by the regional Investment Review Committee. Regional Conviction Buy and Sell lists represent
investment recommendations focused on either the size of the potential return or the likelihood of the realization of the return.
Return potential represents the price differential between the current share price and the price target expected during the time horizon associated
with the price target. Price targets are required for all covered stocks. The return potential, price target and associated time horizon are stated in
each report adding or reiterating an Investment List membership.
Coverage groups and views: A list of all stocks in each coverage group is available by primary analyst, stock and coverage group at
http://www.gs.com/research/hedge.html. The analyst assigns one of the following coverage views which represents the analyst's investment
outlook on the coverage group relative to the group's historical fundamentals and/or valuation. Attractive (A). The investment outlook over the
following 12 months is favorable relative to the coverage group's historical fundamentals and/or valuation. Neutral (N). The investment outlook
over the following 12 months is neutral relative to the coverage group's historical fundamentals and/or valuation. Cautious (C). The investment
outlook over the following 12 months is unfavorable relative to the coverage group's historical fundamentals and/or valuation.
Not Rated (NR). The investment rating and target price have been removed pursuant to Goldman Sachs policy when Goldman Sachs is acting in
an advisory capacity in a merger or strategic transaction involving this company and in certain other circumstances. Rating
Suspended (RS). Goldman Sachs Research has suspended the investment rating and price target for this stock, because there is not a sufficient
fundamental basis for determining, or there are legal, regulatory or policy constraints around publishing, an investment rating or target. The
previous investment rating and price target, if any, are no longer in effect for this stock and should not be relied upon. Coverage
Suspended (CS). Goldman Sachs has suspended coverage of this company. Not Covered (NC). Goldman Sachs does not cover this
company. Not Available or Not Applicable (NA). The information is not available for display or is not applicable. Not Meaningful (NM). The
information is not meaningful and is therefore excluded.

Global product; distributing entities
The Global Investment Research Division of Goldman Sachs produces and distributes research products for clients of Goldman Sachs on a global
basis. Analysts based in Goldman Sachs offices around the world produce equity research on industries and companies, and research on
macroeconomics, currencies, commodities and portfolio strategy. This research is disseminated in Australia by Goldman Sachs Australia Pty Ltd
(ABN 21 006 797 897); in Brazil by Goldman Sachs do Brasil Corretora de Títulos e Valores Mobiliários S.A.; in Canada by Goldman, Sachs & Co.
regarding Canadian equities and by Goldman, Sachs & Co. (all other research); in Hong Kong by Goldman Sachs (Asia) L.L.C.; in India by Goldman
Sachs (India) Securities Private Ltd.; in Japan by Goldman Sachs Japan Co., Ltd.; in the Republic of Korea by Goldman Sachs (Asia) L.L.C., Seoul
Branch; in New Zealand by Goldman Sachs New Zealand Limited; in Russia by OOO Goldman Sachs; in Singapore by Goldman Sachs (Singapore)
Pte. (Company Number: 198602165W); and in the United States of America by Goldman, Sachs & Co. Goldman Sachs International has approved
this research in connection with its distribution in the United Kingdom and European Union.
European Union: Goldman Sachs International, authorized and regulated by the Financial Services Authority, has approved this research in
connection with its distribution in the European Union and United Kingdom; Goldman Sachs AG and Goldman Sachs International
Zweigniederlassung Frankfurt, regulated by the Bundesanstalt für Finanzdienstleistungsaufsicht, may also distribute research in Germany.

General disclosures
This research is for our clients only. Other than disclosures relating to Goldman Sachs, this research is based on current public information that we
consider reliable, but we do not represent it is accurate or complete, and it should not be relied on as such. We seek to update our research as
appropriate, but various regulations may prevent us from doing so. Other than certain industry reports published on a periodic basis, the large
majority of reports are published at irregular intervals as appropriate in the analyst's judgment.
Goldman Sachs conducts a global full-service, integrated investment banking, investment management, and brokerage business. We have
investment banking and other business relationships with a substantial percentage of the companies covered by our Global Investment Research
Division. Goldman, Sachs & Co., the United States broker dealer, is a member of SIPC (http://www.sipc.org).


Goldman Sachs Global Investment Research                                                                                                                 6
February 26, 2013                                                                                                                 Maroc Telecom (IAM.PA)


Our salespeople, traders, and other professionals may provide oral or written market commentary or trading strategies to our clients and our
proprietary trading desks that reflect opinions that are contrary to the opinions expressed in this research. Our asset management area, our
proprietary trading desks and investing businesses may make investment decisions that are inconsistent with the recommendations or views
expressed in this research.
The analysts named in this report may have from time to time discussed with our clients, including Goldman Sachs salespersons and traders, or
may discuss in this report, trading strategies that reference catalysts or events that may have a near-term impact on the market price of the equity
securities discussed in this report, which impact may be directionally counter to the analysts' published price target expectations for such stocks.
Any such trading strategies are distinct from and do not affect the analysts' fundamental equity rating for such stocks, which rating reflects a stock's
return potential relative to its coverage group as described herein.
We and our affiliates, officers, directors, and employees, excluding equity and credit analysts, will from time to time have long or short positions in,
act as principal in, and buy or sell, the securities or derivatives, if any, referred to in this research.
This research is not an offer to sell or the solicitation of an offer to buy any security in any jurisdiction where such an offer or solicitation would be
illegal. It does not constitute a personal recommendation or take into account the particular investment objectives, financial situations, or needs of
individual clients. Clients should consider whether any advice or recommendation in this research is suitable for their particular circumstances and,
if appropriate, seek professional advice, including tax advice. The price and value of investments referred to in this research and the income from
them may fluctuate. Past performance is not a guide to future performance, future returns are not guaranteed, and a loss of original capital may
occur. Fluctuations in exchange rates could have adverse effects on the value or price of, or income derived from, certain investments.
Certain transactions, including those involving futures, options, and other derivatives, give rise to substantial risk and are not suitable for all
investors. Investors should review current options disclosure documents which are available from Goldman Sachs sales representatives or at
http://www.theocc.com/about/publications/character-risks.jsp. Transaction costs may be significant in option strategies calling for multiple purchase
and sales of options such as spreads. Supporting documentation will be supplied upon request.
In producing research reports, members of the Global Investment Research Division of Goldman Sachs Australia may attend site visits and other
meetings hosted by the issuers the subject of its research reports. In some instances the costs of such site visits or meetings may be met in part or
in whole by the issuers concerned if Goldman Sachs Australia considers it is appropriate and reasonable in the specific circumstances relating to
the site visit or meeting.
All research reports are disseminated and available to all clients simultaneously through electronic publication to our internal client websites. Not
all research content is redistributed to our clients or available to third-party aggregators, nor is Goldman Sachs responsible for the redistribution of
our research by third party aggregators. For all research available on a particular stock, please contact your sales representative or go to
http://360.gs.com.
Disclosure information is also available at http://www.gs.com/research/hedge.html or from Research Compliance, 200 West Street, New York, NY
10282.
© 2013 Goldman Sachs.
No part of this material may be (i) copied, photocopied or duplicated in any form by any means or (ii) redistributed without the
prior written consent of The Goldman Sachs Group, Inc.


Goldman Sachs Global Investment Research                                                                                                                     7

Weitere ähnliche Inhalte

Was ist angesagt?

Investor Presentation, March 2013
Investor Presentation, March 2013Investor Presentation, March 2013
Investor Presentation, March 2013VulcanMaterials
 
Eq siemens base
Eq siemens baseEq siemens base
Eq siemens baseAshu Saini
 
Elecon engineering ic- 14-05-10
Elecon engineering   ic- 14-05-10Elecon engineering   ic- 14-05-10
Elecon engineering ic- 14-05-10Angel Broking
 
Gammon india ru4 qfy2010-190510
Gammon india ru4 qfy2010-190510Gammon india ru4 qfy2010-190510
Gammon india ru4 qfy2010-190510Angel Broking
 
Pensions Under Pressure: An Update for Global Organizations
Pensions Under Pressure: An Update for Global OrganizationsPensions Under Pressure: An Update for Global Organizations
Pensions Under Pressure: An Update for Global OrganizationsTowers Perrin
 
Finningpresentation uk sep 2011_final
Finningpresentation uk sep 2011_finalFinningpresentation uk sep 2011_final
Finningpresentation uk sep 2011_finalFinningInternational
 
alltel 2004 Annual
alltel 2004 Annualalltel 2004 Annual
alltel 2004 Annualfinance27
 
PHI_ProxyAnnual_Report2004
PHI_ProxyAnnual_Report2004PHI_ProxyAnnual_Report2004
PHI_ProxyAnnual_Report2004finance41
 
prezentare rezultate financiare pe 2008 Deutsche Telekom
prezentare rezultate financiare pe 2008 Deutsche Telekomprezentare rezultate financiare pe 2008 Deutsche Telekom
prezentare rezultate financiare pe 2008 Deutsche Telekomaseceleanu
 
Webinar Deck: Market Vista - Key Market Development in Q3 2012
Webinar Deck: Market Vista - Key Market Development in Q3 2012Webinar Deck: Market Vista - Key Market Development in Q3 2012
Webinar Deck: Market Vista - Key Market Development in Q3 2012Everest Group
 
Clarus' presentation on "Inside the Strategies" at the PensionSource Fund Man...
Clarus' presentation on "Inside the Strategies" at the PensionSource Fund Man...Clarus' presentation on "Inside the Strategies" at the PensionSource Fund Man...
Clarus' presentation on "Inside the Strategies" at the PensionSource Fund Man...PensionSource
 
Cinemax ru4 qfy2010-270510
Cinemax ru4 qfy2010-270510Cinemax ru4 qfy2010-270510
Cinemax ru4 qfy2010-270510Angel Broking
 

Was ist angesagt? (19)

Investor Presentation, March 2013
Investor Presentation, March 2013Investor Presentation, March 2013
Investor Presentation, March 2013
 
Eq siemens base
Eq siemens baseEq siemens base
Eq siemens base
 
Elecon engineering ic- 14-05-10
Elecon engineering   ic- 14-05-10Elecon engineering   ic- 14-05-10
Elecon engineering ic- 14-05-10
 
Gammon india ru4 qfy2010-190510
Gammon india ru4 qfy2010-190510Gammon india ru4 qfy2010-190510
Gammon india ru4 qfy2010-190510
 
2392
23922392
2392
 
HCC
HCCHCC
HCC
 
Mcnally Bharat
Mcnally BharatMcnally Bharat
Mcnally Bharat
 
Pensions Under Pressure: An Update for Global Organizations
Pensions Under Pressure: An Update for Global OrganizationsPensions Under Pressure: An Update for Global Organizations
Pensions Under Pressure: An Update for Global Organizations
 
Hotel Leela
Hotel LeelaHotel Leela
Hotel Leela
 
Finningpresentation uk sep 2011_final
Finningpresentation uk sep 2011_finalFinningpresentation uk sep 2011_final
Finningpresentation uk sep 2011_final
 
GSKCH
GSKCHGSKCH
GSKCH
 
alltel 2004 Annual
alltel 2004 Annualalltel 2004 Annual
alltel 2004 Annual
 
VF Ar06
VF Ar06VF Ar06
VF Ar06
 
Itnl ic - 121010
Itnl  ic - 121010Itnl  ic - 121010
Itnl ic - 121010
 
PHI_ProxyAnnual_Report2004
PHI_ProxyAnnual_Report2004PHI_ProxyAnnual_Report2004
PHI_ProxyAnnual_Report2004
 
prezentare rezultate financiare pe 2008 Deutsche Telekom
prezentare rezultate financiare pe 2008 Deutsche Telekomprezentare rezultate financiare pe 2008 Deutsche Telekom
prezentare rezultate financiare pe 2008 Deutsche Telekom
 
Webinar Deck: Market Vista - Key Market Development in Q3 2012
Webinar Deck: Market Vista - Key Market Development in Q3 2012Webinar Deck: Market Vista - Key Market Development in Q3 2012
Webinar Deck: Market Vista - Key Market Development in Q3 2012
 
Clarus' presentation on "Inside the Strategies" at the PensionSource Fund Man...
Clarus' presentation on "Inside the Strategies" at the PensionSource Fund Man...Clarus' presentation on "Inside the Strategies" at the PensionSource Fund Man...
Clarus' presentation on "Inside the Strategies" at the PensionSource Fund Man...
 
Cinemax ru4 qfy2010-270510
Cinemax ru4 qfy2010-270510Cinemax ru4 qfy2010-270510
Cinemax ru4 qfy2010-270510
 

Ähnlich wie Note Goldman Sachs sur Maroc Telecom Février 2013

Infosys 1 qfy2012ru-12072011
Infosys 1 qfy2012ru-12072011Infosys 1 qfy2012ru-12072011
Infosys 1 qfy2012ru-12072011aatulsb
 
Infosys Result Updated
Infosys Result UpdatedInfosys Result Updated
Infosys Result UpdatedAngel Broking
 
Hdil ru4 qfy2010-28052010
Hdil ru4 qfy2010-28052010Hdil ru4 qfy2010-28052010
Hdil ru4 qfy2010-28052010Angel Broking
 
Tata consultancy services
Tata consultancy services Tata consultancy services
Tata consultancy services Angel Broking
 
Elecon engineering ic- 14-05-10
Elecon engineering   ic- 14-05-10Elecon engineering   ic- 14-05-10
Elecon engineering ic- 14-05-10Angel Broking
 
61107576 rallis-india
61107576 rallis-india61107576 rallis-india
61107576 rallis-indiajeetay
 
L&T - Result Update RU2QFY2011
L&T - Result Update RU2QFY2011L&T - Result Update RU2QFY2011
L&T - Result Update RU2QFY2011Angel Broking
 
All ru2 qfy2011-201010
All ru2 qfy2011-201010All ru2 qfy2011-201010
All ru2 qfy2011-201010Angel Broking
 
Concor ru2 qfy2011-201010
Concor ru2 qfy2011-201010Concor ru2 qfy2011-201010
Concor ru2 qfy2011-201010Angel Broking
 
All cargo result update 1 qcy2010 050510
All cargo result update 1 qcy2010 050510All cargo result update 1 qcy2010 050510
All cargo result update 1 qcy2010 050510Angel Broking
 
Infosys ru2 qfy2011-151010
Infosys  ru2 qfy2011-151010Infosys  ru2 qfy2011-151010
Infosys ru2 qfy2011-151010Angel Broking
 
Infotech Result Update
Infotech Result UpdateInfotech Result Update
Infotech Result UpdateAngel Broking
 
Tata motors ru4 qfy2010-280510
Tata motors  ru4 qfy2010-280510Tata motors  ru4 qfy2010-280510
Tata motors ru4 qfy2010-280510Angel Broking
 

Ähnlich wie Note Goldman Sachs sur Maroc Telecom Février 2013 (20)

Infosys 1 qfy2012ru-12072011
Infosys 1 qfy2012ru-12072011Infosys 1 qfy2012ru-12072011
Infosys 1 qfy2012ru-12072011
 
Infosys Result Updated
Infosys Result UpdatedInfosys Result Updated
Infosys Result Updated
 
E72 f1fc5d01
E72 f1fc5d01E72 f1fc5d01
E72 f1fc5d01
 
E72 f1fc5d01
E72 f1fc5d01E72 f1fc5d01
E72 f1fc5d01
 
Hdil ru4 qfy2010-28052010
Hdil ru4 qfy2010-28052010Hdil ru4 qfy2010-28052010
Hdil ru4 qfy2010-28052010
 
Bhel 020212
Bhel 020212Bhel 020212
Bhel 020212
 
Tata consultancy services
Tata consultancy services Tata consultancy services
Tata consultancy services
 
Elecon engineering ic- 14-05-10
Elecon engineering   ic- 14-05-10Elecon engineering   ic- 14-05-10
Elecon engineering ic- 14-05-10
 
61107576 rallis-india
61107576 rallis-india61107576 rallis-india
61107576 rallis-india
 
Bhel 020212
Bhel 020212Bhel 020212
Bhel 020212
 
Persistent systems
Persistent systemsPersistent systems
Persistent systems
 
L&T - Result Update RU2QFY2011
L&T - Result Update RU2QFY2011L&T - Result Update RU2QFY2011
L&T - Result Update RU2QFY2011
 
All ru2 qfy2011-201010
All ru2 qfy2011-201010All ru2 qfy2011-201010
All ru2 qfy2011-201010
 
Idea Cellular
Idea  CellularIdea  Cellular
Idea Cellular
 
Concor ru2 qfy2011-201010
Concor ru2 qfy2011-201010Concor ru2 qfy2011-201010
Concor ru2 qfy2011-201010
 
All cargo result update 1 qcy2010 050510
All cargo result update 1 qcy2010 050510All cargo result update 1 qcy2010 050510
All cargo result update 1 qcy2010 050510
 
Infosys ru2 qfy2011-151010
Infosys  ru2 qfy2011-151010Infosys  ru2 qfy2011-151010
Infosys ru2 qfy2011-151010
 
Wipro
Wipro  Wipro
Wipro
 
Infotech Result Update
Infotech Result UpdateInfotech Result Update
Infotech Result Update
 
Tata motors ru4 qfy2010-280510
Tata motors  ru4 qfy2010-280510Tata motors  ru4 qfy2010-280510
Tata motors ru4 qfy2010-280510
 

Mehr von www.bourse-maroc.org

Quarterly Economic Review-février-2024.pdf
Quarterly Economic Review-février-2024.pdfQuarterly Economic Review-février-2024.pdf
Quarterly Economic Review-février-2024.pdfwww.bourse-maroc.org
 
Stock guide des principales valeurs marocaines octobre 2019
Stock guide des principales valeurs marocaines   octobre 2019Stock guide des principales valeurs marocaines   octobre 2019
Stock guide des principales valeurs marocaines octobre 2019www.bourse-maroc.org
 
Bmce capital research earnings s1 2018
Bmce capital research earnings s1 2018Bmce capital research earnings s1 2018
Bmce capital research earnings s1 2018www.bourse-maroc.org
 
Rapport parlementaire sur le prix des carburants التقرير التركيبي للمهمة الست...
Rapport parlementaire sur le prix des carburants التقرير التركيبي للمهمة الست...Rapport parlementaire sur le prix des carburants التقرير التركيبي للمهمة الست...
Rapport parlementaire sur le prix des carburants التقرير التركيبي للمهمة الست...www.bourse-maroc.org
 
Stock guide des principales valeurs marocaines avril 2018
Stock guide des principales valeurs marocaines   avril 2018Stock guide des principales valeurs marocaines   avril 2018
Stock guide des principales valeurs marocaines avril 2018www.bourse-maroc.org
 
Revue et perspectives du marché 2018E ( CFG )
Revue et perspectives du marché 2018E ( CFG )Revue et perspectives du marché 2018E ( CFG )
Revue et perspectives du marché 2018E ( CFG )www.bourse-maroc.org
 
Stock guide des principales valeurs marocaines octobre 2017
Stock guide des principales valeurs marocaines   octobre 2017Stock guide des principales valeurs marocaines   octobre 2017
Stock guide des principales valeurs marocaines octobre 2017www.bourse-maroc.org
 
Stock guide des principales valeurs marocaines mai 2017
Stock guide des principales valeurs marocaines   mai 2017Stock guide des principales valeurs marocaines   mai 2017
Stock guide des principales valeurs marocaines mai 2017www.bourse-maroc.org
 
Bmce capital research forecast t1 2017
Bmce capital research forecast t1 2017Bmce capital research forecast t1 2017
Bmce capital research forecast t1 2017www.bourse-maroc.org
 
Bcp _a_la_recherche_de_la_croissance_en_afrique
Bcp  _a_la_recherche_de_la_croissance_en_afriqueBcp  _a_la_recherche_de_la_croissance_en_afrique
Bcp _a_la_recherche_de_la_croissance_en_afriquewww.bourse-maroc.org
 
Ciment du maroc___le_franchissement_d'un_nouveau_palier_en_termes_de_dividende
Ciment du maroc___le_franchissement_d'un_nouveau_palier_en_termes_de_dividendeCiment du maroc___le_franchissement_d'un_nouveau_palier_en_termes_de_dividende
Ciment du maroc___le_franchissement_d'un_nouveau_palier_en_termes_de_dividendewww.bourse-maroc.org
 
Plan Génération Cash 4éme trimestre 2016
Plan Génération Cash 4éme trimestre 2016Plan Génération Cash 4éme trimestre 2016
Plan Génération Cash 4éme trimestre 2016www.bourse-maroc.org
 
2017, l'année de_l'action_par_excellence
2017, l'année de_l'action_par_excellence2017, l'année de_l'action_par_excellence
2017, l'année de_l'action_par_excellencewww.bourse-maroc.org
 
Stock guide des principales valeurs marocaines novembre 2016
Stock guide des principales valeurs marocaines   novembre 2016Stock guide des principales valeurs marocaines   novembre 2016
Stock guide des principales valeurs marocaines novembre 2016www.bourse-maroc.org
 
Bmce capital research flash rds 02 11 16
Bmce capital research flash rds 02 11 16Bmce capital research flash rds 02 11 16
Bmce capital research flash rds 02 11 16www.bourse-maroc.org
 
Bmce capital research flash cosumar 16 06 16
Bmce capital research flash cosumar 16 06 16Bmce capital research flash cosumar 16 06 16
Bmce capital research flash cosumar 16 06 16www.bourse-maroc.org
 
Bmce capital research flash managem 02 06 16
Bmce capital research flash managem 02 06 16Bmce capital research flash managem 02 06 16
Bmce capital research flash managem 02 06 16www.bourse-maroc.org
 

Mehr von www.bourse-maroc.org (20)

Quarterly Economic Review-février-2024.pdf
Quarterly Economic Review-février-2024.pdfQuarterly Economic Review-février-2024.pdf
Quarterly Economic Review-février-2024.pdf
 
Stock guide des principales valeurs marocaines octobre 2019
Stock guide des principales valeurs marocaines   octobre 2019Stock guide des principales valeurs marocaines   octobre 2019
Stock guide des principales valeurs marocaines octobre 2019
 
Mutandis
Mutandis Mutandis
Mutandis
 
Bmce capital research earnings s1 2018
Bmce capital research earnings s1 2018Bmce capital research earnings s1 2018
Bmce capital research earnings s1 2018
 
Rapport parlementaire sur le prix des carburants التقرير التركيبي للمهمة الست...
Rapport parlementaire sur le prix des carburants التقرير التركيبي للمهمة الست...Rapport parlementaire sur le prix des carburants التقرير التركيبي للمهمة الست...
Rapport parlementaire sur le prix des carburants التقرير التركيبي للمهمة الست...
 
Stock guide des principales valeurs marocaines avril 2018
Stock guide des principales valeurs marocaines   avril 2018Stock guide des principales valeurs marocaines   avril 2018
Stock guide des principales valeurs marocaines avril 2018
 
Revue et perspectives du marché 2018E ( CFG )
Revue et perspectives du marché 2018E ( CFG )Revue et perspectives du marché 2018E ( CFG )
Revue et perspectives du marché 2018E ( CFG )
 
Stock guide des principales valeurs marocaines octobre 2017
Stock guide des principales valeurs marocaines   octobre 2017Stock guide des principales valeurs marocaines   octobre 2017
Stock guide des principales valeurs marocaines octobre 2017
 
Stock guide des principales valeurs marocaines mai 2017
Stock guide des principales valeurs marocaines   mai 2017Stock guide des principales valeurs marocaines   mai 2017
Stock guide des principales valeurs marocaines mai 2017
 
Bmce capital research forecast t1 2017
Bmce capital research forecast t1 2017Bmce capital research forecast t1 2017
Bmce capital research forecast t1 2017
 
Resultats annuels au 1632017
Resultats annuels au 1632017Resultats annuels au 1632017
Resultats annuels au 1632017
 
Bcp _a_la_recherche_de_la_croissance_en_afrique
Bcp  _a_la_recherche_de_la_croissance_en_afriqueBcp  _a_la_recherche_de_la_croissance_en_afrique
Bcp _a_la_recherche_de_la_croissance_en_afrique
 
Ciment du maroc___le_franchissement_d'un_nouveau_palier_en_termes_de_dividende
Ciment du maroc___le_franchissement_d'un_nouveau_palier_en_termes_de_dividendeCiment du maroc___le_franchissement_d'un_nouveau_palier_en_termes_de_dividende
Ciment du maroc___le_franchissement_d'un_nouveau_palier_en_termes_de_dividende
 
Plan Génération Cash 4éme trimestre 2016
Plan Génération Cash 4éme trimestre 2016Plan Génération Cash 4éme trimestre 2016
Plan Génération Cash 4éme trimestre 2016
 
2017, l'année de_l'action_par_excellence
2017, l'année de_l'action_par_excellence2017, l'année de_l'action_par_excellence
2017, l'année de_l'action_par_excellence
 
Stock guide des principales valeurs marocaines novembre 2016
Stock guide des principales valeurs marocaines   novembre 2016Stock guide des principales valeurs marocaines   novembre 2016
Stock guide des principales valeurs marocaines novembre 2016
 
Bmce capital research flash rds 02 11 16
Bmce capital research flash rds 02 11 16Bmce capital research flash rds 02 11 16
Bmce capital research flash rds 02 11 16
 
Bmce capital research flash cosumar 16 06 16
Bmce capital research flash cosumar 16 06 16Bmce capital research flash cosumar 16 06 16
Bmce capital research flash cosumar 16 06 16
 
Ni marsa ipo_014_2016
Ni marsa ipo_014_2016Ni marsa ipo_014_2016
Ni marsa ipo_014_2016
 
Bmce capital research flash managem 02 06 16
Bmce capital research flash managem 02 06 16Bmce capital research flash managem 02 06 16
Bmce capital research flash managem 02 06 16
 

Kürzlich hochgeladen

Call Girls In DLf Gurgaon ➥99902@11544 ( Best price)100% Genuine Escort In 24...
Call Girls In DLf Gurgaon ➥99902@11544 ( Best price)100% Genuine Escort In 24...Call Girls In DLf Gurgaon ➥99902@11544 ( Best price)100% Genuine Escort In 24...
Call Girls In DLf Gurgaon ➥99902@11544 ( Best price)100% Genuine Escort In 24...lizamodels9
 
Call Girls in Gomti Nagar - 7388211116 - With room Service
Call Girls in Gomti Nagar - 7388211116  - With room ServiceCall Girls in Gomti Nagar - 7388211116  - With room Service
Call Girls in Gomti Nagar - 7388211116 - With room Servicediscovermytutordmt
 
Catalogue ONG NUOC PPR DE NHAT .pdf
Catalogue ONG NUOC PPR DE NHAT      .pdfCatalogue ONG NUOC PPR DE NHAT      .pdf
Catalogue ONG NUOC PPR DE NHAT .pdfOrient Homes
 
GD Birla and his contribution in management
GD Birla and his contribution in managementGD Birla and his contribution in management
GD Birla and his contribution in managementchhavia330
 
Catalogue ONG NƯỚC uPVC - HDPE DE NHAT.pdf
Catalogue ONG NƯỚC uPVC - HDPE DE NHAT.pdfCatalogue ONG NƯỚC uPVC - HDPE DE NHAT.pdf
Catalogue ONG NƯỚC uPVC - HDPE DE NHAT.pdfOrient Homes
 
MONA 98765-12871 CALL GIRLS IN LUDHIANA LUDHIANA CALL GIRL
MONA 98765-12871 CALL GIRLS IN LUDHIANA LUDHIANA CALL GIRLMONA 98765-12871 CALL GIRLS IN LUDHIANA LUDHIANA CALL GIRL
MONA 98765-12871 CALL GIRLS IN LUDHIANA LUDHIANA CALL GIRLSeo
 
Mysore Call Girls 8617370543 WhatsApp Number 24x7 Best Services
Mysore Call Girls 8617370543 WhatsApp Number 24x7 Best ServicesMysore Call Girls 8617370543 WhatsApp Number 24x7 Best Services
Mysore Call Girls 8617370543 WhatsApp Number 24x7 Best ServicesDipal Arora
 
VIP Kolkata Call Girl Howrah 👉 8250192130 Available With Room
VIP Kolkata Call Girl Howrah 👉 8250192130  Available With RoomVIP Kolkata Call Girl Howrah 👉 8250192130  Available With Room
VIP Kolkata Call Girl Howrah 👉 8250192130 Available With Roomdivyansh0kumar0
 
DEPED Work From Home WORKWEEK-PLAN.docx
DEPED Work From Home  WORKWEEK-PLAN.docxDEPED Work From Home  WORKWEEK-PLAN.docx
DEPED Work From Home WORKWEEK-PLAN.docxRodelinaLaud
 
7.pdf This presentation captures many uses and the significance of the number...
7.pdf This presentation captures many uses and the significance of the number...7.pdf This presentation captures many uses and the significance of the number...
7.pdf This presentation captures many uses and the significance of the number...Paul Menig
 
Call Girls Navi Mumbai Just Call 9907093804 Top Class Call Girl Service Avail...
Call Girls Navi Mumbai Just Call 9907093804 Top Class Call Girl Service Avail...Call Girls Navi Mumbai Just Call 9907093804 Top Class Call Girl Service Avail...
Call Girls Navi Mumbai Just Call 9907093804 Top Class Call Girl Service Avail...Dipal Arora
 
Mondelez State of Snacking and Future Trends 2023
Mondelez State of Snacking and Future Trends 2023Mondelez State of Snacking and Future Trends 2023
Mondelez State of Snacking and Future Trends 2023Neil Kimberley
 
Sales & Marketing Alignment: How to Synergize for Success
Sales & Marketing Alignment: How to Synergize for SuccessSales & Marketing Alignment: How to Synergize for Success
Sales & Marketing Alignment: How to Synergize for SuccessAggregage
 
Monte Carlo simulation : Simulation using MCSM
Monte Carlo simulation : Simulation using MCSMMonte Carlo simulation : Simulation using MCSM
Monte Carlo simulation : Simulation using MCSMRavindra Nath Shukla
 
Call Girls In Panjim North Goa 9971646499 Genuine Service
Call Girls In Panjim North Goa 9971646499 Genuine ServiceCall Girls In Panjim North Goa 9971646499 Genuine Service
Call Girls In Panjim North Goa 9971646499 Genuine Serviceritikaroy0888
 
Best VIP Call Girls Noida Sector 40 Call Me: 8448380779
Best VIP Call Girls Noida Sector 40 Call Me: 8448380779Best VIP Call Girls Noida Sector 40 Call Me: 8448380779
Best VIP Call Girls Noida Sector 40 Call Me: 8448380779Delhi Call girls
 
The Coffee Bean & Tea Leaf(CBTL), Business strategy case study
The Coffee Bean & Tea Leaf(CBTL), Business strategy case studyThe Coffee Bean & Tea Leaf(CBTL), Business strategy case study
The Coffee Bean & Tea Leaf(CBTL), Business strategy case studyEthan lee
 

Kürzlich hochgeladen (20)

Call Girls In DLf Gurgaon ➥99902@11544 ( Best price)100% Genuine Escort In 24...
Call Girls In DLf Gurgaon ➥99902@11544 ( Best price)100% Genuine Escort In 24...Call Girls In DLf Gurgaon ➥99902@11544 ( Best price)100% Genuine Escort In 24...
Call Girls In DLf Gurgaon ➥99902@11544 ( Best price)100% Genuine Escort In 24...
 
Call Girls in Gomti Nagar - 7388211116 - With room Service
Call Girls in Gomti Nagar - 7388211116  - With room ServiceCall Girls in Gomti Nagar - 7388211116  - With room Service
Call Girls in Gomti Nagar - 7388211116 - With room Service
 
Catalogue ONG NUOC PPR DE NHAT .pdf
Catalogue ONG NUOC PPR DE NHAT      .pdfCatalogue ONG NUOC PPR DE NHAT      .pdf
Catalogue ONG NUOC PPR DE NHAT .pdf
 
GD Birla and his contribution in management
GD Birla and his contribution in managementGD Birla and his contribution in management
GD Birla and his contribution in management
 
Catalogue ONG NƯỚC uPVC - HDPE DE NHAT.pdf
Catalogue ONG NƯỚC uPVC - HDPE DE NHAT.pdfCatalogue ONG NƯỚC uPVC - HDPE DE NHAT.pdf
Catalogue ONG NƯỚC uPVC - HDPE DE NHAT.pdf
 
MONA 98765-12871 CALL GIRLS IN LUDHIANA LUDHIANA CALL GIRL
MONA 98765-12871 CALL GIRLS IN LUDHIANA LUDHIANA CALL GIRLMONA 98765-12871 CALL GIRLS IN LUDHIANA LUDHIANA CALL GIRL
MONA 98765-12871 CALL GIRLS IN LUDHIANA LUDHIANA CALL GIRL
 
Mysore Call Girls 8617370543 WhatsApp Number 24x7 Best Services
Mysore Call Girls 8617370543 WhatsApp Number 24x7 Best ServicesMysore Call Girls 8617370543 WhatsApp Number 24x7 Best Services
Mysore Call Girls 8617370543 WhatsApp Number 24x7 Best Services
 
VIP Kolkata Call Girl Howrah 👉 8250192130 Available With Room
VIP Kolkata Call Girl Howrah 👉 8250192130  Available With RoomVIP Kolkata Call Girl Howrah 👉 8250192130  Available With Room
VIP Kolkata Call Girl Howrah 👉 8250192130 Available With Room
 
Forklift Operations: Safety through Cartoons
Forklift Operations: Safety through CartoonsForklift Operations: Safety through Cartoons
Forklift Operations: Safety through Cartoons
 
DEPED Work From Home WORKWEEK-PLAN.docx
DEPED Work From Home  WORKWEEK-PLAN.docxDEPED Work From Home  WORKWEEK-PLAN.docx
DEPED Work From Home WORKWEEK-PLAN.docx
 
7.pdf This presentation captures many uses and the significance of the number...
7.pdf This presentation captures many uses and the significance of the number...7.pdf This presentation captures many uses and the significance of the number...
7.pdf This presentation captures many uses and the significance of the number...
 
Call Girls Navi Mumbai Just Call 9907093804 Top Class Call Girl Service Avail...
Call Girls Navi Mumbai Just Call 9907093804 Top Class Call Girl Service Avail...Call Girls Navi Mumbai Just Call 9907093804 Top Class Call Girl Service Avail...
Call Girls Navi Mumbai Just Call 9907093804 Top Class Call Girl Service Avail...
 
Mondelez State of Snacking and Future Trends 2023
Mondelez State of Snacking and Future Trends 2023Mondelez State of Snacking and Future Trends 2023
Mondelez State of Snacking and Future Trends 2023
 
Sales & Marketing Alignment: How to Synergize for Success
Sales & Marketing Alignment: How to Synergize for SuccessSales & Marketing Alignment: How to Synergize for Success
Sales & Marketing Alignment: How to Synergize for Success
 
Monte Carlo simulation : Simulation using MCSM
Monte Carlo simulation : Simulation using MCSMMonte Carlo simulation : Simulation using MCSM
Monte Carlo simulation : Simulation using MCSM
 
Call Girls In Panjim North Goa 9971646499 Genuine Service
Call Girls In Panjim North Goa 9971646499 Genuine ServiceCall Girls In Panjim North Goa 9971646499 Genuine Service
Call Girls In Panjim North Goa 9971646499 Genuine Service
 
Best VIP Call Girls Noida Sector 40 Call Me: 8448380779
Best VIP Call Girls Noida Sector 40 Call Me: 8448380779Best VIP Call Girls Noida Sector 40 Call Me: 8448380779
Best VIP Call Girls Noida Sector 40 Call Me: 8448380779
 
Best Practices for Implementing an External Recruiting Partnership
Best Practices for Implementing an External Recruiting PartnershipBest Practices for Implementing an External Recruiting Partnership
Best Practices for Implementing an External Recruiting Partnership
 
Nepali Escort Girl Kakori \ 9548273370 Indian Call Girls Service Lucknow ₹,9517
Nepali Escort Girl Kakori \ 9548273370 Indian Call Girls Service Lucknow ₹,9517Nepali Escort Girl Kakori \ 9548273370 Indian Call Girls Service Lucknow ₹,9517
Nepali Escort Girl Kakori \ 9548273370 Indian Call Girls Service Lucknow ₹,9517
 
The Coffee Bean & Tea Leaf(CBTL), Business strategy case study
The Coffee Bean & Tea Leaf(CBTL), Business strategy case studyThe Coffee Bean & Tea Leaf(CBTL), Business strategy case study
The Coffee Bean & Tea Leaf(CBTL), Business strategy case study
 

Note Goldman Sachs sur Maroc Telecom Février 2013

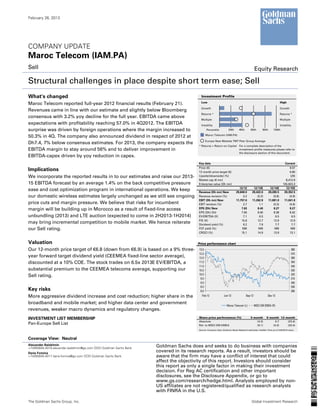
  • 1. February 26, 2013 COMPANY UPDATE Maroc Telecom (IAM.PA) Sell Equity Research Structural challenges in place despite short term ease; Sell What's changed Investment Profile Low High Maroc Telecom reported full-year 2012 financial results (February 21). Growth Growth Revenues came in line with our estimate and slightly below Bloomberg Returns * Returns * consensus with 3.2% yoy decline for the full year. EBITDA came above Multiple Multiple expectations with profitability reaching 57.0% in 4Q2012. The EBITDA Volatility Volatility surprise was driven by foreign operations where the margin increased to Percentile 20th 40th 60th 80th 100th Maroc Telecom (IAM.PA) 50.3% in 4Q. The company also announced dividend in respect of 2012 at Europe New Markets TMT Peer Group Average Dh7.4, 7% below consensus estimates. For 2013, the company expects the * Returns = Return on Capital For a complete description of the EBITDA margin to stay around 56% and to deliver improvement in investment profile measures please refer to the disclosure section of this document. EBITDA-capex driven by yoy reduction in capex. Key data Current Price (€) 9.57 Implications 12 month price target (€) 6.80 We incorporate the reported results in to our estimates and raise our 2013- Upside/(downside) (%) (29) Market cap (€ mn) 8,412.9 15 EBITDA forecast by an average 1.4% on the back competitive pressure Enterprise value (Dh mn) 105,923.3 12/12 12/13E 12/14E 12/15E ease and cost optimization program in international operations. We keep Revenue (Dh mn) New 29,849.0 29,422.0 29,265.5 29,352.5 our domestic wireless estimates largely unchanged as we still see ongoing Revenue revision (%) 0.2 (0.3) (0.8) (0.9) EBIT (Dh mn) New 11,757.0 11,262.9 11,081.0 11,041.8 price cuts and margin pressure. We believe that risks for incumbent EBIT revision (%) 2.7 1.1 (0.3) (0.9) margin will be building up in Morocco as a result of fixed-line access EPS (Dh) New 7.63 8.40 8.27 8.27 EPS (Dh) Old 7.94 8.40 8.38 8.42 unbundling (2013) and LTE auction (expected to come in 2H2013-1H2014) EV/EBITDA (X) 7.1 6.5 6.5 6.5 P/E (X) 15.6 12.7 12.9 12.9 may bring incremental competition to mobile market. We hence reiterate Dividend yield (%) 6.2 7.9 7.7 7.7 our Sell rating. FCF yield (%) NM NM NM NM CROCI (%) 15.1 14.9 13.9 13.1 Valuation Price performance chart Our 12-month price target of €6.8 (down from €6.9) is based on a 9% three- 13.0 380 12.5 370 year forward target dividend yield (CEEMEA fixed-line sector average), 12.0 360 discounted at a 10% COE. The stock trades on 6.5x 2013E EV/EBITDA, a 11.5 350 11.0 340 substantial premium to the CEEMEA telecoms average, supporting our 10.5 330 10.0 320 Sell rating. 9.5 310 9.0 300 8.5 290 Key risks 8.0 280 More aggressive dividend increase and cost reduction; higher share in the Feb-12 Jun-12 Sep-12 Dec-12 broadband and mobile market; and higher data center and government Maroc Telecom (L) MSCI EM EMEA (R) revenues, weaker macro dynamics and regulatory changes. INVESTMENT LIST MEMBERSHIP Share price performance (%) 3 month 6 month 12 month Absolute (4.3) 0.7 (23.4) Pan-Europe Sell List Rel. to MSCI EM EMEA (9.1) (4.4) (20.4) Source: Company data, Goldman Sachs Research estimates, FactSet. Price as of 2/26/2013 close. Coverage View: Neutral Alexander Balakhnin Goldman Sachs does and seeks to do business with companies +7(495)645-4016 alexander.balakhnin@gs.com OOO Goldman Sachs Bank Daria Fomina covered in its research reports. As a result, investors should be +7(495)645-4017 daria.fomina@gs.com OOO Goldman Sachs Bank aware that the firm may have a conflict of interest that could affect the objectivity of this report. Investors should consider this report as only a single factor in making their investment decision. For Reg AC certification and other important disclosures, see the Disclosure Appendix, or go to www.gs.com/research/hedge.html. Analysts employed by non- US affiliates are not registered/qualified as research analysts with FINRA in the U.S. The Goldman Sachs Group, Inc. Global Investment Research
  • 2. February 26, 2013 Maroc Telecom (IAM.PA) Maroc Telecom: Summary Financials Profit model (Dh mn) 12/12 12/13E 12/14E 12/15E Balance sheet (Dh mn) 12/12 12/13E 12/14E 12/15E Total revenue 29,849.0 29,422.0 29,265.5 29,352.5 Operating costs (13,146.0) (13,048.8) (13,097.8) (13,235.8) Cash & equivalents 964.0 2,393.7 3,067.0 4,047.8 R&D 0.0 0.0 0.0 0.0 Accounts receivable 10,291.0 10,143.8 10,089.8 10,119.8 Lease payments 0.0 0.0 0.0 0.0 Inventory 468.0 461.3 458.9 460.2 Other operating profit/(expense) 0.0 0.0 0.0 0.0 Other current assets 106.0 106.0 106.0 106.0 EBITDA 16,703.0 16,373.1 16,167.7 16,116.7 Total current assets 11,829.0 13,104.8 13,721.7 14,733.8 Depreciation & amortisation (4,946.0) (5,110.2) (5,086.7) (5,074.9) Net PP&E 25,476.0 25,152.3 24,691.6 24,258.7 EBIT 11,757.0 11,262.9 11,081.0 11,041.8 Net intangibles 10,322.0 10,390.2 10,446.6 10,501.0 Net interest income/(expense) (344.0) (349.0) (342.8) (303.4) Total investments 266.0 266.0 266.0 266.0 Associates 0.0 0.0 0.0 0.0 Other long-term assets 56.0 56.0 56.0 56.0 Profit/(loss) on disposals 0.0 0.0 0.0 0.0 Total assets 47,949.0 48,969.2 49,181.9 49,815.5 Others (recurring) (862.0) 0.0 0.0 0.0 Pretax profits 10,551.0 10,914.0 10,738.3 10,738.4 Accounts payable 17,394.0 17,145.2 17,054.0 17,104.7 Income tax (3,272.0) (3,219.6) (3,167.8) (3,167.8) Short-term debt 7,259.0 7,259.0 7,259.0 7,259.0 Tax rate (%) 31.0 29.5 29.5 29.5 Other current liabilities 649.0 649.0 649.0 649.0 Minorities (574.0) (307.8) (302.8) (302.8) Total current liabilities 25,302.0 25,053.2 24,962.0 25,012.7 Preferred dividends 0.0 0.0 0.0 0.0 Long-term debt 886.0 966.0 1,086.0 1,366.0 Net income (pre-exceptionals) 6,705.0 7,386.6 7,267.7 7,267.8 Other long-term liabilities 1,068.0 1,068.0 1,068.0 1,068.0 Other non-recurring items post tax 42.8 0.0 0.0 0.0 Total long-term liabilities 1,954.0 2,034.0 2,154.0 2,434.0 Net income 6,747.8 7,386.6 7,267.7 7,267.8 Total liabilities 27,256.0 27,087.2 27,116.0 27,446.7 EPS (underlying) (Dh) 7.63 8.40 8.27 8.27 EPS (basic, reported) (Dh) 7.68 8.40 8.27 8.27 Preferred shares 0.0 0.0 0.0 0.0 Weighted shares outstanding (mn) 879.1 879.1 879.1 879.1 Total common equity 16,294.0 17,175.3 17,056.3 17,056.5 Minority interest 4,399.0 4,706.8 5,009.6 5,312.4 Common dividends declared 6,505.3 7,386.6 7,267.7 7,267.8 DPS (Dh) 7.40 8.40 8.27 8.27 Total liabilities & equity 47,949.0 48,969.2 49,181.9 49,815.5 Dividend payout ratio (%) 97.0 100.0 100.0 100.0 Capitalised leases 0.0 0.0 0.0 0.0 Dividend cover (X) 1.0 1.0 1.0 1.0 Capital employed 28,838.0 30,107.0 30,410.9 30,993.9 Growth & margins (%) 12/12 12/13E 12/14E 12/15E Revenue growth (3.2) (1.4) (0.5) 0.3 Adj for unfunded pensions & GW (10,322.0) (10,390.2) (10,446.6) (10,501.0) EBITDA growth (1.7) (2.0) (1.3) (0.3) Adj capital employed 18,516.0 19,716.9 19,964.3 20,492.8 EBIT growth (5.0) (4.2) (1.6) (0.4) Gross cash invested 87,605.0 92,796.7 97,747.5 102,658.8 Net income growth (17.4) 9.5 (1.6) 0.0 EPS growth (17.5) 10.2 (1.6) 0.0 Ratios 12/12 12/13E 12/14E 12/15E DPS growth (20.1) 13.5 (1.6) 0.0 EBITDA margin 56.0 55.6 55.2 54.9 CROCI (%) 15.1 14.9 13.9 13.1 EBIT margin 39.4 38.3 37.9 37.6 CROCI/WACC (X) -- -- -- -- Cash flow statement (Dh mn) 12/12 12/13E 12/14E 12/15E ROIC (%) 44.4 42.8 40.5 39.6 Net income 6,705.0 7,386.6 7,267.7 7,267.8 ROIC/WACC (X) -- -- -- -- D&A add-back (incl. ESO) 4,946.0 5,110.2 5,086.7 5,074.9 ROA (%) 15.6 16.4 15.9 15.7 Minority interest add-back 574.0 307.8 302.8 302.8 WACC (%) -- -- -- -- Net (inc)/dec working capital 1,145.0 (94.9) (34.8) 19.3 Inventory days 7.2 5.8 5.7 5.7 Other operating cash flow 504.0 349.0 342.8 303.4 Asset turnover (X) 1.2 1.2 1.2 1.2 Cash flow from operations 13,874.0 13,058.6 12,965.2 12,968.2 Net debt/equity (%) 34.7 26.6 23.9 20.5 EBITDA interest cover (X) 48.6 46.9 47.2 53.1 Capital expenditures (5,106.0) (4,854.6) (4,682.5) (4,696.4) Acquisitions 0.0 0.0 0.0 0.0 Valuation 12/12 12/13E 12/14E 12/15E Divestitures 37.0 0.0 0.0 0.0 EV/sales (X) 4.0 3.6 3.6 3.6 Others 71.0 0.0 0.0 0.0 EV/EBITDAR (X) 7.1 6.5 6.5 6.5 Cash flow from investing (4,998.0) (4,854.6) (4,682.5) (4,696.4) EV/EBITDA (X) 7.1 6.5 6.5 6.5 EV/EBIT (X) 10.1 9.4 9.5 9.5 Dividends paid (common & pref) (8,317.0) (6,505.3) (7,386.6) (7,267.7) P/E (X) 15.6 12.7 12.9 12.9 Inc/(dec) in debt 916.0 80.0 120.0 280.0 Dividend yield (%) 6.2 7.9 7.7 7.7 Other financing cash flows (1,119.0) (349.0) (342.8) (303.4) FCF yield (%) NM NM NM NM Cash flow from financing (8,520.0) (6,774.3) (7,609.4) (7,291.1) EV/GCI (X) 1.4 1.1 1.1 1.0 Total cash flow 347.0 1,429.7 673.3 980.7 EV/adj. capital employed (X) 6.7 6.1 6.2 6.4 Price/book (X) 6.0 5.5 5.5 5.5 Capex/D&A (%) 103.2 95.0 92.1 92.5 Reinvestment rate (%) 40.1 36.9 36.0 36.3 Note: Ratios are adjusted for leases where appropriate. Only separately disclosed where significant and ongoing. Cash flow cover of dividends (X) 2.0 1.8 1.8 1.8 Free cash flow cover of dividends (X) 1.5 1.2 1.2 1.2 Note: Last actual year may include reported and estimated data. Free cash flow -- -- -- -- Source: Company data, Goldman Sachs Research estimates. Analyst Contributors Alexander Balakhnin alexander.balakhnin@gs.com Daria Fomina daria.fomina@gs.com Goldman Sachs Global Investment Research 2
  • 3. February 26, 2013 Maroc Telecom (IAM.PA) Exhibit 1: Maroc Telecom estimate changes (Dh mn, per share data Dh) Old New Change 2012 2013E 2014E 2015E 2012 2013E 2014E 2015E 2012 2013E 2014E 2015E Revenues 29,777 29,509 29,510 29,625 29,849 29,422 29,266 29,353 0.2% -0.3% -0.8% -0.9% EBITDA 16,391 16,051 15,935 16,012 16,703 16,373 16,168 16,117 1.9% 2.0% 1.5% 0.7% EBITDA margin 55.0% 54.4% 54.0% 54.0% 56.0% 55.6% 55.2% 54.9% 91 bps 126 bps 125 bps 86 bps Net income 6,984 7,381 7,370 7,405 6,705 7,387 7,268 7,268 -4.0% 0.1% -1.4% -1.9% EPS (MAD) 7.94 8.40 8.38 8.42 7.63 8.40 8.27 8.27 -4.0% 0.1% -1.4% -1.9% Source: Company data, Goldman Sachs Research estimates. Exhibit 2: Our new 12 month price target is €6.8 DPS (MAD) 2014 2015 8.3 8.27 Valuation Average DPS 8.27 Target dividend yeild 9% Target price (EUR) 6.8 Source: Goldman Sachs Research estimates. Goldman Sachs Global Investment Research 3
  • 4. February 26, 2013 Maroc Telecom (IAM.PA) Disclosure Appendix Reg AC We, Alexander Balakhnin and Daria Fomina, hereby certify that all of the views expressed in this report accurately reflect our personal views about the subject company or companies and its or their securities. We also certify that no part of our compensation was, is or will be, directly or indirectly, related to the specific recommendations or views expressed in this report. Investment Profile The Goldman Sachs Investment Profile provides investment context for a security by comparing key attributes of that security to its peer group and market. The four key attributes depicted are: growth, returns, multiple and volatility. Growth, returns and multiple are indexed based on composites of several methodologies to determine the stocks percentile ranking within the region's coverage universe. The precise calculation of each metric may vary depending on the fiscal year, industry and region but the standard approach is as follows: Growth is a composite of next year's estimate over current year's estimate, e.g. EPS, EBITDA, Revenue. Return is a year one prospective aggregate of various return on capital measures, e.g. CROCI, ROACE, and ROE. Multiple is a composite of one-year forward valuation ratios, e.g. P/E, dividend yield, EV/FCF, EV/EBITDA, EV/DACF, Price/Book. Volatility is measured as trailing twelve-month volatility adjusted for dividends. Quantum Quantum is Goldman Sachs' proprietary database providing access to detailed financial statement histories, forecasts and ratios. It can be used for in-depth analysis of a single company, or to make comparisons between companies in different sectors and markets. GS SUSTAIN GS SUSTAIN is a global investment strategy aimed at long-term, long-only performance with a low turnover of ideas. The GS SUSTAIN focus list includes leaders our analysis shows to be well positioned to deliver long term outperformance through sustained competitive advantage and superior returns on capital relative to their global industry peers. Leaders are identified based on quantifiable analysis of three aspects of corporate performance: cash return on cash invested, industry positioning and management quality (the effectiveness of companies' management of the environmental, social and governance issues facing their industry). Disclosures Coverage group(s) of stocks by primary analyst(s) Alexander Balakhnin: EMEA New Markets-MENA Non Financials, EMEA New Markets-Media, EMEA New Markets-Telecoms. EMEA New Markets-MENA Non Financials: Abdullah Abdul Mohsin Al-Khodari Sons Company (Al Khodari), Abdullah Al Othaim Markets Company, Abu Dhabi National Energy (Taqa), Abu Dhabi National Hotels, Advanced Petrochemical Company, Agility The Public Warehousing Company (Agility), Agthia Group, Air Arabia, Aldar Properties, Aldrees Petroleum and Transport Services, Almarai Company, Arab Potash Company, Arabian Cement, Arabtec Holding, Aramex, Bahrain Telecom, Ciments du Maroc, Citadel Capital, Dana Gas, Dar Al Arkan Real Estate Development Company (Dar Al-Arkan), Drake and Scull International, Elsewedy Electric Company, Emaar Properties, Emirates Integrated Telecommunications Company (Du), Emirates Telecommunications Corporation (Etisalat), Etihad Etisalat Co, Fawaz Abdulaziz Alhokair and Company, GB Auto, Galfar Engineering & Contracting, Halwani Brothers, Herfy, Holcim Maroc, Industries Qatar, Jarir Marketing Company, Jordan Phosphate Mines Co., Jordan Telecom, Juhayna Food Industries, Kipco, Kuwait Food Company (Americana), Lafarge Ciments, Maridive and Oil Services, National Industrialization Company (Tasnee), National Petrochemicals Company (Petrochem), Oman Telecom, Omani Qatari Telecommunication Company (Nawras), Orascom Construction Industries, Orascom Development Holding AG, Palm Hills Developments, Qassim Cement Company, Qatar Electricity and Water Company (QEWC), Qatar Gas Transport, Qatar National Cement Company, Rabigh Refineries and Petrochemical (Petro Rabigh), Ras Al Khaimah Ceramic Company (RAK Ceramics), Red Sea Housing, Renaissance Services, Sahara Petrochemical, Saudi Arabia Fertilizer Company (SAFCO), Saudi Arabian Amiantit Company, Saudi Arabian Mining (Maaden), Saudi Basic Industries Corporation (SABIC), Saudi Cement Company (SCC), Saudi Ceramic Company, Saudi Dairy and Foodstuff Company (SADAFCO), Saudi Electricity Company (SEC), Saudi Industrial Investment Group (SIIG), Saudi International Petrochemicals (Sipchem), Saudi Kayan., Saudi Steel Pipe, Saudi Telecom Company, Savola Group, Sixth of October Development and Investment Company (SODIC), Solidere, Sorouh Real Estate, Southern Cement, Suez Cement Company, Talaat Mostafa Group Holding Company (TMG Holding), The National Shipping Company of Saudi Arabia (NSCSA), United Electronics Co (Extra), Vodafone Qatar, Yamama Cement, Yanbu Cement Company, Yanbu National Petrochemicals (YANSAB), Zain KSA, Zamil Industrial Investment Company, ezzsteel. EMEA New Markets-Media: CTC Media, Central European Media Enterprises, Mail.ru Group Ltd., Naspers Ltd., TVN S.A., Yandex N.V.. Goldman Sachs Global Investment Research 4
  • 5. February 26, 2013 Maroc Telecom (IAM.PA) EMEA New Markets-Telecoms: Bezeq, Cellcom Israel Ltd., IBS Group, MTN Group, Magyar Telekom, Maroc Telecom, MegaFon, Mobile Telesystems, Orascom Telecom, Partner, Qtel, Rostelecom (Ord), Sistema JSFC (GDR), TP Group, Telecom Egypt, Telefonica CR, Telkom SA, Turk Telekom, Turkcell (ADR), VimpelCom Ltd., Vodacom, Zain. Company-specific regulatory disclosures The following disclosures relate to relationships between The Goldman Sachs Group, Inc. (with its affiliates, "Goldman Sachs") and companies covered by the Global Investment Research Division of Goldman Sachs and referred to in this research. Goldman Sachs has received compensation for investment banking services in the past 12 months: Maroc Telecom (€9.57) Goldman Sachs expects to receive or intends to seek compensation for investment banking services in the next 3 months: Maroc Telecom (€9.57) Goldman Sachs had an investment banking services client relationship during the past 12 months with: Maroc Telecom (€9.57) Distribution of ratings/investment banking relationships Goldman Sachs Investment Research global coverage universe Rating Distribution Investment Banking Relationships Buy Hold Sell Buy Hold Sell Global 31% 55% 14% 48% 41% 36% As of January 1, 2013, Goldman Sachs Global Investment Research had investment ratings on 3,523 equity securities. Goldman Sachs assigns stocks as Buys and Sells on various regional Investment Lists; stocks not so assigned are deemed Neutral. Such assignments equate to Buy, Hold and Sell for the purposes of the above disclosure required by NASD/NYSE rules. See 'Ratings, Coverage groups and views and related definitions' below. Price target and rating history chart(s) Maroc Te le com (IAM.PA) Stock Price Currency : Euro Goldman Sachs rating and stock price target history 16.00 450 7.1 10 9 14.00 7.8 7.6 400 6.9 12.00 350 10.00 10.1 300 8.00 9.2 9.7 9.9 6.00 250 Stock Price Index Price S F MA M J J A S O N D J F MA M J J A S O N D J F M A M J J A S O N D 2010 2011 2012 Source: Goldman Sachs Investment Research for ratings and price targets; FactSet closing prices as of 12/31/2012. Rating Covered by Alexander Balakhnin, Price target as of Jun 2, 2010 Price target at removal Not covered by current analyst MSCI EM EMEA The price targets show n should be considered in the context of all prior published Goldman Sachs research, w hich may or may not have included price targets, as w ell as developments relating to the company, its industry and f inancial markets. Regulatory disclosures Disclosures required by United States laws and regulations See company-specific regulatory disclosures above for any of the following disclosures required as to companies referred to in this report: manager or co-manager in a pending transaction; 1% or other ownership; compensation for certain services; types of client relationships; managed/co- managed public offerings in prior periods; directorships; for equity securities, market making and/or specialist role. Goldman Sachs usually makes a market in fixed income securities of issuers discussed in this report and usually deals as a principal in these securities. The following are additional required disclosures: Ownership and material conflicts of interest: Goldman Sachs policy prohibits its analysts, professionals reporting to analysts and members of their households from owning securities of any company in the analyst's area of coverage. Analyst compensation: Analysts are paid in part based on the profitability of Goldman Sachs, which includes investment banking revenues. Analyst as officer or director: Goldman Sachs policy prohibits its analysts, persons reporting to analysts or members of their households from serving as an officer, director, advisory board member or employee of any company in the analyst's area of coverage. Non-U.S. Analysts: Non-U.S. analysts may not be associated persons of Goldman, Sachs & Co. and therefore may not be subject to NASD Rule 2711/NYSE Rules 472 restrictions on communications with subject company, public appearances and trading securities held by the analysts. Distribution of ratings: See the distribution of ratings disclosure above. Price chart: See the price chart, with changes of ratings and price targets in prior periods, above, or, if electronic format or if with respect to multiple companies which are the subject of this report, on the Goldman Sachs website at http://www.gs.com/research/hedge.html. Additional disclosures required under the laws and regulations of jurisdictions other than the United States The following disclosures are those required by the jurisdiction indicated, except to the extent already made above pursuant to United States laws and regulations. Australia: Goldman Sachs Australia Pty Ltd and its affiliates are not authorised deposit-taking institutions (as that term is defined in the Banking Act 1959 (Cth)) in Australia and do not provide banking services, nor carry on a banking business, in Australia. This research, and any access to it, is intended only for "wholesale clients" within the meaning of the Australian Corporations Act, unless otherwise agreed by Goldman Sachs. Brazil: Disclosure information in relation to CVM Instruction 483 is available at http://www.gs.com/worldwide/brazil/area/gir/index.html. Where applicable, the Brazil-registered analyst primarily responsible for the content of this research report, as defined in Article 16 of CVM Instruction 483, is the first author named at the beginning of this report, unless indicated otherwise at the end of the text. Canada: Goldman, Sachs & Co. has approved of, and agreed to take responsibility for, this research in Canada if and to the extent it relates to equity securities of Canadian issuers. Analysts may conduct site visits but are prohibited from accepting payment or reimbursement by the company of travel expenses for such Goldman Sachs Global Investment Research 5
  • 6. February 26, 2013 Maroc Telecom (IAM.PA) visits. Hong Kong: Further information on the securities of covered companies referred to in this research may be obtained on request from Goldman Sachs (Asia) L.L.C. India: Further information on the subject company or companies referred to in this research may be obtained from Goldman Sachs (India) Securities Private Limited; Japan: See below. Korea: Further information on the subject company or companies referred to in this research may be obtained from Goldman Sachs (Asia) L.L.C., Seoul Branch. New Zealand: Goldman Sachs New Zealand Limited and its affiliates are neither "registered banks" nor "deposit takers" (as defined in the Reserve Bank of New Zealand Act 1989) in New Zealand. This research, and any access to it, is intended for "wholesale clients" (as defined in the Financial Advisers Act 2008) unless otherwise agreed by Goldman Sachs. Russia: Research reports distributed in the Russian Federation are not advertising as defined in the Russian legislation, but are information and analysis not having product promotion as their main purpose and do not provide appraisal within the meaning of the Russian legislation on appraisal activity. Singapore: Further information on the covered companies referred to in this research may be obtained from Goldman Sachs (Singapore) Pte. (Company Number: 198602165W). Taiwan: This material is for reference only and must not be reprinted without permission. Investors should carefully consider their own investment risk. Investment results are the responsibility of the individual investor. United Kingdom: Persons who would be categorized as retail clients in the United Kingdom, as such term is defined in the rules of the Financial Services Authority, should read this research in conjunction with prior Goldman Sachs research on the covered companies referred to herein and should refer to the risk warnings that have been sent to them by Goldman Sachs International. A copy of these risks warnings, and a glossary of certain financial terms used in this report, are available from Goldman Sachs International on request. European Union: Disclosure information in relation to Article 4 (1) (d) and Article 6 (2) of the European Commission Directive 2003/126/EC is available at http://www.gs.com/disclosures/europeanpolicy.html which states the European Policy for Managing Conflicts of Interest in Connection with Investment Research. Japan: Goldman Sachs Japan Co., Ltd. is a Financial Instrument Dealer registered with the Kanto Financial Bureau under registration number Kinsho 69, and a member of Japan Securities Dealers Association, Financial Futures Association of Japan and Type II Financial Instruments Firms Association. Sales and purchase of equities are subject to commission pre-determined with clients plus consumption tax. See company-specific disclosures as to any applicable disclosures required by Japanese stock exchanges, the Japanese Securities Dealers Association or the Japanese Securities Finance Company. Ratings, coverage groups and views and related definitions Buy (B), Neutral (N), Sell (S) -Analysts recommend stocks as Buys or Sells for inclusion on various regional Investment Lists. Being assigned a Buy or Sell on an Investment List is determined by a stock's return potential relative to its coverage group as described below. Any stock not assigned as a Buy or a Sell on an Investment List is deemed Neutral. Each regional Investment Review Committee manages various regional Investment Lists to a global guideline of 25%-35% of stocks as Buy and 10%-15% of stocks as Sell; however, the distribution of Buys and Sells in any particular coverage group may vary as determined by the regional Investment Review Committee. Regional Conviction Buy and Sell lists represent investment recommendations focused on either the size of the potential return or the likelihood of the realization of the return. Return potential represents the price differential between the current share price and the price target expected during the time horizon associated with the price target. Price targets are required for all covered stocks. The return potential, price target and associated time horizon are stated in each report adding or reiterating an Investment List membership. Coverage groups and views: A list of all stocks in each coverage group is available by primary analyst, stock and coverage group at http://www.gs.com/research/hedge.html. The analyst assigns one of the following coverage views which represents the analyst's investment outlook on the coverage group relative to the group's historical fundamentals and/or valuation. Attractive (A). The investment outlook over the following 12 months is favorable relative to the coverage group's historical fundamentals and/or valuation. Neutral (N). The investment outlook over the following 12 months is neutral relative to the coverage group's historical fundamentals and/or valuation. Cautious (C). The investment outlook over the following 12 months is unfavorable relative to the coverage group's historical fundamentals and/or valuation. Not Rated (NR). The investment rating and target price have been removed pursuant to Goldman Sachs policy when Goldman Sachs is acting in an advisory capacity in a merger or strategic transaction involving this company and in certain other circumstances. Rating Suspended (RS). Goldman Sachs Research has suspended the investment rating and price target for this stock, because there is not a sufficient fundamental basis for determining, or there are legal, regulatory or policy constraints around publishing, an investment rating or target. The previous investment rating and price target, if any, are no longer in effect for this stock and should not be relied upon. Coverage Suspended (CS). Goldman Sachs has suspended coverage of this company. Not Covered (NC). Goldman Sachs does not cover this company. Not Available or Not Applicable (NA). The information is not available for display or is not applicable. Not Meaningful (NM). The information is not meaningful and is therefore excluded. Global product; distributing entities The Global Investment Research Division of Goldman Sachs produces and distributes research products for clients of Goldman Sachs on a global basis. Analysts based in Goldman Sachs offices around the world produce equity research on industries and companies, and research on macroeconomics, currencies, commodities and portfolio strategy. This research is disseminated in Australia by Goldman Sachs Australia Pty Ltd (ABN 21 006 797 897); in Brazil by Goldman Sachs do Brasil Corretora de Títulos e Valores Mobiliários S.A.; in Canada by Goldman, Sachs & Co. regarding Canadian equities and by Goldman, Sachs & Co. (all other research); in Hong Kong by Goldman Sachs (Asia) L.L.C.; in India by Goldman Sachs (India) Securities Private Ltd.; in Japan by Goldman Sachs Japan Co., Ltd.; in the Republic of Korea by Goldman Sachs (Asia) L.L.C., Seoul Branch; in New Zealand by Goldman Sachs New Zealand Limited; in Russia by OOO Goldman Sachs; in Singapore by Goldman Sachs (Singapore) Pte. (Company Number: 198602165W); and in the United States of America by Goldman, Sachs & Co. Goldman Sachs International has approved this research in connection with its distribution in the United Kingdom and European Union. European Union: Goldman Sachs International, authorized and regulated by the Financial Services Authority, has approved this research in connection with its distribution in the European Union and United Kingdom; Goldman Sachs AG and Goldman Sachs International Zweigniederlassung Frankfurt, regulated by the Bundesanstalt für Finanzdienstleistungsaufsicht, may also distribute research in Germany. General disclosures This research is for our clients only. Other than disclosures relating to Goldman Sachs, this research is based on current public information that we consider reliable, but we do not represent it is accurate or complete, and it should not be relied on as such. We seek to update our research as appropriate, but various regulations may prevent us from doing so. Other than certain industry reports published on a periodic basis, the large majority of reports are published at irregular intervals as appropriate in the analyst's judgment. Goldman Sachs conducts a global full-service, integrated investment banking, investment management, and brokerage business. We have investment banking and other business relationships with a substantial percentage of the companies covered by our Global Investment Research Division. Goldman, Sachs & Co., the United States broker dealer, is a member of SIPC (http://www.sipc.org). Goldman Sachs Global Investment Research 6
  • 7. February 26, 2013 Maroc Telecom (IAM.PA) Our salespeople, traders, and other professionals may provide oral or written market commentary or trading strategies to our clients and our proprietary trading desks that reflect opinions that are contrary to the opinions expressed in this research. Our asset management area, our proprietary trading desks and investing businesses may make investment decisions that are inconsistent with the recommendations or views expressed in this research. The analysts named in this report may have from time to time discussed with our clients, including Goldman Sachs salespersons and traders, or may discuss in this report, trading strategies that reference catalysts or events that may have a near-term impact on the market price of the equity securities discussed in this report, which impact may be directionally counter to the analysts' published price target expectations for such stocks. Any such trading strategies are distinct from and do not affect the analysts' fundamental equity rating for such stocks, which rating reflects a stock's return potential relative to its coverage group as described herein. We and our affiliates, officers, directors, and employees, excluding equity and credit analysts, will from time to time have long or short positions in, act as principal in, and buy or sell, the securities or derivatives, if any, referred to in this research. This research is not an offer to sell or the solicitation of an offer to buy any security in any jurisdiction where such an offer or solicitation would be illegal. It does not constitute a personal recommendation or take into account the particular investment objectives, financial situations, or needs of individual clients. Clients should consider whether any advice or recommendation in this research is suitable for their particular circumstances and, if appropriate, seek professional advice, including tax advice. The price and value of investments referred to in this research and the income from them may fluctuate. Past performance is not a guide to future performance, future returns are not guaranteed, and a loss of original capital may occur. Fluctuations in exchange rates could have adverse effects on the value or price of, or income derived from, certain investments. Certain transactions, including those involving futures, options, and other derivatives, give rise to substantial risk and are not suitable for all investors. Investors should review current options disclosure documents which are available from Goldman Sachs sales representatives or at http://www.theocc.com/about/publications/character-risks.jsp. Transaction costs may be significant in option strategies calling for multiple purchase and sales of options such as spreads. Supporting documentation will be supplied upon request. In producing research reports, members of the Global Investment Research Division of Goldman Sachs Australia may attend site visits and other meetings hosted by the issuers the subject of its research reports. In some instances the costs of such site visits or meetings may be met in part or in whole by the issuers concerned if Goldman Sachs Australia considers it is appropriate and reasonable in the specific circumstances relating to the site visit or meeting. All research reports are disseminated and available to all clients simultaneously through electronic publication to our internal client websites. Not all research content is redistributed to our clients or available to third-party aggregators, nor is Goldman Sachs responsible for the redistribution of our research by third party aggregators. For all research available on a particular stock, please contact your sales representative or go to http://360.gs.com. Disclosure information is also available at http://www.gs.com/research/hedge.html or from Research Compliance, 200 West Street, New York, NY 10282. © 2013 Goldman Sachs. No part of this material may be (i) copied, photocopied or duplicated in any form by any means or (ii) redistributed without the prior written consent of The Goldman Sachs Group, Inc. Goldman Sachs Global Investment Research 7