CO2 emissions for Brighton and Hove
•Download as PPTX, PDF•
1 like•353 views

The document summarizes CO2 emissions data for Brighton & Hove from 2005 to 2009. It reports that: 1) The target amount of CO2 emissions per person to stabilize climate change is 1 tonne per year. Brighton & Hove residents emitted 4.8 tonnes per person in 2009. 2) Road transport accounted for 27% of end-user CO2 emissions in Brighton & Hove in 2009, while industry and commercial sectors accounted for 43% and the domestic sector accounted for 30%. 3) Emissions vary locally mainly due to economic and geographic differences between areas. The document urges readers to act now on CO2 emissions before it's too late.

Recommended
More Related Content
What's hot
What's hot (20)
Viewers also liked
Similar to CO2 emissions for Brighton and Hove
Similar to CO2 emissions for Brighton and Hove (20)
More from Gavin Barker
More from Gavin Barker (14)
Recently uploaded
Recently uploaded (20)
CO2 emissions for Brighton and Hove
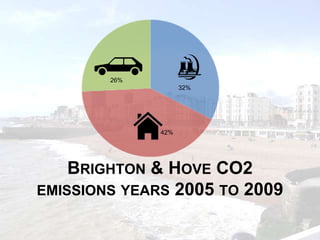
- 1. BRIGHTON & HOVE CO2 EMISSIONS YEARS 2005 TO 2009
- 2. Brighton & Hove CO2 emissions years 2005 to 2009 How does this compare to UK • wide data in 2009? The number of tonnes 43 per cent of end-user emissions 1 per person per year to assigned to local authority areas stabilise climate change were attributed to the industry and commercial sector, The number of tonnes • 30 per cent to the domestic sector 4.8 per person per year • 27 per cent to road transport. emitted by Brighton There are wide local variations on this mainly residents because of the economy and geography of different local areas.
- 3. Brighton and Hove per capita emissions The number of tonnes per 1 person per year to stabilise climate change The number of tonnes per 4.8 person per year emitted by Brighton residents (2009)
- 4. Road transport Brighton & Hove Road transport emissions include both freight and passenger transport, both private and for business purposes. The estimates are made on the basis of the distribution of traffic. This means that some of the emissions within an authority represent through traffic, or part of trips into or out of the area whether by residents or non-residents.
- 5. Domestic CO2 emissions National picture: In 2009, about 47 per cent of domestic end-user emissions arose from gas use, 42 per cent from electricity, and 10 per cent from consumption of other fuels. Between 2005 and 2009, there was a decrease in domestic gas consumption of 16%.
- 6. Industry and Commercial CO2 emissions National picture: the industry and commercial sector had the highest share of end-user emissions in 43 per cent of authorities. The domestic sector the highest share in 32 per cent, and the road transport sector had the highest share in 25 per cent of authorities.
- 7. The number of tonnes 1 per person per year to stabilise climate change The number of tonnes 4.8 per person per year emitted by Brighton residents We are running out of time
- 8. The number of tonnes 1 per person per year to stabilise climate change The number of tonnes 4.8 per person per year emitted by Brighton residents We are running out of time ACT NOW ON CO2
- 9. Before it's too late
- 10. Slideshow by Gavin Barker www.gavin-barker.com KEY SOURCES Click to access source Dept of Energy and Climate Change Local authority subset data YOU ARE WELCOME TO USE THIS SLIDESHOW AS A TEMPLATE FOR YOUR OWN LOCAL AREA PROFILE Should you do so, please delete my name and delete the background picture for this slideshow (go to View>Slidemaster on the toolbar to replace slide background with your own image ) Use the data for your local authority located at the Department of Energy and Climate Change Add in additional content that you think is relevant – but I urge you to keep the CO2 emissions data as the key headline data!