Powerpoint exploring the locations used in television show Time Clash
Iwa 3018 poster
1. Characterization of nanofiltration membranes
for scale prevention in seawater reverse
osmosis
L. Llenas*, G. Ribera*, A. Yaroshchuk**.***, X. Martínez-Lladó*, M. Rovira*.***, J. De Pablo*.***
* CTM Centre Tecnològic; Av. Bases de Manresa 1, 08242 Manresa, Spain
(E-mail: laia.llenas@ctm.com.es, xavier.martinez@ctm.com.es)
** Institució Catalana de Recerca i Estudis Avançats (ICREA)
***Department of Chemical Engineering, Polytechnic University of Catalonia; Av. Diagonal 647, 08028
Barcelona,Spain
INTRODUCTION
One of the major problems in seawater reverse osmosis (SWRO) and a limiting For the parameterization of our experimental data we used the Spiegler – Kedem
factor for its proper operation is membrane scaling (Schäfer et al. 2006). Hassan et model (Spiegler and Kedem. 1966). Within its scope the solute rejection. R. is
al (Hassan et al. 1998), proposed the use of nanofiltration (NF) as a pretreatment of related to the trans-membrane volume flow in this way:
desalination. Feeding of the NF permeate to desalination plants, not only made
possible their operation with less chemicals and raising significantly their permeate
and distillate recovery ratios, but also allowed for lowering their energy consumption.
Several studies have shown that the rejection of scale-forming ions is not the same The fitting parameters obtained with the Spiegler Kedem model are apparent ones,
for various membranes (Hassan et al. 2000). The aim of this work is to study the in particular, because they depend on the cross-flow velocity. However, if this is not
productivity and the selectivity of eleven different nanofiltration membranes to varied (as it was the case in the present study) the apparent reflection coefficients
prevent fouling in SWRO caused by inorganic compounds presents in seawater. All and solute permeabilities can be used for the quantitative comparison of
membranes have been characterized in terms of surface roughness by Atomic performance of various membranes as well as for the interpolation of rejection data
Force Microscopy. between the available experimental points.
METHODOLOGY ION REJECTION RESULTS AND MODEL FITTING
All the experiments were carried out in a laboratory scale Figures 2-5 show the scaling forming ions rejections of different NF membranes tested, as well
cross-flow test cell in total recirculation mode. See Fig. 1: as the fitting with the Spiegler Kedem model.
100 100
90 NF270
NF270 90
80 NF200
NF200
NF
70 NF 80
% Sulphate rejection
% Calcium rejection
ESNA 1-LF2 ESNA 1-LF2
60 K-TFCS
K-TFCS 70
50 K-SR2 K-SR2
40
K-SR3 60 K-SR3
ALNF99 ALNF99
30 NF99HF 50 NF99HF
20 NF90 NF90
40
10
0 30
0 50 100 150 0 50 100 150
Permeate flow (l·h-1·m-2) Permeate flow (l·h-1·m-2)
Fig.1. Flow sheet of experimental system used Fig.2. Calcium rejection and SK fit Fig.3. Sulphate rejection and SK fit
100
100
Atomic Force Microscopy (AFM) has been used to characterize 90 NF270
90
NF270
nanofiltration membranes tested in terms of surface roughness. 80 NF200 80
NF200
% Bicarbonate rejection
% Magnesium rejection
70
NF 70 NF
ESNA 1-LF2
Analytical methods for the analysis of ion rejections: Ionic 60
K-TFCS
60 ESNA 1-LF2
K-TFCS
50
Chromatography (Dionex ICS-2100); Total Carbon Analyzer. 50 K-SR2
K-SR2
40 40
Shimadzu TOC-5050A. was used to analyze inorganic carbon K-SR3
ALNF99
K-SR3
30 30 ALNF99
and Inductively Coupled Plasma Mass Spectrometry (ICP-MS). NF99HF
20 NF99HF
20
Agilent 9500cx 10
NF90
10
NF90
0 0
0 50 100 150 0 50 100 150
Permeate flow (l·h-1·m-2) Permeate flow (l·h-1·m-2)
Fig.4. Magnesium rejection and SK fit Fig.5. Bicarbonate rejection and SK fit
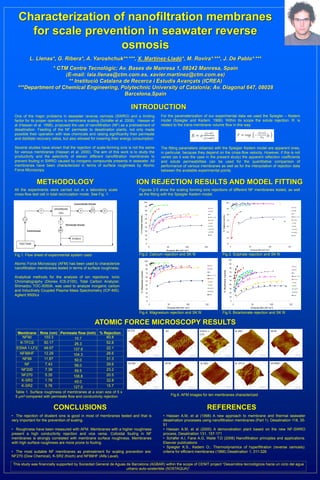
ATOMIC FORCE MICROSCOPY RESULTS
NF270 NF ESNA 1- K-SR3 NF99
Membrane Rms (nm) Permeate flow (lmh) % Rejection LF2
NF90 103.3 10.7 60.8
K-TFCS 50.17 26.3 52.8
ESNA 1-LF2 49.07 137.9 22.1
NF99HF 12.29 104.3 28.6
NF99 11.87 50.0 31.3
NF 7.43 29.6 NF200 NF90 K-SR2 K-TFCS NF99HF
58.0
NF200 7.39 59.5 23.2
NF270 5.35 108.8 20.5
K-SR3 1.78 49.0 32.8
K-SR2 0.76 127.0 15.7
Table 1. Surface roughness of membranes at a scan size of 5 x
5 µm2 compared with permeate flow and conductivity rejection Fig.6. AFM images for ten membranes characterized
CONCLUSIONS REFERENCES
• The rejection of divalent ions is good in most of membranes tested and that is • Hassan A.M, et al (1998) A new approach to membrane and thermal seawater
very important for the prevention of scaling. desalination processes using nanofiltration membranes (Part 1). Desalination 118, 35-
51
• Roughness have been measured with AFM. Membranes with a higher roughness • Hassan A.M, et al (2000) A demonstration plant based on the new NF-SWRO
present a high conductivity rejection and vice versa. Colloidal fouling in NF process, Desalination 131, 157-171
membranes is strongly correlated with membrane surface roughness. Membranes • Schäfer A.I, Fane A.G, Waite T.D (2006) Nanofiltration principles and applications.
with high surface roughness are more prone to fouling. Elsevier publications
• Spiegler K.S., Kedem O.; Thermodynamics of hyperfiltration (reverse osmosis):
• The most suitable NF membranes as pretreatment for scaling prevention are: criteria for efficient membranes (1966) Desalination 1, 311-326
NF270 (Dow Chemical), K-SR2 (Koch) and NF99HF (Alfa Laval).
This study was financially supported by Sociedad General de Aguas de Barcelona (AGBAR) within the scope of CENIT project “Desarrollos tecnológicos hacia un ciclo del agua
urbano auto-sostenible (SOSTAQUA)”.