1. FSU Editorial: "Key Market Indicators Indicate Caution" by Frank Corbe... http://www.financialsense.com/fsu/editorials/2007/1020b.html
1 of 4 10/24/2007 3:24 PM
Home l Broadcast l WrapUp l Storm Watch l Editorial Archives l About Us l Contact Us
KEY MARKET INDICATORS INDICATE CAUTION
by Frank Corbett
October 20, 2007
My firm our clients to the most conservative allocations available on July 13. Some background on the
major factors is in order. This decision was not taken lightly. Stock markets were near all-time highs
and have since reached new highs. It is difficult to stand aside from the crowd. It is our desire to keep
the process focused on measurable, quantitative variables and minimize opinion, innuendo, and
emotion.
A number of factors were foremost in the decision. Liquidity, technical analysis, and sentiment
indicators are the core of the analytical process as they have a quantifiable track record. A preferred
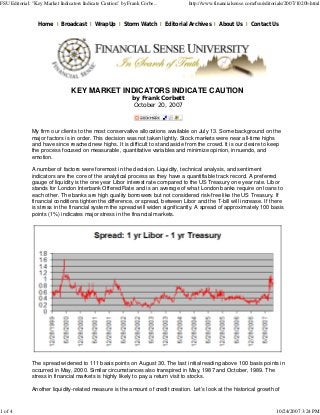
gauge of liquidity is the one year Libor interest rate compared to the US Treasury one year rate. Libor
stands for London Interbank Offered Rate and is an average of what London banks require on loans to
each other. The banks are high quality borrowers but not considered risk-free like the US Treasury. If
financial conditions tighten the difference, or spread, between Libor and the T-bill will increase. If there
is stress in the financial system the spread will widen significantly. A spread of approximately 100 basis
points (1%) indicates major stress in the financial markets.
The spread widened to 111 basis points on August 30. The last initial reading above 100 basis points in
occurred in May, 2000. Similar circumstances also transpired in May, 1987 and October, 1989. The
stress in financial markets is highly likely to pay a return visit to stocks.
Another liquidity-related measure is the amount of credit creation. Let’s look at the historical growth of
2. FSU Editorial: "Key Market Indicators Indicate Caution" by Frank Corbe... http://www.financialsense.com/fsu/editorials/2007/1020b.html
2 of 4 10/24/2007 3:24 PM
debt/liquidity to see if it tracks the economy or stock market. One series provided by the Federal
Reserve is particularly interesting. It is the seasonally adjusted flows of total credit market debt (TCMD)
instruments. It is essentially the additional debt added each quarter, as opposed to the cumulative total.
Flows are the quarterly change. A graph of smoothed data is striking.
Smoothing is accomplished by taking a year over year change of the quarterly growth of the trailing four
quarter moving average. It establishes a trend of otherwise volatile quarterly variation. Federal Reserve
publication of the data lags the end of the quarter by about three months. The latest, June of 2007,
were released in September. It is therefore necessary to project forward the path of credit growth. For
example, the 1987 Q3 figures were not available until December of 1987. Rapid declines from peaks
provided advance warning in 1987 and 2000, provided action was taken early, as the zero line was
crossed. Moves below the -10% Danger Zone coincided with the last three stock bear markets.
It is necessary to project forward for another reason. Markets tend to anticipate and may be well into a
decline when the full extent of the problem surfaces. It is likely the -10% may well have already been
crossed. Everyone knows the creation of new mortgage debt is in decline. High yield and bank loan
debt is not growing. Both have been impacted by the decline in mergers and acquisitions, leveraged
buyouts, and private equity deals. The commercial paper market has taken a major hit and the
asset-backed variety has all but shut down. To cite several examples:
“Year-to-date total US ABS issuance of $470bn (tallied by JPMorgan) is running 30% behind
comparable 2006. At $211bn, y-t-d Home Equity ABS sales are 52% off last year’s pace.” (Source:
Prudent Bear)
"Sales of collateralized debt obligations slumped to the lowest in 21 months during September,
according to Morgan Stanley. Banks sold 20 CDOs totaling $16 billion worldwide last month..." (Source:
Bloomberg)
A Barron’s article on September 24 noted “The picture isn't much better in the world of global
underwriting, which includes selling everything from debt and equities to asset-backed securities. In the
third quarter of '06 $1.9 trillion of securities were underwritten; with a week to go in this year's third
quarter, the underwriting total is about half that, $1.07 trillion, and showing little sign of reviving.”
3. FSU Editorial: "Key Market Indicators Indicate Caution" by Frank Corbe... http://www.financialsense.com/fsu/editorials/2007/1020b.html
3 of 4 10/24/2007 3:24 PM
To summarize, two market-based, quantifiable measures are indicating caution. Prior signals have
been infrequent and accurate--the sort of indicators it makes sense to rely on. While it’s possible both
could be wrong now, is it worth taking a chance on? A major financial event likely lies ahead.
In addition to liquidity, technical analysis plays a major role in our evaluation. A myriad of indicators are
reviewed but a simple one is truly representative of the big picture currently. The Standard and Poors
Index of 500 stocks, as captured by the SPY ETF chart, has reached a critical juncture from a
long-term perspective.
A double top is potentially forming in spite of a marginal new high. A rally is often halted at a prior peak.
It has taken seven years for those who entered the general market in 2000 to break even. Many will be
tempted to sell. Additionally, the market has roughly doubled from the 2002-2003 lows, a level often
targeted for profit-taking. Looking at the price action year to date one sees the monthly price range
increasing. Sideways, volatile price patterns are typical of major tops. Price action in 2000 presented a
similar configuration. An observation on trading volume is in order. Volume across all exchanges rose
to record levels in the summer. The 21-day average volume of shares traded on NYSE and NASDAQ
combined as of August 16 was 18% higher than the previous high occurring near the July, 2002
bottom. Buyers and sellers were battling on a volume scale never seen before. It will eventually cause
a meaningful move. It’s like an elephant jumping into a bathtub--the water has to go somewhere.
Many market observers are taking a positive stance on stocks based on the fundamentals. Corporate
earnings have risen ten percent or more for twenty consecutive quarters. It doesn’t get any better than
that. Now, the Federal Reserve has once again come to the rescue with rate cuts, certain to get the
credit creation machines rolling again. Time will tell.
On the other hand one fundamental fact is very difficult to overlook. The difficulties in the subprime
mortgage market are not over. CNN Money reported “More than two million subprime adjustable rate
mortgages (ARMs) are poised to reset at much higher rates in coming months, worsening an already
suffering housing market. Borrowers who took out hybrid ARMs in 2004 and 2005 to secure low
"teaser" rates for the first two or three years of the loan may see their monthly mortgage payments
climb by 35 percent or more.” The table below shows the real challenge is yet to come.
Robert Lacoursiere,
an analyst with
Bank of America,
assembled the data