1. BIODIESEL FROM WASTE SALMON OIL
B.‐S. Chiou, H. M. El‐Mashad, R. J. Avena‐Bustillos, R. O. Dunn, P. J. Bechtel,
T. H. McHugh, S. H. Imam, G. M. Glenn, W. J. Orts, R. Zhang
ABSTRACT. Salmon oils separated from salmon processing waste and hydrolysate and their derived methyl esters were
analyzed and compared with corn oil and its methyl ester. These materials were characterized for their fatty acid profiles,
viscosity, volatility, thermal properties, low temperature properties, oxidative stability, and heating value. The salmon oil
methyl esters contained 26.64% saturated fatty acid methyl esters compared to 13.68% for corn oil methyl ester. Salmon oil
methyl esters also contained relatively high concentrations of eicosapentaenoic acid (C20:5) and docosahexaenoic (C22:6)
acid methyl esters. Despite these differences in fatty acid composition, salmon and corn oil methyl esters had comparable
physical properties. In addition, the methyl esters produced from salmon oils extracted from fish processing by‐products and
hydrolysate showed little difference in their physical properties.
Keywords. Biodiesel, Fish by‐product, Salmon oil.
P
lant and vegetable oils have been used as alternative most research in Europe has focused on rapeseed oil. The rea‐
fuels for a number of years. They are readily avail‐ son is that these are the predominant oil seed plants grown in
able and renewable materials. However, oils have a those areas. Less expensive feedstocks, such as spent frying
number of disadvantages when used directly as a oil and grease, have also been considered as alternative
fuel source (Ma and Hanna, 1999; Srivastava and Prasad, sources for biodiesel production (Muniyappa et al., 1996; Ca‐
2000; Demirbas 2003; Meher et al., 2006). First, they have nakci and Van Gerpen, 2001; Lee et al., 2002; Zhang et al.,
high viscosities that are at least ten times higher than diesel 2003; Dmytryshyn et al., 2004; Tashtoush et al., 2004; Enci‐
fuel. High viscosity leads to poor fuel atomization during the nar et al., 2005).
injection process. Moreover, oils can polymerize and have Most research on biodiesel has focused on using plant‐
low volatility, resulting in deposit formation in engines as based oils as feedstocks. There has been much less research
well as incomplete combustion. on converting animal‐based oils into biodiesel (Muniyappa
One way to overcome problems of oils as diesel fuels is by et al. 1996; Canakci and Van Gerpen, 2001; Lee et al., 2002;
conversion of oils into biodiesel (i.e., fatty acid alkyl esters). Kato et al., 2004; Tashtoush et al., 2004). One potential
Various plant and vegetable oils have been converted to bio‐ source of oil is fish oil from the Alaskan fishing industry. It
diesel, including soybean, rapeseed, canola, sunflower, and has been estimated that over a million tons of fish by‐
palm oils (Ma and Hanna, 1999; Srivastava and Prasad, 2000; products are generated annually from the fishing industry in
Fukuda et al., 2001; Meher et al., 2006). In the U.S., most re‐ Alaska (Crapo and Bechtel, 2003). Some of these by‐
search into biodiesel has focused on soybean oil, whereas products are converted into fish meal and oil, but approxi‐
mately 60% are not utilized (Crapo and Bechtel, 2003). The
major fish by‐products include fish heads, viscera, and some
frames, with much of the oil stored in the head.
Submitted for review in December 2006 as manuscript number PM
6781; approved for publication by the Power & Machinery Division of Fish by‐products can also be converted into hydrolysate
ASABE in April 2008. Presented at the 2006 ASABE Annual Meeting as through hydrolysis. Hydrolysis involves multiple enzyme
Paper No. 066157. and heat treatments to break down proteins into smaller pep‐
The authors are Bor‐Sen Chiou, Engineer, USDA‐ARS Western tides. The final hydrolysate product is usually stabilized by
Regional Research Center, Albany, California; Hamed M. El‐Mashad,
Chemist, Department of Biological and Agricultural Engineering,
acidification and can be used as fertilizer or as feed ingredi‐
University of California, Davis, California; Roberto J. Avena‐Bustillos, ents. Hydrolysates of fish by‐products contain a significant
Engineer, USDA‐ARS Western Regional Research Center, Albany, amount of oil, which can be extracted and converted into bio‐
California; Robert O. Dunn, Engineer, USDA‐ARS National Center for diesel.
Agricultural Utilization Research, Peoria, Illinois; Peter J. Bechtel, The main objective of this study was to evaluate thermal,
Chemist, USDA‐ARS Subarctic Agricultural Research Unit, University of
Alaska, Fairbanks, Alaska; Tara H. McHugh, Engineer, Syed H. Imam, rheological, thermal stability, combustion, and cold flow
Chemist, Greg M. Glenn, Chemist, and William Orts, Engineer, properties of two types of salmon oil and their derived methyl
USDA‐ARS Western Regional Research Center, Albany, California; and esters. One oil sample, termed non‐acidified oil, was ex‐
Ruihong Zhang, ASABE Member, Professor, Department of Biological tracted from fresh salmon by‐product, and the other oil sam‐
and Agricultural Engineering, University of California, Davis, California.
Corresponding author: Bor‐Sen Chiou, USDA‐ARS Western Regional
ple, termed acidified oil, was extracted from the hydrolysate
Research Center, 800 Buchanan St., Albany, CA 94710; phone: made from the salmon by‐product. Corn oil and its derived
510‐559‐5628; fax: 510‐559‐5675; e‐mail: bschiou@pw.usda.gov. methyl ester were also evaluated as a comparison.
Transactions of the ASABE
Vol. 51(3): 797-802 2008 American Society of Agricultural and Biological Engineers ISSN 0001-2351 797
2. MATERIAL AND METHODS methyl ester sample. The sample was placed on a Peltier
METHYL ESTER PRODUCTION plate, and a 60 mm stainless steel parallel plate was lowered
Methyl esters were produced from two kinds of salmon oil onto it. Before the start of each run, the sample was main‐
and commercial corn oil. A more detailed description of tained at the experiment temperature for 10 min to allow for
methyl ester production from salmon oil can be found in the equilibration. The temperatures ranged from 5°C to 40°C.
study by El‐Mashad et al. (2008). Both salmon oils were ob‐ The viscosity was subsequently measured for shear rates
tained from Alaska pink salmon (Oncorhynchus gorbuscha) ranging from 0.01 to 1000 1/sec.
by‐products. One salmon oil (acidified) sample was sepa‐
rated from hydrolysate by using a high‐speed centrifuge at THERMOGRAVIMETRIC ANALYSIS
7000 rpm for 20 min at relative centrifugal force of 7970 g. A model 2950 thermogravimetric analyzer (TGA) (TA In‐
The other oil (non‐acidified) sample was extracted from fresh struments, New Castle, Del.) was used to measure the ther‐
salmon by‐products by centrifugation. Salmon oil methyl es‐ mal stability of the samples. Each sample of 10 mg was
ter was produced using a two‐step process. In the first step, heated at 10°C min-1 up to a temperature of 800°C. The sam‐
salmon oil was esterified with methanol using a molar ratio ple was maintained in a nitrogen environment with a nitrogen
of methanol to oil of 3.1:1 in the presence of 1% (w/w) gas flow rate of 40 cm3 min-1.
H2SO4. Then the oil was further transesterified using a 6.2:1
methanol/oil ratio and 1% (w/w) KOH. The reaction times DIFFERENTIAL SCANNING CALORIMETRY
were 60 and 30 min for the first and second steps, respective‐ Crystallization onset temperature was determined by us‐
ly. Both steps were performed at 52°C ±2°C and a mixing ing a model Q1000 differential scanning calorimeter (DSC)
rate of 600 rpm. Methyl ester produced from hydrolysate oil (TA Instruments, New Castle, Del.). Sample masses were 1.7
was termed acidified, whereas methyl ester produced from ±0.22 mg, and hermetically sealed aluminum pans were
fresh salmon by‐product oil was termed non‐acidified. Meth‐ used for reference and sample. The thermal analytical pro‐
yl ester production from corn oil was carried out in a one‐step gram was as follows: equilibrate at 40°C, cool at 5°C min-1
alkaline‐catalyzed transesterification using methanol (20% to -40°C, and hold isothermally at -40°C for 1 min. Three
w/w) and KOH (1% w/w). The reaction was performed at replicate DSC scans were performed and averaged for each
52°C ±2°C and a mixing intensity of 600 rpm for 30 min. methyl ester sample.
A model 2910 DSC (TA Instruments, New Castle, Del.)
FATTY ACID ANALYSIS was used to measure the thermal properties of the samples.
Fatty acid contents of non‐acidified and acidified salmon The sample amount used was 2.5 ±0.3 mg, and each sample
oil, non‐acidified salmon oil methyl ester, and corn oil meth‐ was heated from -85°C to 100°C at a rate of 10°C min-1. The
yl ester were measured in duplicate using gas chromatogra‐ sample chamber was purged with nitrogen gas at a flow rate
phy (GC), as described by Oliveira and Bechtel (2006). of 75 cm3 min-1.
About 15 mg of oil or methyl ester was dissolved in 1.9 mL
of isooctane (Sigma grade 99%, St. Louis, Mo.). A 100 mL HEATING VALUE
solution of 10 mg mL-1 methyl tricosanoate (Nu‐Chek Prep, The heating values of corn and salmon oil methyl esters
Inc., Elysian, Minn.) in iso‐octane was added, followed by were determined in duplicate using a model 1241 adiabatic
200 mL of 2N KOH in methanol. The contents were then bomb calorimeter (Parr Instrument, Moline, Ill.).
mixed for 60 s using a vortex mixer. The samples were centri‐
fuged for 3 min at 3400 rpm and the lower layer was dis‐ LOW TEMPERATURE PROPERTIES
carded. This procedure was repeated twice using 0.5 mL of Manual analysis of cloud point (CP) and pour point (PP)
a saturated solution of ammonium acetate in water, followed was conducted in accordance with ASTM test methods
by 0.5 mL of deionized water. Methyl esters in isooctane D2500 and D97, respectively (ASTM, 2003). The apparatus
were dried by adding 250 mg of anhydrous sodium sulfate. was supplied by Koehler (Bohemia, N.Y.). For both CP and
The samples were then centrifuged at 3400 rpm for 20 min. PP analyses, samples were filtered to remove moisture, and
The methyl esters were analyzed using a GC (Hewlett approximately 55 mL of sample was used. For CP analyses,
Packard 5890, Palo Alto, Cal.) equipped with a flame ioniza‐ samples were examined visually in 1°C intervals, and the
tion detector and an auto injector. A 1.0 mL sample was in‐ temperature where haziness was observed near the bottom of
jected and subjected to a 1:100 split ratio. A 100 m capillary the sample was recorded as the CP. For PP analyses, samples
column (Supelco 2560) with a 0.25 mm inside diameter and were pulled in 3°C intervals and tipped until movement of the
a film thickness of 0.20 microns was used. Hydrogen was liquid was observed. The lowest temperature where move‐
used as a carrier gas with a linear flow rate of 27 cm s-1 and ment could be detected was recorded as the PP.
a head pressure of 33 psi. Injector and detector temperatures Automatic analysis of CP and PP were conducted in accor‐
were set at 220°C. The column temperature was held at 75°C dance with ASTM methods D5773 and D5949, respectively
for 10 min, increased to 175°C at 20°C min-1 and held for 29 (ASTM, 2003). A PSA‐70S automatic analyzer (Phase
min, and then increased to a final temperature of 225°C at Technologies, Richmond, BC, Canada) was used to measure
5°C min-1 and held for 12 min. The detector signal was inte‐ both CP and PP. Sample volumes were 150 mL and cooling
grated and quantified using Chrom Perfect Spirit version 5.5 rates were 1.5°C min-1 for each measurement. For both CP
software (Justice Laboratory Software, Denville, N.J.). and PP measurements, samples were analyzed in 1 C inter‐
vals.
RHEOLOGY Cold filter plugging point (CFPP) was analyzed in accor‐
A model AR2000 rheometer (TA Instruments, New dance with ASTM method D6371 (ASTM, 2003). The appa‐
Castle, Del.) was used to measure the viscosity of each oil or ratus was supplied by Koehler, and methods for preparing,
798 TRANSACTIONS OF THE ASABE
3. cooling, and evaluating the sample were similar to those for Table 1. Fatty acid profiles of oils and methyl
measurement of CP by ASTM method D2500. At 1°C inter‐ esters (g fatty acid/100 g total fatty acid).
vals, a 200 mm water (0.0194 atm) vacuum was applied to Non‐
Non‐ Acidified Corn
draw sample from the test jar into a pipette. The lowest tem‐ Acidified Acidified Salmon Oil Oil
perature where a 20 mL sample could be drawn into the pi‐ Salmon Salmon Methyl Methyl
pette within 60 s was recorded as the CFPP. For all low Oil Oil Ester Ester
temperature properties, three replicate measurements were C12:0 0.15 0.14 0.14 0.00
averaged for each sample. C13:0 0.07 0.07 0.07 0.00
C14:0 7.04 6.85 6.81 0.05
OIL STABILITY, ACID VALUE, AND SPECIFIC GRAVITY C14:1 cis 0.09 0.10 0.10 0.00
Oil stability index (OSI) at 60°C ±0.2°C was measured C15:0 0.74 0.88 0.88 0.00
in accordance with AOCS method Cd 12b‐92 (AOCS, 1999). C16:0 14.95 14.83 14.91 11.54
Apparatus was from Omnion Inc. (Rockland, Mass.) under li‐ C16:1 trans 0.31 0.33 0.31 0.00
cense from Archer Daniels Midland (Decatur, Ill.). Acid val‐ C16:1 cis 6.59 6.13 6.12 0.12
ue (AV) was measured in accordance with AOCS method Ca C17:0 0.60 0.68 0.68 0.07
5a‐40 (AOCS, 1999). Specific gravity (SG) at 15.6°C was C18:0 3.71 3.12 3.15 2.02
measured in accordance with AOCS method Cc 10c‐95 C18:1 trans 9 0.13 0.20 0.18 0.00
(AOCS, 1999). C18:1 cis 9&10 19.13 15.53 15.56 28.32
C18:1 cis 11 2.69 2.49 2.51 0.65
C18:2 2.10 2.14 2.14 55.78
C18:3 n6 0.11 0.15 0.12 0.00
RESULTS AND DISCUSSION C18:3 7.86 11.52 11.47 1.39
FATTY ACID PROFILES C18:2 C9C11 0.00 0.00 0.00 0.02
The methyl esters derived from salmon oil and corn oil C18:2 C11C13 2.34 2.74 2.71 0.00
had very different fatty acid profiles, with salmon oil methyl C18:2 all trans 0.00 0.00 0.00 0.01
esters containing more saturated species. The fatty acid pro‐ C20:4 2.79 3.33 3.34 0.00
files of the methyl ester samples are shown in table 1. The C22:2 n6 0.11 0.19 0.17 0.00
corn oil methyl esters consisted predominantly of palmitic C20:5 11.52 11.13 11.13 0.01
acid (C16:0), oleic acid (C18:1), and linoleic acid (C18:2) C22:3 n3 0.22 0.43 0.43 0.00
methyl esters, consistent with the composition of corn oil in C22:4 n6 0.12 0.11 0.11 0.00
other studies (Allen et al., 1999; Ma et al., 1999). In contrast, C22:5 n6 0.25 0.27 0.26 0.00
the salmon oil methyl esters contained a wider range of fatty C22:5 3.42 3.02 3.02 0.00
acids, including myristic acid (C14:0), palmitic acid (C16:0), C22:6 12.96 13.63 13.68 0.01
palmitoleic acid (C16:1), oleic acid (C18:1), linolenic acid
(C18:3), eicosapentaenoic acid (C20:5), and docosahexaeno‐ over the same temperature range. In addition, methyl esters
ic acid (C22:6) methyl esters. Corn oil and salmon oil methyl produced from both acidified and non‐acidified salmon oils
esters contained 13.68% (w/w) and 26.64% (w/w) saturated had comparable viscosity values to corn oil methyl ester. The
species, respectively. kinematic viscosities at 40°C of methyl esters from corn, aci‐
dified, and non‐acidified salmon oils were 4.52, 4.97, and
VISCOSITY 4.52 mm2 s-1, respectively.
All samples showed Newtonian behavior over the experi‐ The dependence of viscosity on temperature could be de‐
mental temperature range. This was consistent with results scribed by the Andrade equation (Andrade, 1951):
from a previous study (Srivastava and Prasad, 2001), where ln(m) = A + B/T (1)
viscosities of several methyl esters were determined to be
Newtonian above 5°C. Table 2 shows the viscosity of oils and where m is viscosity (Pas), T is temperature (K), and A and B
methyl esters at different temperatures. As can be seen, each are constants. The values of A, B, and the coefficient of deter‐
methyl ester had a viscosity value approximately one order mination (R2) are shown in table 3.
of magnitude lower than its corresponding oil. In addition,
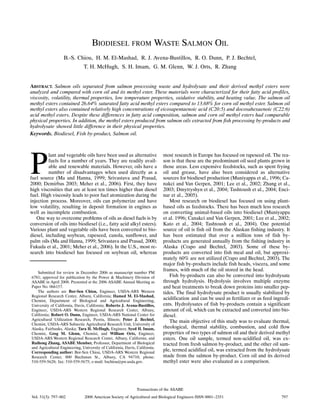
the viscosities of methyl esters exhibited less dependence on VOLATILITY
temperature than those of oils. The viscosity of each methyl Both salmon oil methyl esters had comparable TGA
ester increased by approximately 64% to 77% when tempera‐ curves to corn oil methyl ester. In addition, the methyl ester
ture decreased from 40°C to 15°C. In comparison, the vis‐ samples were more volatile than the oil samples. Figure 1
cosity of each oil increased by approximately 155% to 159% shows the weight percent of methyl ester and oil samples as
Table 2. Viscosity of oils and methyl esters.
Viscosity (Pas)
Type of Oil or Methyl Ester 5°C 10°C 15°C 25°C 40°C
Corn oil ‐‐ ‐‐ 0.077 ±0.003 0.051 ±0.002 0.030 ±0.000
Acidified salmon oil ‐‐ ‐‐ 0.074 ±0.001 0.049 ±0.001 0.029 ±0.000
Non‐acidified salmon oil ‐‐ ‐‐ 0.075 ±0.000 0.052 ±0.004 0.029 ±0.000
Corn oil methyl ester 0.0097 ±0.0003 ‐‐ 0.0069 ±0.0002 0.0053 ±0.0003 0.0039 ±0.0001
Acidified salmon oil methyl ester ‐‐ 0.0094 ±0.0003 0.0072 ±0.0003 0.0057 ±0.0001 0.0044 ±0.0001
Non‐acidified salmon oil methyl ester 0.0099 ±0.0001 ‐‐ 0.0070 ±0.0002 0.0052 ±0.0001 0.0040 ±0.0001
Vol. 51(3): 797-802 799
4. Table 3. Parameters of Andrade equation. Table 4. Low temperature properties of methyl esters.
Type of Oil or Methyl Ester A B R2 Methyl Esters
Corn oil ‐14.17 3340.00 0.999 Acidified Non
Acidified salmon oil ‐14.43 3402.10 0.999 Corn Salmon Acidified
Non‐acidified salmon oil ‐14.52 3439.50 0.999 Parameter Oil Oil Salmon Oil
Corn oil methyl ester ‐12.71 2234.90 0.995 Crystallization onset (°C)[a] ‐8.78 ±0.06 ‐6.70 ±0.17 ‐8.10 ±0.10
Acidified salmon oil methyl ester ‐12.36 2156.10 0.982 Cloud point (°C)
Non‐acidified salmon oil methyl ester ‐12.86 2280.50 0.992 Automatic ‐‐ ‐‐ ‐2.0 ±0.1
Manual ‐‐ ‐‐ ‐2.7 ±0.6
a function of temperature. All three methyl esters had maxi‐ Pour point (°C)
mum rate of weight loss at 214°C to 217°C. In addition, more Automatic ‐4.0 ±0.0 ‐2.7 ±0.6 ‐3.0 ±0.0
than 90% of each methyl ester sample had volatized at Manual ‐4.0 ±1.7 ‐3.0 ±0.0 ‐5.0 ±1.7
Cold filter plugging point (°C) ‐7.0 ±0.0 ‐6.3 ±0.6 ‐7.7 ±0.6
250°C. In contrast, the oil samples had maximum rate of
[a] From DSC cooling scans.
weight loss at 403°C to 405°C and did not reach 90% weight
loss until approximately 440°C. As a comparison, the igni‐
tion temperature of diesel fuel ranged from 232°C to 317°C. scans (Dunn, 1999). Nevertheless, onset temperatures were
Sathivel (2005) reported that red salmon and pink salmon oils examined by heating scans as a comparison. The DSC curves
had decomposition temperatures of 533°C and 668°C, re‐ for these scans are shown in figure 2. Acidified salmon, non‐
spectively. The author attributed the temperature difference acidified salmon, and corn oil methyl esters had crystalliza‐
to the presence of impurities such as phospholipids, com‐ tion onset temperatures of 3.1°C, 3.1°C, and 1.7°C,
plexed metals and minerals, and peroxides and their break‐ respectively. These values were higher than those from cool‐
down products. ing scans, but they showed the same trend of salmon oil meth‐
yl esters having higher onset temperatures. These results
LOW TEMPERATURE PROPERTIES were consistent with results from fatty acid analysis: salmon
The salmon oil methyl esters had slightly higher crystal‐ samples had higher concentrations of saturated fatty acid
lization onset temperatures than corn oil methyl ester, as methyl esters, and saturated species had higher melting
shown in table 4. The acidified and non‐acidified salmon oil points than unsaturated ones. As shown in figure 2, the DSC
methyl esters had crystallization onset temperatures of curves for salmon oil methyl esters had much different pro‐
-6.7°C and -8.1°C, respectively. In comparison, the corn oil files at lower temperatures than that for corn oil methyl ester.
methyl ester had a crystallization onset temperature of These differences below 0°C are likely due to differences in
-8.8°C. These onset temperature values were determined by unsaturated fatty acid methyl ester contents for each sample.
performing DSC cooling scans because cooling scans had Corn oil methyl ester contained mostly oleic (C18:1) and li-
been shown to correlate better with low temperature proper‐ noleic (C18:2) acid methyl esters as unsaturated species,
ties, such as pour and cold filter plugging points, than heating whereas salmon oil methyl esters contained mostly oleic
120
Corn oil
CME
100
Salmon oil
SaME
Non-acidified salmon oil
80 NSaME
% Weight
60
40
20
0
0 100 200 300 400 500 600 700 800
Temperature (5C)
Figure 1. Thermogravimetric analysis (TGA) curves showing weight percent as a function of temperature for acidified salmon, non‐acidified salmon,
and corn oils as well as their corresponding methyl esters (CME = corn oil methyl ester, SaME = acidified salmon oil methyl ester, and NSaME = non‐
acidified salmon oil methyl ester).
800 TRANSACTIONS OF THE ASABE
5. 20 acidified salmon oil methyl ester had twice and three times
the OSI values of non‐acidified salmon oil methyl ester and
corn oil methyl ester, respectively. The greater stability of
15
salmon samples might be due to their lower total concentra‐
tion of unsaturated fatty acid methyl esters. Unsaturated spe‐
CME
cies generally oxidized faster than saturated species. The
Heat Flow (MW)
10
SaME position of double bonds also had an effect on oxidation rate.
NSaME For instance, bis‐allylic positions were more susceptible than
5 Corn oil allylic ones to oxidation (Knothe and Dunn, 2003). As shown
Salmon oil in table 1, corn oil methyl ester had higher concentrations of
Non-acidified salmon oil fatty acid methyl esters containing allylic positions than
0 salmon oil methyl esters. However, the salmon samples had
higher percentages of fatty acid methyl esters containing
larger numbers of bis‐allylic positions, such as linolenic
-5 (C18:3), eicosatetraenoic, (C20:4), eicosapentaenoic
-100 -50 0 50 100
(C20:5), and docosahexaenoic (C22:6) acids. Nevertheless,
Temperature (5C)
OSI values for salmon samples were comparable to those for
Figure 2. Differential scanning calorimetry (DSC) heating curves show‐ commercial soybean oil methyl esters (Dunn, 2005).
ing heat flow as a function of temperature for acidified salmon, non‐ The heating values of salmon oil and corn oil methyl esters
acidified salmon, and corn oils as well as their corresponding methyl (table 5) were comparable to those of other methyl esters
esters. (CME = corn oil methyl ester, SaME = acidified salmon oil methyl
ester, and NSaME = non‐acidified salmon oil methyl ester).
(Lang et al., 2001; Encinar et al., 2005). Salmon oil methyl
ester had a heating value of 38.8 MJ kg-1, which was 13.8%
lower than the 45 MJ kg-1 value for diesel fuel.
(C18:1), linolenic (C18:3), eicosapentaenoic (C20:5), and
The acid values for the methyl ester samples ranged from
docosahexaenoic (C22:6) acid methyl esters as unsaturated
species. 0.149 to 0.211 mg KOH g-1, with acidified salmon oil methyl
ester having the highest value (table 5). The acid values for
All methyl ester samples had comparable pour point and
the salmon oil methyl esters were comparable to those from
cold filter plugging point (CFPP) values, as shown in table 4.
For pour point measurements, both manual and automatic other plant oil methyl esters (Lang et al., 2001).
All three methyl ester samples had comparable specific
methods resulted in similar values, which ranged from -3°C to
densities at 15.6°C (table 5). These density values were com‐
-5°C. These values were comparable to those determined for
parable to those for soybean and rapeseed oil methyl esters
soybean oil methyl esters (Srivastava and Prasad, 2000; Soriano
(Fukuda et al., 2001).
et al., 2006) and sunflower oil methyl esters (Lang et al., 2001;
Soriano et al., 2006), but higher than those determined for ra‐
peseed oil methyl esters (Lang et al., 2001; Soriano et al., 2006).
In addition, each methyl ester sample had a CFPP value approx‐ CONCLUSIONS
imately 3°C to 4°C lower than their corresponding pour point Salmon oil methyl esters had very different fatty acid pro‐
value. It was not possible to determine cloud points for acidified files compared to corn oil methyl ester. The salmon samples
salmon and corn oil methyl esters because they were opaque. contained 26.64% saturated methyl esters compared to
However, cloud point values of -2°C (automatic method) and 13.68% for the corn sample. In addition, the salmon oil meth‐
-2.7°C (manual method) could be determined for non‐acidified yl esters contained relatively large amounts of eicosapentae‐
salmon oil methyl ester. These values were comparable to those noic acid (C20:5) and docosahexaenoic (C22:6) acid methyl
determined for soybean oil methyl esters (Srivastava and Pra‐ esters. Despite these differences, salmon oil methyl esters
sad, 2000; Fukuda et al., 2001; Soriano et al., 2006), rapeseed had comparable viscosity, volatility, low temperature proper‐
oil methyl esters (Lang et al., 2001; Soriano et al., 2006), and ties, oxidative stability, heating value, acid value, and specif‐
sunflower oil methyl esters (Srivastava and Prasad, 2000; Fuku‐ ic gravity to corn oil methyl esters.
da et al., 2001; Lang et al., 2001; Soriano et al., 2006), but much
lower than those determined for palm oil methyl esters (Srivas‐ ACKNOWLEDGEMENTS
tava and Prasad, 2000; Fukuda et al., 2001; Soriano et al., 2006) We thank Allison Dedrick and Rajnesh Narayan for per‐
and tallow oil methyl esters (Srivastava and Prasad, 2000; Fuku‐ forming some of the rheology, DSC, and TGA experiments.
da et al., 2001). We also thank Professor James Fadel and Scott Taylor of Ani‐
mal Science Department at UC Davis for help in the analysis
OIL STABILITY INDEX, HEATING VALUE, ACID VALUE, AND of fatty acids. Many thanks also to Professor Bryan Jenkins
SPECIFIC GRAVITY and Rizaldo Aldas of the Department of Agricultural and Bi‐
Both salmon oil methyl esters had higher OSI values than ological Engineering at UC Davis for help in measuring the
corn oil methyl ester, as shown in table 5. In particular, the heating value of biodiesel samples.
Table 5. Oil stability index (OSI), heating value, acid value, and specific gravity of methyl esters.
OSI at 60°C Heating Value Acid Value Specific Gravity
Methyl Ester (h) (MJ kg‐1) (mg KOH g‐1 oil) at 15.6°C
Corn oil 3.65 ±0.18 38.7 ±0.2 0.165 ±0.011 0.893
Acidified salmon oil 12.15 ±0.25 0.211 ±0.012 0.885
Non‐acidified salmon oil 6.12 ±0.31 38.8 ±0.3 0.149 ±0.027 0.891
Vol. 51(3): 797-802 801
6. REFERENCES Kato, S., K. Kunisawa, T. Kojima, and S. Murakami. 2004.
Evaluation of ozone treated fish waste oil as a fuel for
Allen, C. A. W., K. C. Watts, R. G. Ackman, and M. J. Pegg. 1999.
transportation. J. Chem. Eng. Japan 37(7): 863‐870.
Predicting the viscosity of biodiesel fuels from their fatty acid
Knothe, G., and R. O. Dunn. 2003. Dependence of oil stability
ester composition. Fuel 78(11): 1319‐1326.
index of fatty compounds on their structure and concentration
Andrade, E. N. da. C. 1951. Viscosity and Plasticity. New York,
and presence of metals. J. American Oil Chem. Soc. 80(10):
N.Y.: Chemical Publishing Co.
1021‐1026.
AOCS. 1999. Official Methods and Recommended Practices of the
Lang, X., A. K. Dalai, N. N. Nakhshi, M. J. Reaney, and P. B. Hertz.
AOCS. 5th ed. D. Firestone, ed. Champaign, Ill.: AOCS Press.
2001. Preparation and characterization of bio‐diesels from
ASTM. 2003. Annual Book of ASTM Standards. Vol. 05.01. West
various bio‐oils. Bioresource Tech. 80(1): 53‐62.
Conshohocken, Pa.: ASTM International.
Lee, K‐T, T. A. Foglia, and K‐S Chang. 2002. Production of alkyl
Canakci, M., and J. Van Gerpen. 2001. Biodiesel production from
ester as biodiesel from fractionated lard and restaurant grease. J.
oils and fats with high free fatty acids. Trans. ASAE 44(6):
American Oil Chem. Soc. 79(2): 191‐195.
1429‐1436.
Ma, F., and M. A. Hanna. 1999. Biodiesel production: A review.
Crapo, C., and P. J. Bechtel. 2003. Utilization of Alaska's seafood
Bioresource Tech. 70(1): 1‐15.
processing byproducts. In Advances in Seafood Byproducts:
Meher, L. C., D. Vidya Sagar, and S. N. Naik. 2006. Technical
2002 Conference Proc., 105‐119. P. J. Bechtel, ed. Anchorage,
aspects of biodiesel production by transesterification: A review.
Alaska: Alaska Sea Grant College Program.
Renewable and Sustainable Energy Rev. 10(3): 248‐268.
Demirbas, A. 2003. Biodiesel fuels from vegetable oils via catalytic
Muniyappa, P. R., S. C. Brammer, and H. Noureddini. 1996.
and non‐catalytic supercritical alcohol transesterifications and
Improved conversion of plant oils and animal fats into biodiesel
other methods: A survey. Energy Cons. Mgmt. 44(13):
and co‐product. Bioresource Tech. 56(1): 19‐24.
2093‐2109.
Oliveira, A. C. M., and P. J. Bechtel. 2006. Lipid analysis of fillets
Dmytryshyn, S. L., A. K. Dalai, S. T. Chaudhari, H. K. Mishra, and
from giant grenadier (Albatrossia pectoralis), arrow tooth
M. J. Reaney. 2004. Synthesis and characterization of vegetable
flounder (Atherestes stomias), Pacific cod (Gadus
oil derived esters: Evaluation for their diesel additive properties.
macrocephalus), and walleye pollock (Theragra
Bioresource Tech. 92(1): 55‐64.
chalcogramma). J. Muscle Foods 17(1): 20‐33.
Dunn, R. O. 1999. Thermal analysis of alternative diesel fuels from
Sathivel, S. 2005. Thermal and flow properties of oils from salmon
vegetable oils. J. American Oil Chem. Soc. 76(1): 109‐115.
heads. JAOCS 82(2): 147‐152.
Dunn, R. O. 2005. Oxidative stability of soybean oil fatty acid
Soriano Jr., N. U., V. P. Migo, and M. Matsumura. 2006. Ozonized
methyl esters oil stability index (OSI). J. American Oil Chem.
vegetable oil as pour point depressant for neat biodiesel. Fuel
Soc. 82(5): 381‐387.
85(1): 25‐31.
El‐Mashad, H. M., R. Zhang, and R. J. Avena‐Bustillos. 2008. A
Srivastava, A., and R. Prasad. 2000. Triglycerides‐based diesel
two‐step process for biodiesel production from salmon oil.
fuels. Renewable Sustainable Energy Rev. 4(2): 111‐133.
Biosystems Eng. 99(2): 220‐227.
Srivastava, A., and R. Prasad. 2001. Rheological behavior of fatty
Encinar, J. M., J. F. Gonzalez, and A. Rodriguez‐Reinares. 2005.
acid methyl esters. Indian J. Chem. Tech. 8(6): 473‐481.
Biodiesel from used frying oil: Variables affecting the yields and
Tashtoush, G. M., M. I. Al‐Widyan, and M. M. Al‐Jarrah. 2004.
characteristics of the biodiesel. Ind. Eng. Chem. Res. 44(15):
Experimental study on evaluation and optimization of
5491‐5499.
conversion of waste animal fat into biodiesel. Energy Cons.
Fukuda, H., A. Kondo, and H. Noda. 2001. Biodiesel fuel
Mgmt. 45(17): 2697‐2711.
production by transesterification of oils. J. Biosci. Bioeng. 92(5):
Zhang, Y., M. A. Dube, D. D. Mclean, and M. Kates. 2003.
405‐416.
Biodiesel production from waste cooking oil: 1. Process design
and technological assessment. Bioresource Tech. 89(1): 1‐16.
802 TRANSACTIONS OF THE ASABE