SlideShare ist ein Scribd-Unternehmen logo
1 von 13
Downloaden Sie, um offline zu lesen
Monthly Indicators
A RESEARCH TOOL PROVIDED BY THE GREATER BOSTON ASSOCIATION OF REALTORS®


September 2012                                                                                                                 Quick Facts
Most housing metrics should follow their usual, autumnal movements – higher
inventory and days on market, fewer sales, lower prices. That applies only to
                                                                                                                                    + 4.3%                           - 3.2%                         + 13.4%
month-to-month seasonal trends; most indicators should still show                                                                  Year-Over-Year                  Year-Over-Year                   Year-Over-Year
improvement on a year-over-year basis. As you already know, all real estate is                                                     (YoY) Change in                 (YoY) Change in                  (YoY) Change in
local – down to the city neighborhood, suburban development and exurban lot.                                                        Closed Sales                    Closed Sales                     Closed Sales
Let's dive into some local figures.                                                                                                  All Properties               Single-Family Only               Condominium Only


New Listings in the Greater Boston region were down 9.7 percent for detached
homes and 9.8 percent for condominiums. Pending Sales increased 31.3                                                          Single-Family Market Overview                                                                 2
percent for single-family homes and 40.9 percent for condominiums.                                                            Condominium Market Overview                                                                   3
                                                                                                                              Closed Sales                                                                                  4
The Median Sales Price was down 4.3 percent to $430,000 for single-family
properties but increased 1.4 percent to $372,800 for condominiums. Months                                                     Median Sales Price                                                                            5
Supply of Inventory decreased 27.8 percent for single-family units and 47.6                                                   Housing Affordability Index                                                                   6
percent for townhouse-condo units.
                                                                                                                              Inventory of Homes for Sale                                                                   7
Not to get negative like a political TV ad, but sluggish job growth, persistently                                             Months Supply of Inventory                                                                    8
high gas prices, drought-induced spikes in food prices and other global events                                                Days On Market Until Sale                                                                     9
could threaten consumer confidence. The Fed's mortgage purchases drove
Freddie Mac's average 30-year fixed-rate mortgage survey to an all-time low of
                                                                                                                              Percent of Original List Price Received                                                      10
3.40 percent. Employment growth remains critical, providing the very jobs that                                                Pending Sales                                                                                11
will stimulate housing demand and higher prices as well as alleviate                                                          New Listings                                                                                 12
beleaguered homeowners.
                                                                                                                              City of Boston Overview                                                                      13
                                                                                                                              Click on desired metric to jump to that page.


                                                Data is refreshed regularly to capture changes in market activity so figures shown may be different than previously reported. Current as of October 16, 2012. All data from MLS Property
                                                     Information Network, Inc. Provided by Greater Boston Association of REALTORS® and the Massachusetts Association of REALTORS®. Powered by 10K Research and Marketing.
Single-Family Market Overview
Key market metrics for the current month and year-to-date figures for Single-Family Homes Only.


 Key Metrics                                            Historical Sparklines                                                            Sep-2011 Sep-2012                      +/–            YTD 2011 YTD 2012                      +/–


 Closed Sales                                                                                                                                784               759             - 3.2%             7,015             8,318           + 18.6%
                                                       9-2009                  9-2010                  9-2011                  9-2012


 Median Sales Price                                                                                                                      $449,500          $430,000            - 4.3%          $464,000          $461,000            - 0.6%
                                                       9-2009                  9-2010                  9-2011                  9-2012


 Housing Affordability Index                                                                                                                 101               116            + 15.2%               98               109            + 11.6%
                                                       9-2009                  9-2010                  9-2011                  9-2012


 Inventory of Homes for Sale                                                                                                                5,638             3,943           - 30.1%                --                --                --
                                                       9-2009
                                                       9 2009                  9-2010
                                                                               9 2010                  9-2011
                                                                                                       9 2011                  9-2012
                                                                                                                               9 2012


 Months Supply of Inventory                                                                                                                   7.2               5.2           - 27.8%                --                --                --
                                                       9-2009                  9-2010                  9-2011                  9-2012


 Days on Market Until Sale                                                                                                                   101                88            - 13.2%              103               100             - 2.9%
                                                       9-2009                  9-2010                  9-2011                  9-2012


 Percent of Original
                                                                                                                                           93.2%             94.6%             + 1.5%            93.4%             94.4%            + 1.1%
 List Price Received
                                                       9-2009                  9-2010                  9-2011                  9-2012


 Pending Sales                                                                                                                               665               873            + 31.3%             7,186             8,837           + 23.0%
                                                       9-2009                  9-2010                  9-2011                  9-2012


 New Listings                                                                                                                               1,590             1,436            - 9.7%            13,086            12,812            - 2.1%
                                                       9-2009                  9-2010                  9-2011                  9-2012


                     All data from MLS Property Information Network, Inc. Provided by the Greater Boston Association of REALTORS® and the Massachusetts Association of REALTORS®. Powered by 10K Research and Marketing. | Click for Cover Page | 2
Condominium Market Overview
Key market metrics for the current month and year-to-date figures for Condominium Properties Only.


 Key Metrics                                            Historical Sparklines                                                            Sep-2011 Sep-2012                      +/–            YTD 2011 YTD 2012                      +/–


 Closed Sales                                                                                                                                648               735            + 13.4%             6,220             7,417           + 19.2%
                                                       9-2009                  9-2010                  9-2011                  9-2012


 Median Sales Price                                                                                                                      $367,500          $372,800            + 1.4%          $360,000          $379,000           + 5.3%
                                                       9-2009                  9-2010                  9-2011                  9-2012


 Housing Affordability Index                                                                                                                 121               132             + 9.1%              123               130            + 5.7%
                                                       9-2009                  9-2010                  9-2011                  9-2012


 Inventory of Homes for Sale                                                                                                                4,322             2,568           - 40.6%                --                --                --
                                                       9-2009
                                                       9 2009                  9-2010
                                                                               9 2010                  9-2011
                                                                                                       9 2011                  9-2012
                                                                                                                               9 2012


 Months Supply of Inventory                                                                                                                   6.7               3.5           - 47.6%                --                --                --
                                                       9-2009                  9-2010                  9-2011                  9-2012


 Days on Market Until Sale                                                                                                                   103                85            - 17.7%              104                88            - 15.3%
                                                       9-2009                  9-2010                  9-2011                  9-2012


 Percent of Original
                                                                                                                                           94.2%             96.4%             + 2.4%            94.1%             95.7%            + 1.7%
 List Price Received
                                                       9-2009                  9-2010                  9-2011                  9-2012


 Pending Sales                                                                                                                               518               730            + 40.9%             6,344             7,910           + 24.7%
                                                       9-2009                  9-2010                  9-2011                  9-2012


 New Listings                                                                                                                               1,281             1,155            - 9.8%            11,730            10,743            - 8.4%
                                                       9-2009                  9-2010                  9-2011                  9-2012


                     All data from MLS Property Information Network, Inc. Provided by the Greater Boston Association of REALTORS® and the Massachusetts Association of REALTORS®. Powered by 10K Research and Marketing. | Click for Cover Page | 3
Closed Sales
A count of the actual sales that have closed in a given month.


 September                                                                   Year to Date                                                                                            Single-Family
                                                                                                                                                                                                          YoY
                                                                                                                                                                                                         Change
                                                                                                                                                                                                                      Condominium
                                                                                                                                                                                                                                           YoY
                                                                                                                                                                                                                                          Change

                                                                                                                                                                    Oct-2011               619           + 6.0%             513           + 6.4%
                                                                                                       8,318
               784                                                                                                                                                  Nov-2011               690           + 8.8%             562          + 11.1%
                        759                                 735                                                                             7,417
                                                                                  7,195 7,015                                                                       Dec-2011               745           + 1.2%             644            - 1.7%
        672                                       648                                                                  6,663
                                                                                                                                 6,220                              Jan-2012               526          + 12.6%             413           + 2.7%
                                       577                                                                                                                          Feb-2012               474          + 33.5%             385          + 12.2%
                                                                                                                                                                    Mar-2012               656          + 16.3%             608          + 10.9%
                                                                                                                                                                    Apr-2012               752          + 12.1%             757          + 19.6%
                                                                                                                                                                    May-2012              1,017         + 20.4%            1,013         + 32.1%
                                                                                                                                                                    Jun-2012              1,529         + 21.4%            1,268         + 20.0%
                                                                                                                                                                    Jul-2012              1,291         + 25.2%            1,038         + 21.4%
                                                                                                                                                                    Aug-2012             1,314          + 26.5%            1,200         + 24.1%
        2010    2011    2012            2010      2011       2012                  2010       2011      2012            2010       2011       2012
                                                                                                                                                                    Sep-2012               759           - 3.2%             735          + 13.4%
               +16.7%   -3.2%                    +12.3%    +13.4%                            -2.5%    +18.6%                       -6.6%    +19.2%
                                                                                                                                                                    Total                10,372         + 15.6%            9,136         + 16.2%
          Single-Family                   Condominium                                 Single-Family                        Condominium


Historical Closed Sales Activity                                                                                                                                            Single-Family                        Condominium
1,800

1,600

1,400

1,200

1,000

 800

 600

 400

 200
  Jan-2003              Jan-2004               Jan-2005                Jan-2006                 Jan-2007                Jan-2008                Jan-2009                 Jan-2010                 Jan-2011               Jan-2012


                        All data from MLS Property Information Network, Inc. Provided by the Greater Boston Association of REALTORS® and the Massachusetts Association of REALTORS®. Powered by 10K Research and Marketing. | Click for Cover Page | 4
Median Sales Price
Median price point for all closed sales, not accounting for seller concessions, in a given month.


September                                                                      Year to Date                                                                                            Single-Family
                                                                                                                                                                                                            YoY
                                                                                                                                                                                                           Change
                                                                                                                                                                                                                        Condominium
                                                                                                                                                                                                                                             YoY
                                                                                                                                                                                                                                            Change

                                                                                                                                                                      Oct-2011           $390,000          - 11.6%        $349,000          + 4.8%
                                                                                              $464,000 $461,000
   $440,000
              $449,500                                                             $454,000                                                                           Nov-2011           $423,000          - 4.6%         $350,500           - 7.3%
                         $430,000
                                                                                                                                                                      Dec-2011           $440,000          + 1.1%         $344,750           - 2.9%
                                                                                                                                              $379,000
                                                   $367,500 $372,800
                                        $355,000                                                                        $347,500
                                                                                                                                   $360,000                           Jan-2012           $405,000          - 9.0%         $349,950           - 1.7%
                                                                                                                                                                      Feb-2012           $391,875          + 3.4%         $371,000          + 6.6%
                                                                                                                                                                      Mar-2012           $412,500          - 0.9%         $340,000          + 4.8%
                                                                                                                                                                      Apr-2012           $414,850          - 3.3%         $370,750          + 5.6%
                                                                                                                                                                      May-2012           $465,000          + 1.3%         $381,000          + 4.4%
                                                                                                                                                                      Jun-2012           $500,000          - 0.2%         $400,000          + 6.7%
                                                                                                                                                                      Jul-2012           $510,000          + 2.2%         $387,000          + 6.3%
                                                                                                                                                                      Aug-2012           $489,450          - 1.9%         $380,000          + 3.5%
     2010        2011     2012           2010        2011      2012                  2010       2011      2012            2010       2011       2012
                                                                                                                                                                      Sep-2012           $430,000          - 4.3%         $372,800          + 1.4%
               +2.2%      -4.3%                     +3.5%     +1.4%                            +2.2%     -0.6%                      +3.6%      +5.3%
                                                                                                                                                                      Median             $450,000          - 1.7%         $373,000          + 3.6%
       Single-Family                        Condominium                                 Single-Family                        Condominium


Historical Median Sales Price                                                                                                                                                  Single-Family                        Condominium
$550,000


$500,000


$450,000


$400,000


$350,000


$300,000


$250,000
      Jan-2003               Jan-2004               Jan-2005                Jan-2006               Jan-2007                Jan-2008                Jan-2009               Jan-2010                Jan-2011                Jan-2012


                          All data from MLS Property Information Network, Inc. Provided by the Greater Boston Association of REALTORS® and the Massachusetts Association of REALTORS®. Powered by 10K Research and Marketing. | Click for Cover Page | 5
Housing Affordability Index
This index measures housing affordability for the region. An index of 120 means the median household income was 120% of what is necessary
to qualify for the median-priced home under prevailing interest rates. A higher number means greater affordability.


September                                                                  Year to Date                                                                                            Single-Family
                                                                                                                                                                                                        YoY
                                                                                                                                                                                                       Change
                                                                                                                                                                                                                    Condominium
                                                                                                                                                                                                                                         YoY
                                                                                                                                                                                                                                        Change
                                                          132                                                                              130                    Oct-2011               116          + 19.3%             128           + 2.2%
                                     120        121                                                                   122        123
                     116                                                                                                                                          Nov-2011               108          + 10.0%             128          + 12.8%
                                                                                                      109
             101                                                                                                                                                  Dec-2011               104           + 5.9%             130           + 9.8%
      99                                                                          96        98
                                                                                                                                                                  Jan-2012               113          + 17.4%             129           + 9.3%
                                                                                                                                                                  Feb-2012               119           + 7.9%             125           + 4.9%
                                                                                                                                                                  Mar-2012               113          + 11.2%             135           + 5.6%
                                                                                                                                                                  Apr-2012               112          + 13.1%             124           + 4.3%
                                                                                                                                                                  May-2012               102           + 7.2%             122           + 4.2%
                                                                                                                                                                  Jun-2012               97            + 8.5%             118           + 1.9%
                                                                                                                                                                  Jul-2012               96            + 7.9%             124           + 3.9%
                                                                                                                                                                  Aug-2012               100          + 11.0%             127           + 5.5%
      2010   2011     2012           2010       2011       2012                  2010       2011      2012            2010       2011       2012
                                                                                                                                                                  Sep-2012               116          + 15.2%             132           + 9.1%
             +1.9%   +15.2%                    +0.7%      +9.1%                            +1.8%     +11.6%                     +0.7%      +5.7%
                                                                                                                                                                  Average                108           +11.2%             127            +6.1%
        Single-Family                   Condominium                                 Single-Family                        Condominium


Historical Housing Affordability Index                                                                                                                                 Single-Family                          Condominium
140

130

120

110

100

 90

 80

 70

60
Jan-2004               Jan-2005                   Jan-2006                   Jan-2007                   Jan-2008                   Jan-2009                   Jan-2010                    Jan-2011                   Jan-2012


                      All data from MLS Property Information Network, Inc. Provided by the Greater Boston Association of REALTORS® and the Massachusetts Association of REALTORS®. Powered by 10K Research and Marketing. | Click for Cover Page | 6
Inventory of Homes for Sale
The number of properties available for sale in active status at the end of a given month.


September                                                                                                                                                                          Single-Family
                                                                                                                                                                                                        YoY
                                                                                                                                                                                                       Change
                                                                                                                                                                                                                    Condominium
                                                                                                                                                                                                                                         YoY
                                                                                                                                                                                                                                        Change

                                                                                                                                                                  Oct-2011              5,415          - 0.1%            4,094          - 20.9%
              5,602           5,638
                                                                                       5,334                                                                      Nov-2011              4,598          - 3.4%            3,588          - 21.0%
                                                                                                                                                                  Dec-2011              3,651          - 3.0%            2,803          - 20.9%
                                                                                                            4,322                                                 Jan-2012              3,685          - 2.9%            2,962          - 19.5%
                                                   3,943
                                                                                                                                                                  Feb-2012              4,074          + 6.2%            3,251          - 17.0%
                                                                                                                                                                  Mar-2012              4,687          + 1.3%            3,676          - 21.6%
                                                                                                                                2,568                             Apr-2012              5,026          - 5.5%            3,823          - 26.2%
                                                                                                                                                                  May-2012              5,111          - 10.8%           3,620          - 30.7%
                                                                                                                                                                  Jun-2012              4,755          - 16.9%           3,308          - 35.1%
                                                                                                                                                                  Jul-2012              4,273          - 23.6%           2,990          - 36.6%
                                                                                                                                                                  Aug-2012              3,827          - 28.7%           2,525          - 40.1%
              2010               2011               2012                                 2010                2011                 2012                            Sep-2012              3,943          - 30.1%           2,568          - 40.6%
                            +0.6%                  30 1%
                                                  -30.1%                                                 -19.0%                -40.6%                             Average               4,420          - 10.9%           3,267          - 27.8%
                         Single-Family                                                                Condominium


Historical Inventory of Homes for Sale                                                                                                                                    Single-Family                         Condominium
9,000


8,000


7,000


6,000


5,000


4,000


3,000


2,000
   Jan-2003           Jan-2004               Jan-2005                Jan-2006                Jan-2007                Jan-2008                Jan-2009                Jan-2010                Jan-2011                 Jan-2012


                      All data from MLS Property Information Network, Inc. Provided by the Greater Boston Association of REALTORS® and the Massachusetts Association of REALTORS®. Powered by 10K Research and Marketing. | Click for Cover Page | 7
Months Supply of Inventory
The inventory of homes for sale at the end of a given month, divided by the average monthly pending sales from the last 12 months.


September                                                                                                                                                                         Single-Family
                                                                                                                                                                                                       YoY
                                                                                                                                                                                                      Change
                                                                                                                                                                                                                   Condominium
                                                                                                                                                                                                                                        YoY
                                                                                                                                                                                                                                       Change
                                                                                        9.2                                                                      Oct-2011               8.7           - 5.7%             8.0           - 25.7%
             8.3                                                                                                                                                 Nov-2011               6.7           - 11.2%            6.4           - 28.9%

                               7.2                                                                                                                               Dec-2011               4.9           - 4.2%             4.4           - 19.6%
                                                                                                             6.7                                                 Jan-2012               7.0           - 13.8%            7.2           - 21.7%
                                                                                                                                                                 Feb-2012               8.6           - 20.5%            8.4           - 26.0%
                                                    5.2
                                                                                                                                                                 Mar-2012               7.1           - 12.9%            6.0           - 29.3%
                                                                                                                                                                 Apr-2012               6.7           - 15.6%            5.1           - 38.3%
                                                                                                                                 3.5
                                                                                                                                                                 May-2012               5.0           - 25.9%            3.6           - 47.5%
                                                                                                                                                                 Jun-2012               3.1           - 31.6%            2.6           - 45.9%
                                                                                                                                                                 Jul-2012               3.3           - 39.0%            2.9           - 47.8%
                                                                                                                                                                 Aug-2012               2.9           - 43.6%            2.1           - 51.7%
             2010             2011                 2012                                 2010                2011                2012                             Sep-2012               5.2           - 27.8%            3.5           - 47.6%
                           -13.7%                -27.8%                                                -27.9%                 -47.6%                             Average                5.6           - 16.0%            4.7           - 30.4%
                        Single-Family                                                                Condominium


Historical Months Supply of Inventory                                                                                                                                 Single-Family                          Condominium
14


12


10


 8


 6


 4


 2
Jan-2004              Jan-2005                   Jan-2006                   Jan-2007                   Jan-2008                   Jan-2009                    Jan-2010                   Jan-2011                   Jan-2012


                     All data from MLS Property Information Network, Inc. Provided by the Greater Boston Association of REALTORS® and the Massachusetts Association of REALTORS®. Powered by 10K Research and Marketing. | Click for Cover Page | 8
Days on Market Until Sale
Average number of days between when a property is listed and when an offer is accepted in a given month.


September                                                                  Year to Date                                                                                            Single-Family
                                                                                                                                                                                                        YoY
                                                                                                                                                                                                       Change
                                                                                                                                                                                                                    Condominium
                                                                                                                                                                                                                                         YoY
                                                                                                                                                                                                                                        Change

                                                                                                                                                                  Oct-2011               108           + 3.7%              95           - 14.8%
                                     107                                                                                         104                              Nov-2011               110           + 4.1%             109           + 7.7%
             101                                103                                        103                        101
      99                                                                                              100                                                         Dec-2011               112           - 0.3%             120          + 12.0%
                                                                                  92
                      88                                   85                                                                               88                    Jan-2012               130          + 15.0%             124            - 5.1%
                                                                                                                                                                  Feb-2012               134           + 2.9%             123            - 9.8%
                                                                                                                                                                  Mar-2012               130           - 3.5%             118            - 4.2%
                                                                                                                                                                  Apr-2012               120           - 1.4%              98           - 16.3%
                                                                                                                                                                  May-2012               96            - 6.4%              86           - 12.0%
                                                                                                                                                                  Jun-2012               90            - 0.1%              75           - 19.5%
                                                                                                                                                                  Jul-2012               81            - 4.4%              71           - 20.7%
                                                                                                                                                                  Aug-2012               88            - 5.4%              76           - 18.4%
      2010   2011     2012           2010       2011      2012                   2010      2011       2012            2010       2011      2012
                                                                                                                                                                  Sep-2012               88            - 13.2%             85           - 17.7%
             +2.8%   -13.2%                     -3.5%    -17.7%                           +11.8%      -2.9%                     +3.4%     -15.3%
                                                                                                                                                                  Total                  102           - 1.9%              85           - 10.5%
        Single-Family                   Condominium                                 Single-Family                        Condominium


Historical Days on Market Until Sale                                                                                                                                      Single-Family                        Condominium
160


140


120


100


 80


 60


 40
 Jan-2003            Jan-2004               Jan-2005                Jan-2006                 Jan-2007                Jan-2008                Jan-2009                 Jan-2010                 Jan-2011                Jan-2012


                      All data from MLS Property Information Network, Inc. Provided by the Greater Boston Association of REALTORS® and the Massachusetts Association of REALTORS®. Powered by 10K Research and Marketing. | Click for Cover Page | 9
Percent of Original List Price Received
Percentage found when dividing a property’s sales price by its original list price, then taking the average for all properties sold in a given month,
not accounting for seller concessions.


September                                                                  Year to Date                                                                                            Single-Family
                                                                                                                                                                                                        YoY
                                                                                                                                                                                                       Change
                                                                                                                                                                                                                    Condominium
                                                                                                                                                                                                                                         YoY
                                                                                                                                                                                                                                        Change

                                                                                                                                                                  Oct-2011             91.8%           - 0.4%           93.6%           + 0.1%
                                                                                                                                                                  Nov-2011             92.4%           - 0.3%           93.8%            - 0.2%
                                                96.4%                                                                94.6% 94.1% 95.7%                            Dec-2011             92.2%           + 1.0%           93.0%           + 0.1%
    92.9% 93.2% 94.6%               92.7% 94.2%                                94.1% 93.4% 94.4%
                                                                                                                                                                  Jan-2012             90.5%           - 0.4%           92.8%           + 0.5%
                                                                                                                                                                  Feb-2012             91.2%           + 0.3%           93.4%           + 1.5%
                                                                                                                                                                  Mar-2012             93.0%           + 0.8%           94.0%           + 0.9%
                                                                                                                                                                  Apr-2012             93.5%           + 0.9%           95.7%           + 2.0%
                                                                                                                                                                  May-2012             95.4%           + 1.2%           96.1%           + 1.0%
                                                                                                                                                                  Jun-2012             95.3%           + 0.8%           96.3%           + 1.7%
                                                                                                                                                                  Jul-2012             95.7%           + 1.5%           96.6%           + 1.7%
                                                                                                                                                                  Aug-2012             94.8%           + 1.5%           96.3%           + 2.2%
      2010    2011    2012           2010       2011       2012                  2010       2011      2012            2010       2011       2012
                                                                                                                                                                  Sep-2012             94.6%           + 1.5%           96.4%           + 2.4%
             +0.3%   +1.5%                      +1.6%     +2.4%                            -0.7%      +1.1%                      -0.5%     +1.7%
                                                                                                                                                                  Average              93.9%           + 0.9%           95.3%           + 1.4%
        Single-Family                   Condominium                                 Single-Family                        Condominium


Historical Percent of Original List Price Received                                                                                                                         Single-Family                        Condominium
99%

98%

97%

96%

95%

94%

93%

92%

91%

90%

89%
  Jan-2003           Jan-2004               Jan-2005               Jan-2006                Jan-2007                Jan-2008                Jan-2009                Jan-2010               Jan-2011                Jan-2012


                     All data from MLS Property Information Network, Inc. Provided by the Greater Boston Association of REALTORS® and the Massachusetts Association of REALTORS®. Powered by 10K Research and Marketing. | Click for Cover Page | 10
Pending Sales
A count of the properties in UAG status between the first and last day in a given month, regardless of current status (based on Off Market Date).


September                                                                    Year to Date                                                                                            Single-Family
                                                                                                                                                                                                          YoY
                                                                                                                                                                                                         Change
                                                                                                                                                                                                                      Condominium
                                                                                                                                                                                                                                           YoY
                                                                                                                                                                                                                                          Change

                                                                                                                                                                    Oct-2011               744           + 3.0%             594           + 7.2%

                        873                                                                            8,837                                                        Nov-2011               684          + 16.7%             564            - 2.1%

                                                                                                                                            7,910                   Dec-2011               571           + 5.4%             471           + 6.3%
                                                             730                   7,283 7,186                                                                      Jan-2012               546          + 26.7%             484          + 18.6%
               665                                                                                                     6,629 6,344
        616                                                                                                                                                         Feb-2012               651          + 23.1%             636          + 24.2%

                                                  518                                                                                                               Mar-2012              1,000         + 25.3%            1,016         + 32.8%
                                       499
                                                                                                                                                                    Apr-2012              1,153         + 21.6%            1,049         + 24.3%
                                                                                                                                                                    May-2012              1,342         + 23.3%            1,272         + 29.0%
                                                                                                                                                                    Jun-2012              1,276         + 14.0%            1,052         + 20.0%
                                                                                                                                                                    Jul-2012              1,059         + 26.8%             847          + 10.9%
                                                                                                                                                                    Aug-2012               937          + 21.2%             824          + 23.0%
        2010   2011     2012           2010       2011       2012                  2010       2011      2012            2010       2011       2012
                                                                                                                                                                    Sep-2012               873          + 31.3%             730          + 40.9%
               +8.0%   +31.3%                     +3.8%    +40.9%                            -1.3%     +23.0%                     -4.3%     +24.7%
                                                                                                                                                                    Total                10,836         + 19.9%            9,539         + 20.5%
          Single-Family                   Condominium                                 Single-Family                        Condominium


Historical Pending Sales Activity                                                                                                                                           Single-Family                        Condominium
1,400


1,200


1,000


 800


 600


 400


 200
  Jan-2003             Jan-2004                Jan-2005                 Jan-2006                Jan-2007                Jan-2008                Jan-2009                 Jan-2010                 Jan-2011               Jan-2012


                       All data from MLS Property Information Network, Inc. Provided by the Greater Boston Association of REALTORS® and the Massachusetts Association of REALTORS®. Powered by 10K Research and Marketing. | Click for Cover Page | 11
New Listings
A count of the properties that have been newly listed on the market in a given month.


September                                                                    Year to Date                                                                                            Single-Family
                                                                                                                                                                                                          YoY
                                                                                                                                                                                                         Change
                                                                                                                                                                                                                      Condominium
                                                                                                                                                                                                                                           YoY
                                                                                                                                                                                                                                          Change

                                                                                                                                                                    Oct-2011              1,159          - 2.3%             902           - 19.8%
    1,692
               1,590                  1,621                                                                                                                         Nov-2011               682           - 8.6%             628           - 11.8%
                                                                                 13,494 13,086                        13,611
                       1,436                                                                   12,812                                                               Dec-2011               459           + 6.0%             389           - 20.4%
                                                 1,281                                                                           11,730                             Jan-2012               974          + 14.3%             958            - 1.8%
                                                           1,155                                                                           10,743
                                                                                                                                                                    Feb-2012              1,336         + 51.3%            1,145          + 5.8%
                                                                                                                                                                    Mar-2012              2,023          + 3.1%            1,741          - 12.0%
                                                                                                                                                                    Apr-2012              1,811          - 9.3%            1,503          - 13.1%
                                                                                                                                                                    May-2012              1,810          - 4.1%            1,391           - 7.5%
                                                                                                                                                                    Jun-2012              1,372          - 15.1%           1,155          - 14.1%
                                                                                                                                                                    Jul-2012              1,036          - 13.1%            905            - 7.6%
                                                                                                                                                                    Aug-2012              1,014          - 8.3%             790            - 7.6%
        2010    2011    2012           2010       2011       2012                  2010       2011      2012            2010       2011       2012
                                                                                                                                                                    Sep-2012              1,436          - 9.7%            1,155           - 9.8%
               -6.0%   -9.7%                     -21.0%     -9.8%                            -3.0%     -2.1%                      -13.8%     -8.4%
                                                                                                                                                                    Total                15,112          - 2.2%           12,662          - 9.9%
          Single-Family                   Condominium                                 Single-Family                        Condominium


Historical New Listing Activity                                                                                                                                                 Single-Family                       Condominium
2,750

2,500

2,250

2,000

1,750

1,500

1,250

1,000

 750

 500

 250
  Jan-2003             Jan-2004                Jan-2005                Jan-2006                Jan-2007                Jan-2008                Jan-2009                Jan-2010                  Jan-2011               Jan-2012


                       All data from MLS Property Information Network, Inc. Provided by the Greater Boston Association of REALTORS® and the Massachusetts Association of REALTORS®. Powered by 10K Research and Marketing. | Click for Cover Page | 12
City of Boston – Market Overview
Key market metrics for the current month and year-to-date figures for the City of Boston.


 Key Metrics                                             Historical Sparklines                                                            Sep-2011 Sep-2012                       +/–           YTD 2011 YTD 2012                      +/–


 Closed Sales                                                                                                                                  354              389             + 9.9%             3,423             4,179           + 22.1%
                                                        9-2009                  9-2010                  9-2011                  9-2012


 Median Sales Price                                                                                                                       $391,250          $389,000            - 0.6%          $375,000          $400,000            + 6.7%
                                                        9-2009                  9-2010                  9-2011                  9-2012


 Housing Affordability Index                                                                                                                   101              116            + 15.2%               98               109            + 11.6%
                                                        9-2009                  9-2010                  9-2011                  9-2012


 Inventory of Homes for Sale                                                                                                                 2,334             1,280           - 45.2%                --                --                --
                                                        9-2009
                                                        9 2009                  9-2010
                                                                                9 2010                  9-2011
                                                                                                        9 2011                  9-2012
                                                                                                                                9 2012


 Months Supply of Inventory                                                                                                                    6.6               3.3           - 50.1%                --                --                --
                                                        9-2009                  9-2010                  9-2011                  9-2012


 Days on Market Until Sale                                                                                                                     95                74            - 21.9%              100                85            - 15.1%
                                                        9-2009                  9-2010                  9-2011                  9-2012


 Percent of Original
                                                                                                                                            94.6%             96.1%             + 1.7%            93.9%             95.6%             + 1.7%
 List Price Received
                                                        9-2009                  9-2010                  9-2011                  9-2012


 Pending Sales                                                                                                                                 284              412            + 45.1%             3,507             4,419           + 26.0%
                                                        9-2009                  9-2010                  9-2011                  9-2012


 New Listings                                                                                                                                  739              639            - 13.5%             6,624             6,040            - 8.8%
                                                        9-2009                  9-2010                  9-2011                  9-2012


                     All data from MLS Property Information Network, Inc. Provided by the Greater Boston Association of REALTORS® and the Massachusetts Association of REALTORS®. Powered by 10K Research and Marketing. | Click for Cover Page | 13

Weitere ähnliche Inhalte

Was ist angesagt?

Greater Princeton NJ Real Estate Market Update 1 31 13
Greater Princeton NJ Real Estate Market Update 1 31 13Greater Princeton NJ Real Estate Market Update 1 31 13
Greater Princeton NJ Real Estate Market Update 1 31 13
Ann Harwood
 
MRIS Virginia 2009 Mid-Year Trends Report
MRIS Virginia 2009 Mid-Year Trends ReportMRIS Virginia 2009 Mid-Year Trends Report
MRIS Virginia 2009 Mid-Year Trends Report
Matthew Rathbun
 
Cardinal Update September 2012
Cardinal Update September 2012Cardinal Update September 2012
Cardinal Update September 2012
KimGibson
 

Was ist angesagt? (17)

September 2012 Toronto Real Estate Market Watch
September 2012 Toronto Real Estate Market WatchSeptember 2012 Toronto Real Estate Market Watch
September 2012 Toronto Real Estate Market Watch
 
Monthly Real Estate Indicators: Twin Cities Housing Market Info & Statistics
Monthly Real Estate Indicators: Twin Cities Housing Market Info & StatisticsMonthly Real Estate Indicators: Twin Cities Housing Market Info & Statistics
Monthly Real Estate Indicators: Twin Cities Housing Market Info & Statistics
 
Las Vegas Americas Market Beat Office Q42011
Las Vegas Americas Market Beat Office Q42011Las Vegas Americas Market Beat Office Q42011
Las Vegas Americas Market Beat Office Q42011
 
Greater Princeton NJ Real Estate Market Update 1 31 13
Greater Princeton NJ Real Estate Market Update 1 31 13Greater Princeton NJ Real Estate Market Update 1 31 13
Greater Princeton NJ Real Estate Market Update 1 31 13
 
Market Watch August 2012
Market Watch August 2012Market Watch August 2012
Market Watch August 2012
 
Greater Princeton Area Real Estate Trends March 14 2013
Greater Princeton Area Real Estate Trends March 14 2013Greater Princeton Area Real Estate Trends March 14 2013
Greater Princeton Area Real Estate Trends March 14 2013
 
Las Vegas Americas Market Beat Medical Office Q42011 In House
Las Vegas Americas Market Beat Medical Office Q42011 In HouseLas Vegas Americas Market Beat Medical Office Q42011 In House
Las Vegas Americas Market Beat Medical Office Q42011 In House
 
Toronto real estate statistics january 2012
Toronto real estate statistics january 2012Toronto real estate statistics january 2012
Toronto real estate statistics january 2012
 
CMHC Kingston 2012
CMHC Kingston 2012CMHC Kingston 2012
CMHC Kingston 2012
 
Remax Spring Market Trends
Remax Spring Market TrendsRemax Spring Market Trends
Remax Spring Market Trends
 
Goldman
GoldmanGoldman
Goldman
 
MRIS Virginia 2009 Mid-Year Trends Report
MRIS Virginia 2009 Mid-Year Trends ReportMRIS Virginia 2009 Mid-Year Trends Report
MRIS Virginia 2009 Mid-Year Trends Report
 
Toronto real estate statistics august 2011
Toronto real estate statistics august 2011Toronto real estate statistics august 2011
Toronto real estate statistics august 2011
 
Month in-review-february-2013
Month in-review-february-2013Month in-review-february-2013
Month in-review-february-2013
 
282 month in-review_june_2016
282 month in-review_june_2016282 month in-review_june_2016
282 month in-review_june_2016
 
Cardinal Update September 2012
Cardinal Update September 2012Cardinal Update September 2012
Cardinal Update September 2012
 
November 2011 Market Watch
November 2011 Market WatchNovember 2011 Market Watch
November 2011 Market Watch
 

Andere mochten auch

Slides Familiekursus formidlingskonference
Slides Familiekursus formidlingskonferenceSlides Familiekursus formidlingskonference
Slides Familiekursus formidlingskonference
Kristine Nygaard
 

Andere mochten auch (7)

Slides Familiekursus formidlingskonference
Slides Familiekursus formidlingskonferenceSlides Familiekursus formidlingskonference
Slides Familiekursus formidlingskonference
 
Multi-Family Housing Activity Report, September 2012
Multi-Family Housing Activity Report, September 2012Multi-Family Housing Activity Report, September 2012
Multi-Family Housing Activity Report, September 2012
 
April 2013 Monthly Multi-family Housing Activity Report – Boston Real Estate
April 2013 Monthly Multi-family Housing Activity Report – Boston Real Estate April 2013 Monthly Multi-family Housing Activity Report – Boston Real Estate
April 2013 Monthly Multi-family Housing Activity Report – Boston Real Estate
 
Building meeting design foundation at EIBTM Barcelona 2013
Building meeting design foundation at EIBTM Barcelona 2013Building meeting design foundation at EIBTM Barcelona 2013
Building meeting design foundation at EIBTM Barcelona 2013
 
August 2013 Multifamily Housing Activity Report – Boston, MA Real Estate
August 2013 Multifamily Housing Activity Report – Boston, MA Real EstateAugust 2013 Multifamily Housing Activity Report – Boston, MA Real Estate
August 2013 Multifamily Housing Activity Report – Boston, MA Real Estate
 
September 2013 Multifamily Housing Activity Report – Boston, MA Real Estate
September 2013 Multifamily Housing Activity Report – Boston, MA Real EstateSeptember 2013 Multifamily Housing Activity Report – Boston, MA Real Estate
September 2013 Multifamily Housing Activity Report – Boston, MA Real Estate
 
June 2013 Multifamily Housing Activity Report – Boston, MA Real Estate
June 2013 Multifamily Housing Activity Report – Boston, MA Real EstateJune 2013 Multifamily Housing Activity Report – Boston, MA Real Estate
June 2013 Multifamily Housing Activity Report – Boston, MA Real Estate
 

Ähnlich wie Greater Boston Real Estate Market Data, September 2012

The Nest Report Q3 2012
The Nest Report Q3 2012The Nest Report Q3 2012
The Nest Report Q3 2012
Jeremy Hart
 
Market Watch: August 2012
Market Watch: August 2012Market Watch: August 2012
Market Watch: August 2012
lauragolbeck
 
The Nest Report Q2 2012
The Nest Report Q2 2012The Nest Report Q2 2012
The Nest Report Q2 2012
Jeremy Hart
 
Toronto Real Estate Market Update june 2012
Toronto Real Estate Market Update june 2012Toronto Real Estate Market Update june 2012
Toronto Real Estate Market Update june 2012
jefftoleary
 

Ähnlich wie Greater Boston Real Estate Market Data, September 2012 (20)

Mw1209
Mw1209Mw1209
Mw1209
 
The Nest Report Q3 2012
The Nest Report Q3 2012The Nest Report Q3 2012
The Nest Report Q3 2012
 
The Nest Report Q1 2012
The Nest Report Q1 2012The Nest Report Q1 2012
The Nest Report Q1 2012
 
Market Watch: August 2012
Market Watch: August 2012Market Watch: August 2012
Market Watch: August 2012
 
Toronto real estate statistics november 2011
Toronto real estate statistics november 2011Toronto real estate statistics november 2011
Toronto real estate statistics november 2011
 
Toronto Market Watch for February 2012
Toronto Market Watch for February 2012Toronto Market Watch for February 2012
Toronto Market Watch for February 2012
 
Mw1204
Mw1204Mw1204
Mw1204
 
Cre finance council (june 2012)
Cre finance council (june 2012)Cre finance council (june 2012)
Cre finance council (june 2012)
 
The Nest Report Q2 2012
The Nest Report Q2 2012The Nest Report Q2 2012
The Nest Report Q2 2012
 
TREB Market Watch Report November 2012
TREB Market Watch Report November 2012TREB Market Watch Report November 2012
TREB Market Watch Report November 2012
 
TREB Market Watch May 2012
TREB Market Watch May 2012TREB Market Watch May 2012
TREB Market Watch May 2012
 
Toronto Real Estate Market Update june 2012
Toronto Real Estate Market Update june 2012Toronto Real Estate Market Update june 2012
Toronto Real Estate Market Update june 2012
 
Toronto Area REALTORS Releases Market Watch for May 2012
Toronto Area REALTORS Releases Market Watch for May 2012Toronto Area REALTORS Releases Market Watch for May 2012
Toronto Area REALTORS Releases Market Watch for May 2012
 
John Helfrich Real Estate Newsletter January February 2012
John Helfrich Real Estate Newsletter January February 2012John Helfrich Real Estate Newsletter January February 2012
John Helfrich Real Estate Newsletter January February 2012
 
Toronto Real Estate Statistics september 2011
Toronto Real Estate Statistics september 2011Toronto Real Estate Statistics september 2011
Toronto Real Estate Statistics september 2011
 
Greater Princeton NJ Real Estate Update
Greater Princeton NJ Real Estate UpdateGreater Princeton NJ Real Estate Update
Greater Princeton NJ Real Estate Update
 
Greater Princeton NJ Real Estate Market October 2012
Greater Princeton NJ Real Estate Market October 2012Greater Princeton NJ Real Estate Market October 2012
Greater Princeton NJ Real Estate Market October 2012
 
July 2013's Monthly Indicators report - Boston Real Estate Market Trends
July 2013's Monthly Indicators report - Boston Real Estate Market TrendsJuly 2013's Monthly Indicators report - Boston Real Estate Market Trends
July 2013's Monthly Indicators report - Boston Real Estate Market Trends
 
January 2014 Greater Boston Real Estate Market Trends Report
January 2014 Greater Boston Real Estate Market Trends ReportJanuary 2014 Greater Boston Real Estate Market Trends Report
January 2014 Greater Boston Real Estate Market Trends Report
 
San francisco market focus 2018 overview
San francisco market focus 2018 overviewSan francisco market focus 2018 overview
San francisco market focus 2018 overview
 

Mehr von Unit Realty Group

January 2015′s Monthly Multi-family Housing Activity Report
January 2015′s Monthly Multi-family Housing Activity ReportJanuary 2015′s Monthly Multi-family Housing Activity Report
January 2015′s Monthly Multi-family Housing Activity Report
Unit Realty Group
 
November 2014 Multi-family Housing Activity Report – Boston, MA Real Estate
November 2014 Multi-family Housing Activity Report – Boston, MA Real EstateNovember 2014 Multi-family Housing Activity Report – Boston, MA Real Estate
November 2014 Multi-family Housing Activity Report – Boston, MA Real Estate
Unit Realty Group
 
October 2014 Greater Boston Real Estate Market Trends Report
October 2014 Greater Boston Real Estate Market Trends ReportOctober 2014 Greater Boston Real Estate Market Trends Report
October 2014 Greater Boston Real Estate Market Trends Report
Unit Realty Group
 

Mehr von Unit Realty Group (20)

December 2015 multi family housing activity report – boston, ma real estate
December 2015 multi family housing activity report – boston, ma real estateDecember 2015 multi family housing activity report – boston, ma real estate
December 2015 multi family housing activity report – boston, ma real estate
 
October 2015 Greater Boston Real Estate Market Trends Report
October 2015 Greater Boston Real Estate Market Trends ReportOctober 2015 Greater Boston Real Estate Market Trends Report
October 2015 Greater Boston Real Estate Market Trends Report
 
September 2015 Greater Boston Real Estate Market Trends Report
September 2015 Greater Boston Real Estate Market Trends ReportSeptember 2015 Greater Boston Real Estate Market Trends Report
September 2015 Greater Boston Real Estate Market Trends Report
 
August 2015 Greater Boston Real Estate Market Trends Report
August 2015 Greater Boston Real Estate Market Trends ReportAugust 2015 Greater Boston Real Estate Market Trends Report
August 2015 Greater Boston Real Estate Market Trends Report
 
February 2015 Greater Boston Real Estate Market Trends Report
February 2015 Greater Boston Real Estate Market Trends ReportFebruary 2015 Greater Boston Real Estate Market Trends Report
February 2015 Greater Boston Real Estate Market Trends Report
 
January 2015′s Monthly Multi-family Housing Activity Report
January 2015′s Monthly Multi-family Housing Activity ReportJanuary 2015′s Monthly Multi-family Housing Activity Report
January 2015′s Monthly Multi-family Housing Activity Report
 
January 2015 Greater Boston Real Estate Market Trends Report
January 2015 Greater Boston Real Estate Market Trends ReportJanuary 2015 Greater Boston Real Estate Market Trends Report
January 2015 Greater Boston Real Estate Market Trends Report
 
December 2014 Greater Boston Real Estate Market Trends Report
December 2014 Greater Boston Real Estate Market Trends ReportDecember 2014 Greater Boston Real Estate Market Trends Report
December 2014 Greater Boston Real Estate Market Trends Report
 
November 2014 Greater Boston Real Estate Market Trends Report
November 2014 Greater Boston Real Estate Market Trends ReportNovember 2014 Greater Boston Real Estate Market Trends Report
November 2014 Greater Boston Real Estate Market Trends Report
 
November 2014 Multi-family Housing Activity Report – Boston, MA Real Estate
November 2014 Multi-family Housing Activity Report – Boston, MA Real EstateNovember 2014 Multi-family Housing Activity Report – Boston, MA Real Estate
November 2014 Multi-family Housing Activity Report – Boston, MA Real Estate
 
October 2014 Greater Boston Real Estate Market Trends Report
October 2014 Greater Boston Real Estate Market Trends ReportOctober 2014 Greater Boston Real Estate Market Trends Report
October 2014 Greater Boston Real Estate Market Trends Report
 
September 2014 Multi-family Housing Activity Report – Boston, MA Real Estate
September 2014 Multi-family Housing Activity Report – Boston, MA Real EstateSeptember 2014 Multi-family Housing Activity Report – Boston, MA Real Estate
September 2014 Multi-family Housing Activity Report – Boston, MA Real Estate
 
Boston By The Numbers - Boston Housing Stock (Report)
Boston By The Numbers - Boston Housing Stock (Report)Boston By The Numbers - Boston Housing Stock (Report)
Boston By The Numbers - Boston Housing Stock (Report)
 
May 2014 Multi-family Housing Activity Report – Boston, MA Real Estate
May 2014 Multi-family Housing Activity Report – Boston, MA Real EstateMay 2014 Multi-family Housing Activity Report – Boston, MA Real Estate
May 2014 Multi-family Housing Activity Report – Boston, MA Real Estate
 
November 2013 Multi-family Housing Activity Report – Boston, MA Real Estate
November 2013 Multi-family Housing Activity Report – Boston, MA Real EstateNovember 2013 Multi-family Housing Activity Report – Boston, MA Real Estate
November 2013 Multi-family Housing Activity Report – Boston, MA Real Estate
 
October 2013 Multi-family Housing Activity Report – Boston, MA Real Estate
October 2013 Multi-family Housing Activity Report – Boston, MA Real EstateOctober 2013 Multi-family Housing Activity Report – Boston, MA Real Estate
October 2013 Multi-family Housing Activity Report – Boston, MA Real Estate
 
July 2013 Multifamily Housing Activity Report – Boston, MA Real Estate
July 2013 Multifamily Housing Activity Report – Boston, MA Real EstateJuly 2013 Multifamily Housing Activity Report – Boston, MA Real Estate
July 2013 Multifamily Housing Activity Report – Boston, MA Real Estate
 
June 2013's Monthly Indicators report - Boston Real Estate Market Trends
June 2013's Monthly Indicators report - Boston Real Estate Market TrendsJune 2013's Monthly Indicators report - Boston Real Estate Market Trends
June 2013's Monthly Indicators report - Boston Real Estate Market Trends
 
May 2013's Monthly Indicators report - Boston Real Estate Market Trends
May 2013's Monthly Indicators report - Boston Real Estate Market Trends May 2013's Monthly Indicators report - Boston Real Estate Market Trends
May 2013's Monthly Indicators report - Boston Real Estate Market Trends
 
April 2013's Monthly Indicators report - Boston Real Estate Market Trends
April 2013's Monthly Indicators report - Boston Real Estate Market TrendsApril 2013's Monthly Indicators report - Boston Real Estate Market Trends
April 2013's Monthly Indicators report - Boston Real Estate Market Trends
 

Kürzlich hochgeladen

Cheap Rate ✨➥9711108085▻✨Call Girls In Chandni Chowk (Delhi)
Cheap Rate ✨➥9711108085▻✨Call Girls In Chandni Chowk (Delhi)Cheap Rate ✨➥9711108085▻✨Call Girls In Chandni Chowk (Delhi)
Cheap Rate ✨➥9711108085▻✨Call Girls In Chandni Chowk (Delhi)
delhi24hrs1
 
9990771857 Call Girls in Dwarka Sector 08 Delhi (Call Girls) Delhi
9990771857 Call Girls in Dwarka Sector 08 Delhi (Call Girls) Delhi9990771857 Call Girls in Dwarka Sector 08 Delhi (Call Girls) Delhi
9990771857 Call Girls in Dwarka Sector 08 Delhi (Call Girls) Delhi
delhimodel235
 
Acibadem Konaklari Uskudar - Listin Turkey
Acibadem Konaklari Uskudar - Listin TurkeyAcibadem Konaklari Uskudar - Listin Turkey
Acibadem Konaklari Uskudar - Listin Turkey
Listing Turkey
 
9990771857 Call Girls in Dwarka Sector 10 Delhi (Call Girls) Delhi
9990771857 Call Girls in Dwarka Sector 10 Delhi (Call Girls) Delhi9990771857 Call Girls in Dwarka Sector 10 Delhi (Call Girls) Delhi
9990771857 Call Girls in Dwarka Sector 10 Delhi (Call Girls) Delhi
delhimodel235
 
9990771857 Call Girls in Dwarka Sector 1 Delhi (Call Girls) Delhi
9990771857 Call Girls in Dwarka Sector 1 Delhi (Call Girls) Delhi9990771857 Call Girls in Dwarka Sector 1 Delhi (Call Girls) Delhi
9990771857 Call Girls in Dwarka Sector 1 Delhi (Call Girls) Delhi
delhimodel235
 
Goa Call Girls 8617370543 Call Girls In Goa By Russian Call Girl in goa
Goa Call Girls 8617370543 Call Girls In Goa By Russian Call Girl in goaGoa Call Girls 8617370543 Call Girls In Goa By Russian Call Girl in goa
Goa Call Girls 8617370543 Call Girls In Goa By Russian Call Girl in goa
Nitya salvi
 
9990771857 Call Girls in Dwarka Sector 07 Delhi (Call Girls) Delhi
9990771857 Call Girls in Dwarka Sector 07 Delhi (Call Girls) Delhi9990771857 Call Girls in Dwarka Sector 07 Delhi (Call Girls) Delhi
9990771857 Call Girls in Dwarka Sector 07 Delhi (Call Girls) Delhi
delhimodel235
 
Cheap Rate ✨➥9711108085▻✨Call Girls In Amar Colony (Delhi)
Cheap Rate ✨➥9711108085▻✨Call Girls In Amar Colony (Delhi)Cheap Rate ✨➥9711108085▻✨Call Girls In Amar Colony (Delhi)
Cheap Rate ✨➥9711108085▻✨Call Girls In Amar Colony (Delhi)
delhi24hrs1
 
Call Girls In Majnu Ka Tilla (Delhi) ꧁8447779280}@꧂ Escorts Service Delhi
Call Girls In Majnu Ka Tilla (Delhi) ꧁8447779280}@꧂ Escorts Service DelhiCall Girls In Majnu Ka Tilla (Delhi) ꧁8447779280}@꧂ Escorts Service Delhi
Call Girls In Majnu Ka Tilla (Delhi) ꧁8447779280}@꧂ Escorts Service Delhi
asmaqueen5
 

Kürzlich hochgeladen (20)

Rohan Harita Tathawade Pune Brochure.pdf
Rohan Harita Tathawade Pune Brochure.pdfRohan Harita Tathawade Pune Brochure.pdf
Rohan Harita Tathawade Pune Brochure.pdf
 
Cheap Rate ✨➥9711108085▻✨Call Girls In Chandni Chowk (Delhi)
Cheap Rate ✨➥9711108085▻✨Call Girls In Chandni Chowk (Delhi)Cheap Rate ✨➥9711108085▻✨Call Girls In Chandni Chowk (Delhi)
Cheap Rate ✨➥9711108085▻✨Call Girls In Chandni Chowk (Delhi)
 
Mahindra Happinest Tathawade Pune Brochure.pdf
Mahindra Happinest Tathawade Pune Brochure.pdfMahindra Happinest Tathawade Pune Brochure.pdf
Mahindra Happinest Tathawade Pune Brochure.pdf
 
9990771857 Call Girls in Dwarka Sector 08 Delhi (Call Girls) Delhi
9990771857 Call Girls in Dwarka Sector 08 Delhi (Call Girls) Delhi9990771857 Call Girls in Dwarka Sector 08 Delhi (Call Girls) Delhi
9990771857 Call Girls in Dwarka Sector 08 Delhi (Call Girls) Delhi
 
SVN Live 5.6.24 Weekly Property Broadcast
SVN Live 5.6.24 Weekly Property BroadcastSVN Live 5.6.24 Weekly Property Broadcast
SVN Live 5.6.24 Weekly Property Broadcast
 
Acibadem Konaklari Uskudar - Listin Turkey
Acibadem Konaklari Uskudar - Listin TurkeyAcibadem Konaklari Uskudar - Listin Turkey
Acibadem Konaklari Uskudar - Listin Turkey
 
Parksville 96 Surrey Floor Plans May 2024
Parksville 96 Surrey Floor Plans May 2024Parksville 96 Surrey Floor Plans May 2024
Parksville 96 Surrey Floor Plans May 2024
 
Sector 62, Noida Call girls :8448380779 Model Escorts | 100% verified
Sector 62, Noida Call girls :8448380779 Model Escorts | 100% verifiedSector 62, Noida Call girls :8448380779 Model Escorts | 100% verified
Sector 62, Noida Call girls :8448380779 Model Escorts | 100% verified
 
Kalpataru Exquisite Wakad Pune E-Brochure.pdf
Kalpataru Exquisite Wakad Pune  E-Brochure.pdfKalpataru Exquisite Wakad Pune  E-Brochure.pdf
Kalpataru Exquisite Wakad Pune E-Brochure.pdf
 
9990771857 Call Girls in Dwarka Sector 10 Delhi (Call Girls) Delhi
9990771857 Call Girls in Dwarka Sector 10 Delhi (Call Girls) Delhi9990771857 Call Girls in Dwarka Sector 10 Delhi (Call Girls) Delhi
9990771857 Call Girls in Dwarka Sector 10 Delhi (Call Girls) Delhi
 
9990771857 Call Girls in Dwarka Sector 1 Delhi (Call Girls) Delhi
9990771857 Call Girls in Dwarka Sector 1 Delhi (Call Girls) Delhi9990771857 Call Girls in Dwarka Sector 1 Delhi (Call Girls) Delhi
9990771857 Call Girls in Dwarka Sector 1 Delhi (Call Girls) Delhi
 
Goa Call Girls 8617370543 Call Girls In Goa By Russian Call Girl in goa
Goa Call Girls 8617370543 Call Girls In Goa By Russian Call Girl in goaGoa Call Girls 8617370543 Call Girls In Goa By Russian Call Girl in goa
Goa Call Girls 8617370543 Call Girls In Goa By Russian Call Girl in goa
 
Sector 62, Noida Call girls :8448380779 Noida Escorts | 100% verified
Sector 62, Noida Call girls :8448380779 Noida Escorts | 100% verifiedSector 62, Noida Call girls :8448380779 Noida Escorts | 100% verified
Sector 62, Noida Call girls :8448380779 Noida Escorts | 100% verified
 
Bridge & Elliot Ladner Floor Plans May 2024.pdf
Bridge & Elliot Ladner Floor Plans May 2024.pdfBridge & Elliot Ladner Floor Plans May 2024.pdf
Bridge & Elliot Ladner Floor Plans May 2024.pdf
 
9990771857 Call Girls in Dwarka Sector 07 Delhi (Call Girls) Delhi
9990771857 Call Girls in Dwarka Sector 07 Delhi (Call Girls) Delhi9990771857 Call Girls in Dwarka Sector 07 Delhi (Call Girls) Delhi
9990771857 Call Girls in Dwarka Sector 07 Delhi (Call Girls) Delhi
 
The Gale at Godrej Park World Hinjewadi Pune Brochure.pdf
The Gale at Godrej Park World Hinjewadi Pune Brochure.pdfThe Gale at Godrej Park World Hinjewadi Pune Brochure.pdf
The Gale at Godrej Park World Hinjewadi Pune Brochure.pdf
 
Kolte Patil Kharadi Pune E Brochure.pdf
Kolte Patil Kharadi Pune E  Brochure.pdfKolte Patil Kharadi Pune E  Brochure.pdf
Kolte Patil Kharadi Pune E Brochure.pdf
 
Dausa ❤CALL GIRL 8617370543 ❤CALL GIRLS IN Dausa ESCORT SERVICE❤CALL GIRL
Dausa ❤CALL GIRL 8617370543 ❤CALL GIRLS IN Dausa ESCORT SERVICE❤CALL GIRLDausa ❤CALL GIRL 8617370543 ❤CALL GIRLS IN Dausa ESCORT SERVICE❤CALL GIRL
Dausa ❤CALL GIRL 8617370543 ❤CALL GIRLS IN Dausa ESCORT SERVICE❤CALL GIRL
 
Cheap Rate ✨➥9711108085▻✨Call Girls In Amar Colony (Delhi)
Cheap Rate ✨➥9711108085▻✨Call Girls In Amar Colony (Delhi)Cheap Rate ✨➥9711108085▻✨Call Girls In Amar Colony (Delhi)
Cheap Rate ✨➥9711108085▻✨Call Girls In Amar Colony (Delhi)
 
Call Girls In Majnu Ka Tilla (Delhi) ꧁8447779280}@꧂ Escorts Service Delhi
Call Girls In Majnu Ka Tilla (Delhi) ꧁8447779280}@꧂ Escorts Service DelhiCall Girls In Majnu Ka Tilla (Delhi) ꧁8447779280}@꧂ Escorts Service Delhi
Call Girls In Majnu Ka Tilla (Delhi) ꧁8447779280}@꧂ Escorts Service Delhi
 

Greater Boston Real Estate Market Data, September 2012

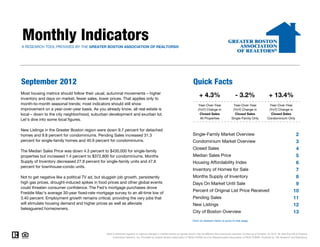
  • 1. Monthly Indicators A RESEARCH TOOL PROVIDED BY THE GREATER BOSTON ASSOCIATION OF REALTORS® September 2012 Quick Facts Most housing metrics should follow their usual, autumnal movements – higher inventory and days on market, fewer sales, lower prices. That applies only to + 4.3% - 3.2% + 13.4% month-to-month seasonal trends; most indicators should still show Year-Over-Year Year-Over-Year Year-Over-Year improvement on a year-over-year basis. As you already know, all real estate is (YoY) Change in (YoY) Change in (YoY) Change in local – down to the city neighborhood, suburban development and exurban lot. Closed Sales Closed Sales Closed Sales Let's dive into some local figures. All Properties Single-Family Only Condominium Only New Listings in the Greater Boston region were down 9.7 percent for detached homes and 9.8 percent for condominiums. Pending Sales increased 31.3 Single-Family Market Overview 2 percent for single-family homes and 40.9 percent for condominiums. Condominium Market Overview 3 Closed Sales 4 The Median Sales Price was down 4.3 percent to $430,000 for single-family properties but increased 1.4 percent to $372,800 for condominiums. Months Median Sales Price 5 Supply of Inventory decreased 27.8 percent for single-family units and 47.6 Housing Affordability Index 6 percent for townhouse-condo units. Inventory of Homes for Sale 7 Not to get negative like a political TV ad, but sluggish job growth, persistently Months Supply of Inventory 8 high gas prices, drought-induced spikes in food prices and other global events Days On Market Until Sale 9 could threaten consumer confidence. The Fed's mortgage purchases drove Freddie Mac's average 30-year fixed-rate mortgage survey to an all-time low of Percent of Original List Price Received 10 3.40 percent. Employment growth remains critical, providing the very jobs that Pending Sales 11 will stimulate housing demand and higher prices as well as alleviate New Listings 12 beleaguered homeowners. City of Boston Overview 13 Click on desired metric to jump to that page. Data is refreshed regularly to capture changes in market activity so figures shown may be different than previously reported. Current as of October 16, 2012. All data from MLS Property Information Network, Inc. Provided by Greater Boston Association of REALTORS® and the Massachusetts Association of REALTORS®. Powered by 10K Research and Marketing.
  • 2. Single-Family Market Overview Key market metrics for the current month and year-to-date figures for Single-Family Homes Only. Key Metrics Historical Sparklines Sep-2011 Sep-2012 +/– YTD 2011 YTD 2012 +/– Closed Sales 784 759 - 3.2% 7,015 8,318 + 18.6% 9-2009 9-2010 9-2011 9-2012 Median Sales Price $449,500 $430,000 - 4.3% $464,000 $461,000 - 0.6% 9-2009 9-2010 9-2011 9-2012 Housing Affordability Index 101 116 + 15.2% 98 109 + 11.6% 9-2009 9-2010 9-2011 9-2012 Inventory of Homes for Sale 5,638 3,943 - 30.1% -- -- -- 9-2009 9 2009 9-2010 9 2010 9-2011 9 2011 9-2012 9 2012 Months Supply of Inventory 7.2 5.2 - 27.8% -- -- -- 9-2009 9-2010 9-2011 9-2012 Days on Market Until Sale 101 88 - 13.2% 103 100 - 2.9% 9-2009 9-2010 9-2011 9-2012 Percent of Original 93.2% 94.6% + 1.5% 93.4% 94.4% + 1.1% List Price Received 9-2009 9-2010 9-2011 9-2012 Pending Sales 665 873 + 31.3% 7,186 8,837 + 23.0% 9-2009 9-2010 9-2011 9-2012 New Listings 1,590 1,436 - 9.7% 13,086 12,812 - 2.1% 9-2009 9-2010 9-2011 9-2012 All data from MLS Property Information Network, Inc. Provided by the Greater Boston Association of REALTORS® and the Massachusetts Association of REALTORS®. Powered by 10K Research and Marketing. | Click for Cover Page | 2
  • 3. Condominium Market Overview Key market metrics for the current month and year-to-date figures for Condominium Properties Only. Key Metrics Historical Sparklines Sep-2011 Sep-2012 +/– YTD 2011 YTD 2012 +/– Closed Sales 648 735 + 13.4% 6,220 7,417 + 19.2% 9-2009 9-2010 9-2011 9-2012 Median Sales Price $367,500 $372,800 + 1.4% $360,000 $379,000 + 5.3% 9-2009 9-2010 9-2011 9-2012 Housing Affordability Index 121 132 + 9.1% 123 130 + 5.7% 9-2009 9-2010 9-2011 9-2012 Inventory of Homes for Sale 4,322 2,568 - 40.6% -- -- -- 9-2009 9 2009 9-2010 9 2010 9-2011 9 2011 9-2012 9 2012 Months Supply of Inventory 6.7 3.5 - 47.6% -- -- -- 9-2009 9-2010 9-2011 9-2012 Days on Market Until Sale 103 85 - 17.7% 104 88 - 15.3% 9-2009 9-2010 9-2011 9-2012 Percent of Original 94.2% 96.4% + 2.4% 94.1% 95.7% + 1.7% List Price Received 9-2009 9-2010 9-2011 9-2012 Pending Sales 518 730 + 40.9% 6,344 7,910 + 24.7% 9-2009 9-2010 9-2011 9-2012 New Listings 1,281 1,155 - 9.8% 11,730 10,743 - 8.4% 9-2009 9-2010 9-2011 9-2012 All data from MLS Property Information Network, Inc. Provided by the Greater Boston Association of REALTORS® and the Massachusetts Association of REALTORS®. Powered by 10K Research and Marketing. | Click for Cover Page | 3
  • 4. Closed Sales A count of the actual sales that have closed in a given month. September Year to Date Single-Family YoY Change Condominium YoY Change Oct-2011 619 + 6.0% 513 + 6.4% 8,318 784 Nov-2011 690 + 8.8% 562 + 11.1% 759 735 7,417 7,195 7,015 Dec-2011 745 + 1.2% 644 - 1.7% 672 648 6,663 6,220 Jan-2012 526 + 12.6% 413 + 2.7% 577 Feb-2012 474 + 33.5% 385 + 12.2% Mar-2012 656 + 16.3% 608 + 10.9% Apr-2012 752 + 12.1% 757 + 19.6% May-2012 1,017 + 20.4% 1,013 + 32.1% Jun-2012 1,529 + 21.4% 1,268 + 20.0% Jul-2012 1,291 + 25.2% 1,038 + 21.4% Aug-2012 1,314 + 26.5% 1,200 + 24.1% 2010 2011 2012 2010 2011 2012 2010 2011 2012 2010 2011 2012 Sep-2012 759 - 3.2% 735 + 13.4% +16.7% -3.2% +12.3% +13.4% -2.5% +18.6% -6.6% +19.2% Total 10,372 + 15.6% 9,136 + 16.2% Single-Family Condominium Single-Family Condominium Historical Closed Sales Activity Single-Family Condominium 1,800 1,600 1,400 1,200 1,000 800 600 400 200 Jan-2003 Jan-2004 Jan-2005 Jan-2006 Jan-2007 Jan-2008 Jan-2009 Jan-2010 Jan-2011 Jan-2012 All data from MLS Property Information Network, Inc. Provided by the Greater Boston Association of REALTORS® and the Massachusetts Association of REALTORS®. Powered by 10K Research and Marketing. | Click for Cover Page | 4
  • 5. Median Sales Price Median price point for all closed sales, not accounting for seller concessions, in a given month. September Year to Date Single-Family YoY Change Condominium YoY Change Oct-2011 $390,000 - 11.6% $349,000 + 4.8% $464,000 $461,000 $440,000 $449,500 $454,000 Nov-2011 $423,000 - 4.6% $350,500 - 7.3% $430,000 Dec-2011 $440,000 + 1.1% $344,750 - 2.9% $379,000 $367,500 $372,800 $355,000 $347,500 $360,000 Jan-2012 $405,000 - 9.0% $349,950 - 1.7% Feb-2012 $391,875 + 3.4% $371,000 + 6.6% Mar-2012 $412,500 - 0.9% $340,000 + 4.8% Apr-2012 $414,850 - 3.3% $370,750 + 5.6% May-2012 $465,000 + 1.3% $381,000 + 4.4% Jun-2012 $500,000 - 0.2% $400,000 + 6.7% Jul-2012 $510,000 + 2.2% $387,000 + 6.3% Aug-2012 $489,450 - 1.9% $380,000 + 3.5% 2010 2011 2012 2010 2011 2012 2010 2011 2012 2010 2011 2012 Sep-2012 $430,000 - 4.3% $372,800 + 1.4% +2.2% -4.3% +3.5% +1.4% +2.2% -0.6% +3.6% +5.3% Median $450,000 - 1.7% $373,000 + 3.6% Single-Family Condominium Single-Family Condominium Historical Median Sales Price Single-Family Condominium $550,000 $500,000 $450,000 $400,000 $350,000 $300,000 $250,000 Jan-2003 Jan-2004 Jan-2005 Jan-2006 Jan-2007 Jan-2008 Jan-2009 Jan-2010 Jan-2011 Jan-2012 All data from MLS Property Information Network, Inc. Provided by the Greater Boston Association of REALTORS® and the Massachusetts Association of REALTORS®. Powered by 10K Research and Marketing. | Click for Cover Page | 5
  • 6. Housing Affordability Index This index measures housing affordability for the region. An index of 120 means the median household income was 120% of what is necessary to qualify for the median-priced home under prevailing interest rates. A higher number means greater affordability. September Year to Date Single-Family YoY Change Condominium YoY Change 132 130 Oct-2011 116 + 19.3% 128 + 2.2% 120 121 122 123 116 Nov-2011 108 + 10.0% 128 + 12.8% 109 101 Dec-2011 104 + 5.9% 130 + 9.8% 99 96 98 Jan-2012 113 + 17.4% 129 + 9.3% Feb-2012 119 + 7.9% 125 + 4.9% Mar-2012 113 + 11.2% 135 + 5.6% Apr-2012 112 + 13.1% 124 + 4.3% May-2012 102 + 7.2% 122 + 4.2% Jun-2012 97 + 8.5% 118 + 1.9% Jul-2012 96 + 7.9% 124 + 3.9% Aug-2012 100 + 11.0% 127 + 5.5% 2010 2011 2012 2010 2011 2012 2010 2011 2012 2010 2011 2012 Sep-2012 116 + 15.2% 132 + 9.1% +1.9% +15.2% +0.7% +9.1% +1.8% +11.6% +0.7% +5.7% Average 108 +11.2% 127 +6.1% Single-Family Condominium Single-Family Condominium Historical Housing Affordability Index Single-Family Condominium 140 130 120 110 100 90 80 70 60 Jan-2004 Jan-2005 Jan-2006 Jan-2007 Jan-2008 Jan-2009 Jan-2010 Jan-2011 Jan-2012 All data from MLS Property Information Network, Inc. Provided by the Greater Boston Association of REALTORS® and the Massachusetts Association of REALTORS®. Powered by 10K Research and Marketing. | Click for Cover Page | 6
  • 7. Inventory of Homes for Sale The number of properties available for sale in active status at the end of a given month. September Single-Family YoY Change Condominium YoY Change Oct-2011 5,415 - 0.1% 4,094 - 20.9% 5,602 5,638 5,334 Nov-2011 4,598 - 3.4% 3,588 - 21.0% Dec-2011 3,651 - 3.0% 2,803 - 20.9% 4,322 Jan-2012 3,685 - 2.9% 2,962 - 19.5% 3,943 Feb-2012 4,074 + 6.2% 3,251 - 17.0% Mar-2012 4,687 + 1.3% 3,676 - 21.6% 2,568 Apr-2012 5,026 - 5.5% 3,823 - 26.2% May-2012 5,111 - 10.8% 3,620 - 30.7% Jun-2012 4,755 - 16.9% 3,308 - 35.1% Jul-2012 4,273 - 23.6% 2,990 - 36.6% Aug-2012 3,827 - 28.7% 2,525 - 40.1% 2010 2011 2012 2010 2011 2012 Sep-2012 3,943 - 30.1% 2,568 - 40.6% +0.6% 30 1% -30.1% -19.0% -40.6% Average 4,420 - 10.9% 3,267 - 27.8% Single-Family Condominium Historical Inventory of Homes for Sale Single-Family Condominium 9,000 8,000 7,000 6,000 5,000 4,000 3,000 2,000 Jan-2003 Jan-2004 Jan-2005 Jan-2006 Jan-2007 Jan-2008 Jan-2009 Jan-2010 Jan-2011 Jan-2012 All data from MLS Property Information Network, Inc. Provided by the Greater Boston Association of REALTORS® and the Massachusetts Association of REALTORS®. Powered by 10K Research and Marketing. | Click for Cover Page | 7
  • 8. Months Supply of Inventory The inventory of homes for sale at the end of a given month, divided by the average monthly pending sales from the last 12 months. September Single-Family YoY Change Condominium YoY Change 9.2 Oct-2011 8.7 - 5.7% 8.0 - 25.7% 8.3 Nov-2011 6.7 - 11.2% 6.4 - 28.9% 7.2 Dec-2011 4.9 - 4.2% 4.4 - 19.6% 6.7 Jan-2012 7.0 - 13.8% 7.2 - 21.7% Feb-2012 8.6 - 20.5% 8.4 - 26.0% 5.2 Mar-2012 7.1 - 12.9% 6.0 - 29.3% Apr-2012 6.7 - 15.6% 5.1 - 38.3% 3.5 May-2012 5.0 - 25.9% 3.6 - 47.5% Jun-2012 3.1 - 31.6% 2.6 - 45.9% Jul-2012 3.3 - 39.0% 2.9 - 47.8% Aug-2012 2.9 - 43.6% 2.1 - 51.7% 2010 2011 2012 2010 2011 2012 Sep-2012 5.2 - 27.8% 3.5 - 47.6% -13.7% -27.8% -27.9% -47.6% Average 5.6 - 16.0% 4.7 - 30.4% Single-Family Condominium Historical Months Supply of Inventory Single-Family Condominium 14 12 10 8 6 4 2 Jan-2004 Jan-2005 Jan-2006 Jan-2007 Jan-2008 Jan-2009 Jan-2010 Jan-2011 Jan-2012 All data from MLS Property Information Network, Inc. Provided by the Greater Boston Association of REALTORS® and the Massachusetts Association of REALTORS®. Powered by 10K Research and Marketing. | Click for Cover Page | 8
  • 9. Days on Market Until Sale Average number of days between when a property is listed and when an offer is accepted in a given month. September Year to Date Single-Family YoY Change Condominium YoY Change Oct-2011 108 + 3.7% 95 - 14.8% 107 104 Nov-2011 110 + 4.1% 109 + 7.7% 101 103 103 101 99 100 Dec-2011 112 - 0.3% 120 + 12.0% 92 88 85 88 Jan-2012 130 + 15.0% 124 - 5.1% Feb-2012 134 + 2.9% 123 - 9.8% Mar-2012 130 - 3.5% 118 - 4.2% Apr-2012 120 - 1.4% 98 - 16.3% May-2012 96 - 6.4% 86 - 12.0% Jun-2012 90 - 0.1% 75 - 19.5% Jul-2012 81 - 4.4% 71 - 20.7% Aug-2012 88 - 5.4% 76 - 18.4% 2010 2011 2012 2010 2011 2012 2010 2011 2012 2010 2011 2012 Sep-2012 88 - 13.2% 85 - 17.7% +2.8% -13.2% -3.5% -17.7% +11.8% -2.9% +3.4% -15.3% Total 102 - 1.9% 85 - 10.5% Single-Family Condominium Single-Family Condominium Historical Days on Market Until Sale Single-Family Condominium 160 140 120 100 80 60 40 Jan-2003 Jan-2004 Jan-2005 Jan-2006 Jan-2007 Jan-2008 Jan-2009 Jan-2010 Jan-2011 Jan-2012 All data from MLS Property Information Network, Inc. Provided by the Greater Boston Association of REALTORS® and the Massachusetts Association of REALTORS®. Powered by 10K Research and Marketing. | Click for Cover Page | 9
  • 10. Percent of Original List Price Received Percentage found when dividing a property’s sales price by its original list price, then taking the average for all properties sold in a given month, not accounting for seller concessions. September Year to Date Single-Family YoY Change Condominium YoY Change Oct-2011 91.8% - 0.4% 93.6% + 0.1% Nov-2011 92.4% - 0.3% 93.8% - 0.2% 96.4% 94.6% 94.1% 95.7% Dec-2011 92.2% + 1.0% 93.0% + 0.1% 92.9% 93.2% 94.6% 92.7% 94.2% 94.1% 93.4% 94.4% Jan-2012 90.5% - 0.4% 92.8% + 0.5% Feb-2012 91.2% + 0.3% 93.4% + 1.5% Mar-2012 93.0% + 0.8% 94.0% + 0.9% Apr-2012 93.5% + 0.9% 95.7% + 2.0% May-2012 95.4% + 1.2% 96.1% + 1.0% Jun-2012 95.3% + 0.8% 96.3% + 1.7% Jul-2012 95.7% + 1.5% 96.6% + 1.7% Aug-2012 94.8% + 1.5% 96.3% + 2.2% 2010 2011 2012 2010 2011 2012 2010 2011 2012 2010 2011 2012 Sep-2012 94.6% + 1.5% 96.4% + 2.4% +0.3% +1.5% +1.6% +2.4% -0.7% +1.1% -0.5% +1.7% Average 93.9% + 0.9% 95.3% + 1.4% Single-Family Condominium Single-Family Condominium Historical Percent of Original List Price Received Single-Family Condominium 99% 98% 97% 96% 95% 94% 93% 92% 91% 90% 89% Jan-2003 Jan-2004 Jan-2005 Jan-2006 Jan-2007 Jan-2008 Jan-2009 Jan-2010 Jan-2011 Jan-2012 All data from MLS Property Information Network, Inc. Provided by the Greater Boston Association of REALTORS® and the Massachusetts Association of REALTORS®. Powered by 10K Research and Marketing. | Click for Cover Page | 10
  • 11. Pending Sales A count of the properties in UAG status between the first and last day in a given month, regardless of current status (based on Off Market Date). September Year to Date Single-Family YoY Change Condominium YoY Change Oct-2011 744 + 3.0% 594 + 7.2% 873 8,837 Nov-2011 684 + 16.7% 564 - 2.1% 7,910 Dec-2011 571 + 5.4% 471 + 6.3% 730 7,283 7,186 Jan-2012 546 + 26.7% 484 + 18.6% 665 6,629 6,344 616 Feb-2012 651 + 23.1% 636 + 24.2% 518 Mar-2012 1,000 + 25.3% 1,016 + 32.8% 499 Apr-2012 1,153 + 21.6% 1,049 + 24.3% May-2012 1,342 + 23.3% 1,272 + 29.0% Jun-2012 1,276 + 14.0% 1,052 + 20.0% Jul-2012 1,059 + 26.8% 847 + 10.9% Aug-2012 937 + 21.2% 824 + 23.0% 2010 2011 2012 2010 2011 2012 2010 2011 2012 2010 2011 2012 Sep-2012 873 + 31.3% 730 + 40.9% +8.0% +31.3% +3.8% +40.9% -1.3% +23.0% -4.3% +24.7% Total 10,836 + 19.9% 9,539 + 20.5% Single-Family Condominium Single-Family Condominium Historical Pending Sales Activity Single-Family Condominium 1,400 1,200 1,000 800 600 400 200 Jan-2003 Jan-2004 Jan-2005 Jan-2006 Jan-2007 Jan-2008 Jan-2009 Jan-2010 Jan-2011 Jan-2012 All data from MLS Property Information Network, Inc. Provided by the Greater Boston Association of REALTORS® and the Massachusetts Association of REALTORS®. Powered by 10K Research and Marketing. | Click for Cover Page | 11
  • 12. New Listings A count of the properties that have been newly listed on the market in a given month. September Year to Date Single-Family YoY Change Condominium YoY Change Oct-2011 1,159 - 2.3% 902 - 19.8% 1,692 1,590 1,621 Nov-2011 682 - 8.6% 628 - 11.8% 13,494 13,086 13,611 1,436 12,812 Dec-2011 459 + 6.0% 389 - 20.4% 1,281 11,730 Jan-2012 974 + 14.3% 958 - 1.8% 1,155 10,743 Feb-2012 1,336 + 51.3% 1,145 + 5.8% Mar-2012 2,023 + 3.1% 1,741 - 12.0% Apr-2012 1,811 - 9.3% 1,503 - 13.1% May-2012 1,810 - 4.1% 1,391 - 7.5% Jun-2012 1,372 - 15.1% 1,155 - 14.1% Jul-2012 1,036 - 13.1% 905 - 7.6% Aug-2012 1,014 - 8.3% 790 - 7.6% 2010 2011 2012 2010 2011 2012 2010 2011 2012 2010 2011 2012 Sep-2012 1,436 - 9.7% 1,155 - 9.8% -6.0% -9.7% -21.0% -9.8% -3.0% -2.1% -13.8% -8.4% Total 15,112 - 2.2% 12,662 - 9.9% Single-Family Condominium Single-Family Condominium Historical New Listing Activity Single-Family Condominium 2,750 2,500 2,250 2,000 1,750 1,500 1,250 1,000 750 500 250 Jan-2003 Jan-2004 Jan-2005 Jan-2006 Jan-2007 Jan-2008 Jan-2009 Jan-2010 Jan-2011 Jan-2012 All data from MLS Property Information Network, Inc. Provided by the Greater Boston Association of REALTORS® and the Massachusetts Association of REALTORS®. Powered by 10K Research and Marketing. | Click for Cover Page | 12
  • 13. City of Boston – Market Overview Key market metrics for the current month and year-to-date figures for the City of Boston. Key Metrics Historical Sparklines Sep-2011 Sep-2012 +/– YTD 2011 YTD 2012 +/– Closed Sales 354 389 + 9.9% 3,423 4,179 + 22.1% 9-2009 9-2010 9-2011 9-2012 Median Sales Price $391,250 $389,000 - 0.6% $375,000 $400,000 + 6.7% 9-2009 9-2010 9-2011 9-2012 Housing Affordability Index 101 116 + 15.2% 98 109 + 11.6% 9-2009 9-2010 9-2011 9-2012 Inventory of Homes for Sale 2,334 1,280 - 45.2% -- -- -- 9-2009 9 2009 9-2010 9 2010 9-2011 9 2011 9-2012 9 2012 Months Supply of Inventory 6.6 3.3 - 50.1% -- -- -- 9-2009 9-2010 9-2011 9-2012 Days on Market Until Sale 95 74 - 21.9% 100 85 - 15.1% 9-2009 9-2010 9-2011 9-2012 Percent of Original 94.6% 96.1% + 1.7% 93.9% 95.6% + 1.7% List Price Received 9-2009 9-2010 9-2011 9-2012 Pending Sales 284 412 + 45.1% 3,507 4,419 + 26.0% 9-2009 9-2010 9-2011 9-2012 New Listings 739 639 - 13.5% 6,624 6,040 - 8.8% 9-2009 9-2010 9-2011 9-2012 All data from MLS Property Information Network, Inc. Provided by the Greater Boston Association of REALTORS® and the Massachusetts Association of REALTORS®. Powered by 10K Research and Marketing. | Click for Cover Page | 13