December 2015 Multi-family Housing Activity Report – Boston, MA Real Estate
•
0 likes•340 views

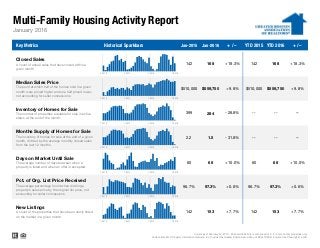
Here’s January 2016′s Monthly Multi-family Housing Activity Report from the Greater Boston Association of Realtors®. (Multi-family housing activity comparing January 2016 to January 2015) • Closed sales were UP +18.3% to 168 • Median prices were UP +9.8% ($559,750) • Inventory of homes for sale were DOWN -28.8% (284) • Months supply of home for sale were DOWN -31.8% (1.5) • Days on market until sale were UP +10.0% (66) • Percentage of original list price received were DOWN -0.6% (97.3%) • New Listings were UP +7.7% (153)

Recommended
More Related Content
More from Unit Realty Group
More from Unit Realty Group (20)
December 2015 Multi-family Housing Activity Report – Boston, MA Real Estate
- 1. Multi-Family Housing Activity Report Key Metrics Historical Sparkbars Jan-2015 Jan-2016 + / – YTD 2015 YTD 2016 + / – + 7.7% Current as of February 16, 2016.. Multi-family activity is comprised of 2-, 3- and 4-family properties only. All data from MLS Property Information Network, Inc. Provided by Greater Boston Association of REALTORS®. Powered by ShowingTime 10K. New Listings A count of the properties that have been newly listed on the market in a given month. 142 153 + 7.7% 142 153 + 10.0% Pct. of Org. List Price Received The average percentage found when dividing a property's sales price by the original list price, not accounting for seller concessions. 96.7% 97.3% + 0.6% 96.7% 97.3% + 0.6% Days on Market Until Sale The average number of days between when a property is listed and when an offer is accepted. 60 66 + 10.0% 60 66 -- Months Supply of Homes for Sale The inventory of homes for sale at the end of a given month, divided by the average monthly closed sales from the last 12 months. 2.2 1.5 - 31.8% -- -- -- Inventory of Homes for Sale The number of properties available for sale in active status at the end of the month. 399 284 - 28.8% -- -- 168 + 18.3% Median Sales Price The point at which half of the homes sold in a given month were priced higher and one half priced lower, not accounting for seller concessions. $510,000 $559,750 + 9.8% $510,000 $559,750 + 9.8% 142 January 2016 Closed Sales A count of actual sales that have closed within a given month. 142 168 + 18.3% 1-2013 1-2014 1-2015 1-2016 1-2013 1-2014 1-2015 1-2016 1-2013 1-2014 1-2015 1-2016 1-2013 1-2014 1-2015 1-2016 1-2013 1-2014 1-2015 1-2016 1-2013 1-2014 1-2015 1-2016 1-2013 1-2014 1-2015 1-2016
- 2. Multi-Family Housing Activity Report – 2-Family Properties 1-2015 1-2016 + / – 1-2015 1-2016 + / – 1-2015 1-2016 + / – 1-2015 1-2016 + / – Acton 0 0 -- -- -- -- -- -- -- 0 0 -- Arlington 2 2 0.0% $652,250 $761,000 + 16.7% 9 47 + 422.2% 2 0 - 100.0% Ashland 0 0 -- -- -- -- -- -- -- 2 2 0.0% Attleboro 0 1 -- -- $154,000 -- -- 33 -- 9 5 - 44.4% Avon 0 0 -- -- -- -- -- -- -- 1 2 + 100.0% Bedford 0 0 -- -- -- -- -- -- -- 0 0 -- Bellingham 0 2 -- -- $172,500 -- -- 427 -- 2 1 - 50.0% Belmont 2 1 - 50.0% $860,000 $850,000 - 1.2% 63 40 - 36.5% 2 1 - 50.0% Billerica 0 0 -- -- -- -- -- -- -- 1 1 0.0% Boston 28 22 - 21.4% $415,400 $526,000 + 26.6% 64 61 - 4.7% 87 59 - 32.2% Boxborough 0 0 -- -- -- -- -- -- -- 0 0 -- Brookline 0 0 -- -- -- -- -- -- -- 1 3 + 200.0% Burlington 0 0 -- -- -- -- -- -- -- 1 0 - 100.0% Cambridge 5 5 0.0% $1,150,000 $840,000 - 27.0% 37 57 + 54.1% 2 5 + 150.0% Canton 0 0 -- -- -- -- -- -- -- 2 1 - 50.0% Carlisle 0 0 -- -- -- -- -- -- -- 0 1 -- Chelsea 3 5 + 66.7% $374,500 $428,000 + 14.3% 51 58 + 13.7% 5 11 + 120.0% Concord 0 0 -- -- -- -- -- -- -- 0 1 -- Dedham 0 3 -- -- $360,000 -- -- 66 -- 4 2 - 50.0% Dover 0 0 -- -- -- -- -- -- -- 0 0 -- Everett 4 6 + 50.0% $355,000 $498,000 + 40.3% 21 65 + 209.5% 20 8 - 60.0% Foxborough 0 0 -- -- -- -- -- -- -- 1 2 + 100.0% Framingham 3 1 - 66.7% $345,000 $240,000 - 30.4% 65 92 + 41.5% 4 7 + 75.0% Franklin 1 1 0.0% $310,000 $265,000 - 14.5% 107 133 + 24.3% 1 1 0.0% Holliston 0 1 -- -- $358,000 -- -- 323 -- 1 0 - 100.0% Hopkinton 0 1 -- -- $494,000 -- -- 84 -- 0 2 -- Hudson 1 0 - 100.0% $285,000 -- -- 28 -- -- 2 1 - 50.0% Lexington 0 0 -- -- -- -- -- -- -- 1 0 - 100.0% Lincoln 0 0 -- -- -- -- -- -- -- 0 0 -- Lynnfield 0 0 -- -- -- -- -- -- -- 0 0 -- Malden 3 9 + 200.0% $360,000 $463,000 + 28.6% 112 53 - 52.7% 11 4 - 63.6% Mansfield 2 0 - 100.0% $187,500 -- -- 317 -- -- 0 1 -- Marlborough 3 0 - 100.0% $220,000 -- -- 39 -- -- 8 1 - 87.5% Maynard 0 0 -- -- -- -- -- -- -- 2 1 - 50.0% Medfield 0 0 -- -- -- -- -- -- -- 0 0 -- Medford 5 7 + 40.0% $510,000 $588,000 + 15.3% 62 31 - 50.0% 11 1 - 90.9% Medway 0 0 -- -- -- -- -- -- -- 1 0 - 100.0% Melrose 3 1 - 66.7% $530,000 $522,000 - 1.5% 60 71 + 18.3% 1 1 0.0% Milford 0 2 -- -- $175,750 -- -- 25 -- 6 3 - 50.0% January 2016 Closed Sales Median Sales Price Days on Market Inventory Current as of February 16, 2016.. Multi-family activity is comprised of 2-, 3- and 4-family properties only. All data from MLS Property Information Network, Inc. Provided by Greater Boston Association of REALTORS®. Powered by ShowingTime 10K.
- 3. Multi-Family Housing Activity Report – 2-Family Properties (cont.) 1-2015 1-2016 + / – 1-2015 1-2016 + / – 1-2015 1-2016 + / – 1-2015 1-2016 + / – Millis 0 0 -- -- -- -- -- -- -- 2 0 - 100.0% Milton 0 3 -- -- $550,000 -- -- 77 -- 2 2 0.0% Natick 0 1 -- -- $480,000 -- -- 49 -- 2 1 - 50.0% Needham 0 1 -- -- $880,000 -- -- 12 -- 1 1 0.0% Newton 3 6 + 100.0% $1,040,000 $725,000 - 30.3% 63 38 - 39.7% 5 6 + 20.0% Norfolk 0 0 -- -- -- -- -- -- -- 1 0 - 100.0% North Attleboro 0 0 -- -- -- -- -- -- -- 4 4 0.0% North Reading 0 0 -- -- -- -- -- -- -- 1 0 - 100.0% Norwood 1 0 - 100.0% $310,000 -- -- 69 -- -- 1 2 + 100.0% Plainville 0 0 -- -- -- -- -- -- -- 2 2 0.0% Quincy 4 8 + 100.0% $272,500 $502,900 + 84.6% 85 111 + 30.6% 17 10 - 41.2% Randolph 0 0 -- -- -- -- -- -- -- 6 3 - 50.0% Reading 0 0 -- -- -- -- -- -- -- 0 0 -- Revere 9 7 - 22.2% $457,000 $460,000 + 0.7% 48 68 + 41.7% 26 10 - 61.5% Saugus 0 2 -- -- $423,200 -- -- 85 -- 1 2 + 100.0% Sharon 0 2 -- -- $375,000 -- -- 282 -- 2 0 - 100.0% Sherborn 0 0 -- -- -- -- -- -- -- 0 0 -- Somerville 7 8 + 14.3% $785,000 $750,000 - 4.5% 22 53 + 140.9% 7 9 + 28.6% Southborough 0 0 -- -- -- -- -- -- -- 0 0 -- Stoneham 0 0 -- -- -- -- -- -- -- 2 1 - 50.0% Stoughton 0 0 -- -- -- -- -- -- -- 2 3 + 50.0% Stow 1 0 - 100.0% $265,000 -- -- 186 -- -- 0 0 -- Sudbury 0 0 -- -- -- -- -- -- -- 0 0 -- Tewksbury 0 0 -- -- -- -- -- -- -- 0 1 -- Wakefield 1 3 + 200.0% $388,000 $549,000 + 41.5% 64 56 - 12.5% 2 1 - 50.0% Walpole 1 0 - 100.0% $410,000 -- -- 137 -- -- 2 0 - 100.0% Waltham 3 1 - 66.7% $500,000 $582,500 + 16.5% 47 26 - 44.7% 2 3 + 50.0% Watertown 3 6 + 100.0% $610,000 $628,500 + 3.0% 32 25 - 21.9% 0 2 -- Wayland 0 0 -- -- -- -- -- -- -- 1 0 - 100.0% Wellesley 0 0 -- -- -- -- -- -- -- 0 2 -- Weston 0 0 -- -- -- -- -- -- -- 0 0 -- Westwood 0 0 -- -- -- -- -- -- -- 1 1 0.0% Wilmington 0 0 -- -- -- -- -- -- -- 2 1 - 50.0% Winchester 0 0 -- -- -- -- -- -- -- 1 0 - 100.0% Winthrop 1 0 - 100.0% $612,000 -- -- 26 -- -- 11 1 - 90.9% Woburn 3 4 + 33.3% $430,000 $466,000 + 8.4% 92 68 - 26.1% 5 3 - 40.0% Wrentham 0 0 -- -- -- -- -- -- -- 0 0 -- Greater Boston 95 109 +14.7% $450,450 $537,000 +19.2% 62 69 +11.3% 254 169 -33.5% Note: The "Greater Boston" figures are not a compilation or total of the individual areas. Current as of February 16, 2016.. Multi-family activity is comprised of 2-, 3- and 4-family properties only. All data from MLS Property Information Network, Inc. Provided by Greater Boston Association of REALTORS®. Powered by ShowingTime 10K. January 2016 Closed Sales Median Sales Price Days on Market Inventory
- 4. Multi-Family Housing Activity Report – 3-Family Properties 1-2015 1-2016 + / – 1-2015 1-2016 + / – 1-2015 1-2016 + / – 1-2015 1-2016 + / – Acton 0 0 -- -- -- -- -- -- -- 0 0 -- Arlington 1 0 - 100.0% $815,000 -- -- 9 -- -- 1 0 - 100.0% Ashland 0 1 -- -- $360,000 -- -- 146 -- 0 0 -- Attleboro 1 1 0.0% $230,000 $302,000 + 31.3% -- 2 -- 8 5 - 37.5% Avon 0 0 -- -- -- -- -- -- -- 0 1 -- Bedford 0 0 -- -- -- -- -- -- -- 0 0 -- Bellingham 0 0 -- -- -- -- -- -- -- 1 2 + 100.0% Belmont 0 0 -- -- -- -- -- -- -- 0 0 -- Billerica 0 0 -- -- -- -- -- -- -- 0 0 -- Boston 28 25 - 10.7% $556,300 $612,500 + 10.1% 46 71 + 54.3% 71 52 - 26.8% Boxborough 0 0 -- -- -- -- -- -- -- 0 0 -- Brookline 1 0 - 100.0% $1,025,000 -- -- 37 -- -- 0 0 -- Burlington 0 0 -- -- -- -- -- -- -- 0 0 -- Cambridge 2 4 + 100.0% $1,247,400 $1,532,500 + 22.9% 130 12 - 90.8% 1 0 - 100.0% Canton 0 0 -- -- -- -- -- -- -- 0 1 -- Carlisle 0 0 -- -- -- -- -- -- -- 0 0 -- Chelsea 0 2 -- -- $469,115 -- -- 70 -- 7 12 + 71.4% Concord 0 0 -- -- -- -- -- -- -- 0 0 -- Dedham 0 0 -- -- -- -- -- -- -- 0 0 -- Dover 0 0 -- -- -- -- -- -- -- 0 0 -- Everett 4 2 - 50.0% $491,000 $465,000 - 5.3% 90 39 - 56.7% 10 2 - 80.0% Foxborough 0 0 -- -- -- -- -- -- -- 1 0 - 100.0% Framingham 0 2 -- -- $230,500 -- -- 97 -- 3 0 - 100.0% Franklin 0 1 -- -- $275,000 -- -- 84 -- 1 1 0.0% Holliston 0 0 -- -- -- -- -- -- -- 0 0 -- Hopkinton 0 0 -- -- -- -- -- -- -- 0 0 -- Hudson 0 0 -- -- -- -- -- -- -- 3 1 - 66.7% Lexington 0 0 -- -- -- -- -- -- -- 0 0 -- Lincoln 0 0 -- -- -- -- -- -- -- 0 0 -- Lynnfield 0 0 -- -- -- -- -- -- -- 0 0 -- Malden 2 3 + 50.0% $521,000 $555,000 + 6.5% 117 45 - 61.5% 3 0 - 100.0% Mansfield 0 0 -- -- -- -- -- -- -- 0 0 -- Marlborough 1 0 - 100.0% $260,000 -- -- 517 -- -- 1 2 + 100.0% Maynard 0 0 -- -- -- -- -- -- -- 0 0 -- Medfield 0 0 -- -- -- -- -- -- -- 0 0 -- Medford 0 1 -- -- $892,000 -- -- 18 -- 2 0 - 100.0% Medway 0 0 -- -- -- -- -- -- -- 0 0 -- Melrose 0 0 -- -- -- -- -- -- -- 0 0 -- Milford 0 0 -- -- -- -- -- -- -- 3 0 - 100.0% January 2016 Closed Sales Median Sales Price Days on Market Inventory Current as of February 16, 2016.. Multi-family activity is comprised of 2-, 3- and 4-family properties only. All data from MLS Property Information Network, Inc. Provided by Greater Boston Association of REALTORS®. Powered by ShowingTime 10K.
- 5. Multi-Family Housing Activity Report – 3-Family Properties (cont.) 1-2015 1-2016 + / – 1-2015 1-2016 + / – 1-2015 1-2016 + / – 1-2015 1-2016 + / – Millis 0 0 -- -- -- -- -- -- -- 0 0 -- Milton 0 0 -- -- -- -- -- -- -- 2 0 - 100.0% Natick 0 0 -- -- -- -- -- -- -- 0 0 -- Needham 0 0 -- -- -- -- -- -- -- 0 0 -- Newton 0 0 -- -- -- -- -- -- -- 0 1 -- Norfolk 0 0 -- -- -- -- -- -- -- 0 0 -- North Attleboro 0 0 -- -- -- -- -- -- -- 5 5 0.0% North Reading 0 0 -- -- -- -- -- -- -- 0 0 -- Norwood 0 1 -- -- $350,000 -- -- 33 -- 1 1 0.0% Plainville 0 0 -- -- -- -- -- -- -- 0 0 -- Quincy 2 3 + 50.0% $575,000 $572,000 - 0.5% 26 64 + 146.2% 3 3 0.0% Randolph 0 0 -- -- -- -- -- -- -- 0 0 -- Reading 0 0 -- -- -- -- -- -- -- 2 0 - 100.0% Revere 0 1 -- -- $610,000 -- -- 39 -- 5 5 0.0% Saugus 0 1 -- -- $480,000 -- -- 147 -- 0 0 -- Sharon 0 0 -- -- -- -- -- -- -- 0 0 -- Sherborn 0 0 -- -- -- -- -- -- -- 0 0 -- Somerville 2 6 + 200.0% $924,500 $962,500 + 4.1% 67 52 - 22.4% 6 3 - 50.0% Southborough 0 0 -- -- -- -- -- -- -- 0 0 -- Stoneham 0 0 -- -- -- -- -- -- -- 0 0 -- Stoughton 0 0 -- -- -- -- -- -- -- 1 0 - 100.0% Stow 0 0 -- -- -- -- -- -- -- 0 0 -- Sudbury 0 0 -- -- -- -- -- -- -- 0 0 -- Tewksbury 0 0 -- -- -- -- -- -- -- 0 0 -- Wakefield 1 0 - 100.0% $550,000 -- -- 57 -- -- 0 0 -- Walpole 0 0 -- -- -- -- -- -- -- 0 0 -- Waltham 0 0 -- -- -- -- -- -- -- 1 0 - 100.0% Watertown 0 0 -- -- -- -- -- -- -- 0 0 -- Wayland 0 0 -- -- -- -- -- -- -- 0 0 -- Wellesley 0 1 -- -- $1,265,000 -- -- 9 -- 0 1 -- Weston 0 0 -- -- -- -- -- -- -- 0 0 -- Westwood 0 0 -- -- -- -- -- -- -- 0 0 -- Wilmington 0 0 -- -- -- -- -- -- -- 0 0 -- Winchester 0 0 -- -- -- -- -- -- -- 0 0 -- Winthrop 0 0 -- -- -- -- -- -- -- 0 1 -- Woburn 0 0 -- -- -- -- -- -- -- 0 2 -- Wrentham 0 0 -- -- -- -- -- -- -- 0 0 -- Greater Boston 41 50 +22.0% $558,000 $616,250 +10.4% 58 60 +3.4% 122 86 -29.5% Note: The "Greater Boston" figures are not a compilation or total of the individual areas. Current as of February 16, 2016.. Multi-family activity is comprised of 2-, 3- and 4-family properties only. All data from MLS Property Information Network, Inc. Provided by Greater Boston Association of REALTORS®. Powered by ShowingTime 10K. January 2016 Closed Sales Median Sales Price Days on Market Inventory
- 6. Multi-Family Housing Activity Report – 4-Family Properties 1-2015 1-2016 + / – 1-2015 1-2016 + / – 1-2015 1-2016 + / – 1-2015 1-2016 + / – Acton 0 0 -- -- -- -- -- -- -- 0 1 -- Arlington 0 0 -- -- -- -- -- -- -- 0 0 -- Ashland 0 0 -- -- -- -- -- -- -- 0 0 -- Attleboro 0 0 -- -- -- -- -- -- -- 1 2 + 100.0% Avon 0 0 -- -- -- -- -- -- -- 0 0 -- Bedford 0 0 -- -- -- -- -- -- -- 0 0 -- Bellingham 0 0 -- -- -- -- -- -- -- 1 0 - 100.0% Belmont 0 0 -- -- -- -- -- -- -- 0 0 -- Billerica 0 0 -- -- -- -- -- -- -- 0 0 -- Boston 3 2 - 33.3% $525,000 $1,925,000 + 266.7% 29 127 + 337.9% 8 9 + 12.5% Boxborough 0 0 -- -- -- -- -- -- -- 0 0 -- Brookline 0 1 -- -- $2,610,000 -- -- 71 -- 0 0 -- Burlington 0 0 -- -- -- -- -- -- -- 0 0 -- Cambridge 1 1 0.0% $1,315,000 $4,270,500 + 224.8% 26 71 + 173.1% 1 2 + 100.0% Canton 0 0 -- -- -- -- -- -- -- 0 0 -- Carlisle 0 0 -- -- -- -- -- -- -- 0 0 -- Chelsea 0 0 -- -- -- -- -- -- -- 2 1 - 50.0% Concord 0 0 -- -- -- -- -- -- -- 0 0 -- Dedham 0 0 -- -- -- -- -- -- -- 0 1 -- Dover 0 0 -- -- -- -- -- -- -- 0 0 -- Everett 0 0 -- -- -- -- -- -- -- 2 0 - 100.0% Foxborough 0 0 -- -- -- -- -- -- -- 0 1 -- Framingham 0 1 -- -- $472,500 -- -- 64 -- 1 0 - 100.0% Franklin 0 0 -- -- -- -- -- -- -- 0 1 -- Holliston 0 0 -- -- -- -- -- -- -- 0 1 -- Hopkinton 0 0 -- -- -- -- -- -- -- 0 0 -- Hudson 0 0 -- -- -- -- -- -- -- 0 0 -- Lexington 0 0 -- -- -- -- -- -- -- 0 0 -- Lincoln 0 0 -- -- -- -- -- -- -- 0 0 -- Lynnfield 0 0 -- -- -- -- -- -- -- 0 0 -- Malden 0 0 -- -- -- -- -- -- -- 0 1 -- Mansfield 0 0 -- -- -- -- -- -- -- 0 0 -- Marlborough 0 0 -- -- -- -- -- -- -- 0 1 -- Maynard 0 0 -- -- -- -- -- -- -- 0 1 -- Medfield 0 0 -- -- -- -- -- -- -- 0 0 -- Medford 0 0 -- -- -- -- -- -- -- 1 0 - 100.0% Medway 0 0 -- -- -- -- -- -- -- 0 0 -- Melrose 0 1 -- -- $906,000 -- -- 14 -- 0 1 -- Milford 0 0 -- -- -- -- -- -- -- 0 0 -- January 2016 Closed Sales Median Sales Price Days on Market Inventory Current as of February 16, 2016.. Multi-family activity is comprised of 2-, 3- and 4-family properties only. All data from MLS Property Information Network, Inc. Provided by Greater Boston Association of REALTORS®. Powered by ShowingTime 10K.
- 7. Multi-Family Housing Activity Report – 4-Family Properties (cont.) 1-2015 1-2016 + / – 1-2015 1-2016 + / – 1-2015 1-2016 + / – 1-2015 1-2016 + / – Millis 0 0 -- -- -- -- -- -- -- 0 0 -- Milton 0 0 -- -- -- -- -- -- -- 0 0 -- Natick 0 0 -- -- -- -- -- -- -- 0 0 -- Needham 0 0 -- -- -- -- -- -- -- 0 0 -- Newton 0 0 -- -- -- -- -- -- -- 0 0 -- Norfolk 0 0 -- -- -- -- -- -- -- 0 0 -- North Attleboro 0 0 -- -- -- -- -- -- -- 1 1 0.0% North Reading 0 0 -- -- -- -- -- -- -- 0 0 -- Norwood 0 0 -- -- -- -- -- -- -- 0 0 -- Plainville 0 0 -- -- -- -- -- -- -- 0 0 -- Quincy 0 0 -- -- -- -- -- -- -- 2 4 + 100.0% Randolph 0 0 -- -- -- -- -- -- -- 0 0 -- Reading 0 0 -- -- -- -- -- -- -- 0 0 -- Revere 0 0 -- -- -- -- -- -- -- 0 1 -- Saugus 0 0 -- -- -- -- -- -- -- 0 0 -- Sharon 0 0 -- -- -- -- -- -- -- 0 0 -- Sherborn 0 0 -- -- -- -- -- -- -- 0 0 -- Somerville 1 0 - 100.0% $1,000,000 -- -- 58 -- -- 2 5 + 150.0% Southborough 0 0 -- -- -- -- -- -- -- 0 0 -- Stoneham 0 0 -- -- -- -- -- -- -- 0 0 -- Stoughton 0 0 -- -- -- -- -- -- -- 1 0 - 100.0% Stow 0 0 -- -- -- -- -- -- -- 0 0 -- Sudbury 0 0 -- -- -- -- -- -- -- 0 0 -- Tewksbury 0 0 -- -- -- -- -- -- -- 0 0 -- Wakefield 0 0 -- -- -- -- -- -- -- 0 0 -- Walpole 0 0 -- -- -- -- -- -- -- 0 0 -- Waltham 0 1 -- -- $700,000 -- -- 15 -- 2 1 - 50.0% Watertown 0 1 -- -- $1,191,000 -- -- 47 -- 0 0 -- Wayland 0 0 -- -- -- -- -- -- -- 0 0 -- Wellesley 0 0 -- -- -- -- -- -- -- 0 1 -- Weston 0 0 -- -- -- -- -- -- -- 0 0 -- Westwood 0 0 -- -- -- -- -- -- -- 0 0 -- Wilmington 0 0 -- -- -- -- -- -- -- 0 0 -- Winchester 0 0 -- -- -- -- -- -- -- 0 0 -- Winthrop 0 0 -- -- -- -- -- -- -- 1 1 0.0% Woburn 1 1 0.0% $320,000 $445,000 + 39.1% 102 75 - 26.5% 1 0 - 100.0% Wrentham 0 0 -- -- -- -- -- -- -- 0 0 -- Greater Boston 6 9 +50.0% $762,500 $906,000 +18.8% 45 68 +51.1% 23 29 +26.1% Note: The "Greater Boston" figures are not a compilation or total of the individual areas. Current as of February 16, 2016.. Multi-family activity is comprised of 2-, 3- and 4-family properties only. All data from MLS Property Information Network, Inc. Provided by Greater Boston Association of REALTORS®. Powered by ShowingTime 10K. January 2016 Closed Sales Median Sales Price Days on Market Inventory