SlideShare a Scribd company logo
1 of 13
Download to read offline
Monthly Indicators
A RESEARCH TOOL PROVIDED BY THE GREATER BOSTON ASSOCIATION OF REALTORS®

December 2013

Quick Facts

In its entirety, 2013 proved to be a good year for housing. Home sales and
prices were broadly higher across the nation, while foreclosure loads, the
number of homes for sale and the number of days it took to sell a home were all
much lower. Multiple-offer situations became commonplace again and prices in
many areas rallied to multi-year highs. This, of course, varied by location and
segment, but the proverbial glass appeared to be more than half full throughout
the year.

+ 5.4%

+ 9.3%

+ 1.3%

Year-Over-Year
(YoY) Change in
Closed Sales
All Properties

Year-Over-Year
(YoY) Change in
Closed Sales
Single-Family Only

Year-Over-Year
(YoY) Change in
Closed Sales
Condominium Only

New Listings in the Greater Boston region were up 11.5 percent for detached
homes and 18.6 percent for condominiums. Closed Sales increased 9.3 percent
for detached homes and 1.3 percent for condominiums.

Single-Family Market Overview

The Median Sales Price was up 6.4 percent to $500,000 for single-family
properties and 11.2 percent to $423,250 for condominiums. Months Supply of
Inventory decreased 37.0 percent for single-family units and 30.8 percent for
townhouse-condo units.

Median Sales Price

Condominium Market Overview
Closed Sales
Housing Affordability Index
Inventory of Homes for Sale
Months Supply of Inventory

Housing is fortified by confident consumers and good jobs. The year 2013 was
marked by a slowly improving labor market stunted by political gridlock, and the
Federal Reserve's long-awaited taper announcement was not surprising.
Interest rates remain low (but upwardly mobile), prices are still affordable, the
employment picture looks decent and the stock market is up nearly 30.0
percent from this time last year. It's no wonder that buyers were active in 2013.
Here's to more of the same in 2014.

Days On Market Until Sale
Percent of Original List Price Received
Pending Sales
New Listings
City of Boston Overview

2
3
4
5
6
7
8
9
10
11
12
13

Click on desired metric to jump to that page.

Data is refreshed regularly to capture changes in market activity so figures shown may be different than previously reported. Current as of January 16, 2014. All data from MLS Property
Information Network, Inc. Provided by Greater Boston Association of REALTORS® and the Massachusetts Association of REALTORS®. Powered by 10K Research and Marketing.
Single-Family Market Overview
Key market metrics for the current month and year-to-date figures for Single-Family Homes Only.

Key Metrics

Historical Sparklines

Dec-2012 Dec-2013

Closed Sales

+/–

YTD 2012 YTD 2013

+/–

819

12-2012
12 2012

12-2011

12-2012

12-2011

12-2012

12-2011

12-2012

12-2011

12-2012

12-2011

12-2012

- 31.2%

--

--

--

1.8

- 37.0%

--

--

--

69

- 28.6%

98

68

- 30.5%

95.9%

+ 1.8%

94.4%

97.0%

+ 2.8%

510

+ 1.2%

10,871

11,619

+ 6.9%

396

+ 11.5%

14,394

14,701

+ 2.1%

12-2013

New Listings
12-2010

1,613

12-2013

Pending Sales
12-2010

- 12.7%

12-2013

Percent of Original
List Price Received
12-2010

100

12-2013

Days on Market Until Sale
12-2010

115

12-2013
12 2013

Months Supply of Inventory
12-2010

- 11.9%

355

12-2011
12 2011

99

12-2013

Inventory of Homes for Sale
12-2010
12 2010

+ 7.6%

504

12-2012

$495,000

94.2%

12-2011

$459,900

12-2013

Housing Affordability Index
12-2010

+ 6.4%

97

12-2012

$500,000

2.9

12-2011

+ 6.9%

12-2013

Median Sales Price
12-2010

11,442

2,343

12-2012

10,707

113

12-2011

+ 9.3%

$470,000

12-2010

895

12-2013

All data from MLS Property Information Network, Inc. Provided by the Greater Boston Association of REALTORS® and the Massachusetts Association of REALTORS®. Powered by 10K Research and Marketing. | Click for Cover Page | 2
Condominium Market Overview
Key market metrics for the current month and year-to-date figures for Condominium Properties Only.

Key Metrics

Historical Sparklines

Dec-2012 Dec-2013

Closed Sales

+/–

YTD 2012 YTD 2013

+/–

766

12-2012
12 2012

12-2011

12-2012

12-2011

12-2012

12-2011

12-2012

12-2011

12-2012

12-2011

12-2012

- 29.9%

--

--

--

1.4

- 30.8%

--

--

--

55

- 35.0%

87

53

- 38.8%

98.1%

+ 1.9%

95.8%

98.9%

+ 3.2%

441

- 3.9%

9,811

10,595

+ 8.0%

364

+ 18.6%

12,229

12,676

+ 3.7%

12-2013

New Listings
12-2010

1,073

12-2013

Pending Sales
12-2010

- 12.2%

12-2013

Percent of Original
List Price Received
12-2010

120

12-2013

Days on Market Until Sale
12-2010

137

12-2013
12 2013

Months Supply of Inventory
12-2010

- 15.2%

307

12-2011
12 2011

116

12-2013

Inventory of Homes for Sale
12-2010
12 2010

+ 6.9%

459

12-2012

$405,000

96.2%

12-2011

$379,000

12-2013

Housing Affordability Index
12-2010

+ 11.2%

84

12-2012

$423,250

2.0

12-2011

+ 7.4%

12-2013

Median Sales Price
12-2010

10,370

1,531

12-2012

9,655

137

12-2011

+ 1.3%

$380,500

12-2010

776

12-2013

All data from MLS Property Information Network, Inc. Provided by the Greater Boston Association of REALTORS® and the Massachusetts Association of REALTORS®. Powered by 10K Research and Marketing. | Click for Cover Page | 3
Closed Sales
A count of the actual sales that have closed in a given month.

December

Year to Date

Single-Family

YoY
Change

Condominium

YoY
Change

Jan-2013

643

7,918

- 4.0%

628

+ 3.5%

778

+ 4.9%

806

+ 6.5%

1,108

+ 10.5%

1,069

+ 5.9%

Jun-2013

9,655

8,958

622

Apr-2013

10,370

+ 13.3%

May-2013

10,707

+ 24.8%

435

Mar-2013

11,442

776

514

- 7.6%

1,489

- 0.9%

1,248

- 1.2%

1,491

+ 17.4%

1,255

+ 20.9%

Aug-2013

766

+ 15.1%

428

Jul-2013

819
736

601

Feb-2013

895

1,441

+ 11.6%

1,276

+ 6.2%

Sep-2013

2012

2013

+11.3%

+9.3%

Single-Family

2011

2012

2013

+19.1%

+1.3%

Condominium

2011

2012

2013

+19.5%

+6.9%

Single-Family

2011

2012
+21.9%

+7.4%

891

+ 19.1%

+ 10.3%

764

+ 7.3%

796

- 11.8%

708

- 6.5%

Dec-2013

2013

+ 22.0%

867

Nov-2013
2011

926

Oct-2013

895

+ 9.3%

776

+ 1.3%

11,442

+ 6.9%

10,370

+ 7.4%

Total

Condominium

Historical Closed Sales Activity

Single-Family

Condominium

1,800
1,600
1,400
1,200
1,000
800
600
400
200
Jan-2003

Jan-2004

Jan-2005

Jan-2006

Jan-2007

Jan-2008

Jan-2009

Jan-2010

Jan-2011

Jan-2012

Jan-2013

All data from MLS Property Information Network, Inc. Provided by the Greater Boston Association of REALTORS® and the Massachusetts Association of REALTORS®. Powered by 10K Research and Marketing. | Click for Cover Page | 4
Median Sales Price
Median price point for all closed sales, not accounting for seller concessions, in a given month.

December

Year to Date

+6.7%

+6.4%

Single-Family

+10.3%

+11.2%

Condominium

$405,000

+ 19.1%

+ 14.2%

$387,500

+ 4.5%

May-2013

$499,000

+ 7.3%

$410,000

+ 7.6%

$542,000

+ 7.9%

$420,000

+ 5.0%

$532,250

+ 4.4%

$400,000

+ 3.4%

$520,000

+ 6.1%

$415,500

+ 9.3%

$500,500

+ 16.4%

$410,000

+ 9.3%

$468,000

+ 8.5%

$416,750

+ 13.9%

Nov-2013
2013

+ 2.5%

$476,500

Oct-2013

$360,000

2012

$425,100

Sep-2013

2011

- 5.4%

Aug-2013

2013

+ 4.0%

$350,000

Jul-2013

$380,500

2012

$369,250

+ 8.8%

$475,000

+ 6.4%

$410,250

+ 8.0%

Dec-2013

$500,000

+ 6.4%

$423,250

+ 11.2%

Median

$495,000

+ 7.6%

$405,000

+ 6.9%

$405,000

$345,000

2011

+ 6.2%

Apr-2013

$423,250

$430,000
$429,850

Mar-2013

$452,500 $459,900

YoY
Change

Jun-2013

$470,000
$440,458

Condominium

Feb-2013
$495,000

YoY
Change

Jan-2013
$500,000

Single-Family

2011

2012

2013

+1.6%

+7.6%

Single-Family

2011

$379,000

2012

2013

+5.3%

+6.9%

Condominium

Historical Median Sales Price

Single-Family

Condominium

$550,000

$500,000

$450,000

$400,000

$350,000

$300,000

$250,000
Jan-2003

Jan-2004

Jan-2005

Jan-2006

Jan-2007

Jan-2008

Jan-2009

Jan-2010

Jan-2011

Jan-2012

Jan-2013

All data from MLS Property Information Network, Inc. Provided by the Greater Boston Association of REALTORS® and the Massachusetts Association of REALTORS®. Powered by 10K Research and Marketing. | Click for Cover Page | 5
Housing Affordability Index
This index measures housing affordability for the region. An index of 120 means the median household income was 120% of what is necessary
to qualify for the median-priced home under prevailing interest rates. A higher number means greater affordability.

December

Year to Date

+6.9%

-11.9%

Single-Family

2011

2012

2013

+3.7%

2011

-15.2%

2013

+11.4%

Condominium

2012

-12.7%

Single-Family

2011

2012

2013

+7.9%

-12.2%

+ 4.5%

128

- 8.8%

112

- 5.3%

136

+ 2.7%

104

- 4.8%

124

- 5.0%

90

- 11.6%

114

- 9.2%

92

- 9.4%

120

- 8.4%

93

- 11.6%

115

- 13.8%

98

- 19.0%

118

- 14.0%

104

- 13.1%

116

- 16.6%

Nov-2013
2013

123

Oct-2013

2012

Mar-2013

Sep-2013

2011

+ 11.2%

Aug-2013

100

+ 5.6%

146

Jul-2013

103

99

143

- 2.0%

Apr-2013

120

115

+ 3.7%

Jun-2013

113

125
122

May-2013

105

127
116

Condominium

Feb-2013

137

137

YoY
Change

Jan-2013

132

Single-Family

YoY
Change

109

- 6.4%

125

- 7.6%

Dec-2013

99

- 11.9%

116

- 15.2%

Average

106

-7.2%

125

-6.6%

Condominium

Historical Housing Affordability Index

Single-Family

Condominium

160
150
140
130
120
110
100
90
80
70
60
Jan-2004

Jan-2005

Jan-2006

Jan-2007

Jan-2008

Jan-2009

Jan-2010

Jan-2011

Jan-2012

Jan-2013

All data from MLS Property Information Network, Inc. Provided by the Greater Boston Association of REALTORS® and the Massachusetts Association of REALTORS®. Powered by 10K Research and Marketing. | Click for Cover Page | 6
Inventory of Homes for Sale
The number of properties available for sale in active status at the end of a given month.

December

Single-Family

- 42.4%

1,706

- 41.8%

2,420

- 40.6%

1,736

- 47.3%

2,813

- 34.9%

1,977

- 40.4%

3,086

- 30.8%

2,075

- 35.3%

Jun-2013

3,084

- 26.7%

2,031

- 32.0%

Jul-2013

2,905

- 25.3%

1,857

- 32.7%

Aug-2013

2,793

- 23.8%

1,727

- 29.4%

Sep-2013

3,002

- 21.5%

1,928

- 24.3%

Oct-2013

1,073

1,593

- 32.5%

Apr-2013

1,531

- 30.6%

May-2013

1,613

2,345
2,453

Mar-2013

2,343

YoY
Change

Feb-2013

2,685

Condominium

Jan-2013

3,414

YoY
Change

2,847

- 19.5%

1,828

- 21.9%

Nov-2013

2011

2012
-31.4%
Single-Family

2011

-31.2%

2,315

- 23.7%

1,465

- 27.3%

2012

2013

Dec-2013

1,613

- 31.2%

1,073

- 29.9%

-43.0%
Condominium

2013

-29.9%

Average

2,640

- 28.6%

1,750

- 34.7%

Historical Inventory of Homes for Sale

Single-Family

Condominium

9,000
8,000
7,000
6,000
5,000
4,000
3,000
2,000
1,000
Jan-2003

Jan-2004

Jan-2005

Jan-2006

Jan-2007

Jan-2008

Jan-2009

Jan-2010

Jan-2011

Jan-2012

Jan-2013

All data from MLS Property Information Network, Inc. Provided by the Greater Boston Association of REALTORS® and the Massachusetts Association of REALTORS®. Powered by 10K Research and Marketing. | Click for Cover Page | 7
Months Supply of Inventory
The inventory of homes for sale at the end of a given month, divided by the average monthly pending sales from the last 12 months.

December

Single-Family

- 53.8%

3.9

- 48.6%

3.9

- 38.1%

2.8

- 49.0%

3.6

- 37.9%

2.5

- 44.0%

2.8

- 37.4%

1.9

- 38.9%

Jun-2013

2.1

- 26.1%

1.6

- 31.2%

Jul-2013

1.9

- 36.3%

1.5

- 44.3%

Aug-2013

1.9

- 31.7%

1.4

- 33.5%

Sep-2013

3.2

- 35.6%

2.2

- 36.5%

Oct-2013

1.4

3.1

- 27.0%

May-2013

1.8

- 39.7%

Apr-2013

2.0

3.9
5.7

Mar-2013

2.9

YoY
Change

Feb-2013

4.2

Condominium

Jan-2013

4.6

YoY
Change

3.3

- 27.0%

2.4

- 27.2%

Nov-2013

2011

2012
-38.3%
Single-Family

2011

-37.0%

2.9

- 13.6%

2.1

- 22.3%

2012

2013

Dec-2013

1.8

- 37.0%

1.4

- 30.8%

-52.1%
Condominium

2013

-30.8%

Average

2.9

- 36.9%

2.1

- 44.3%

Historical Months Supply of Inventory

Single-Family

Condominium

16
14
12
10
8
6
4
2
0
Jan-2004

Jan-2005

Jan-2006

Jan-2007

Jan-2008

Jan-2009

Jan-2010

Jan-2011

Jan-2012

Jan-2013

All data from MLS Property Information Network, Inc. Provided by the Greater Boston Association of REALTORS® and the Massachusetts Association of REALTORS®. Powered by 10K Research and Marketing. | Click for Cover Page | 8
Days on Market Until Sale
Average number of days between when a property is listed and when an offer is accepted in a given month.

December

Year to Date

2011

2012

2013

-12.7%

-28.6%

Single-Family

2011

2012

2013

-30.0%

-35.0%

Condominium

2011

2012

2013

-5.8%

-30.5%

Single-Family

2011

2012
-17.7%

- 35.1%

74

- 22.2%

51

- 40.3%

56

- 37.6%

43

- 42.3%

47

- 41.7%

38

- 46.3%

49

- 44.3%

40

- 47.6%

58

- 35.1%

50

- 41.0%

59

- 33.8%

47

- 44.4%

65

- 26.8%

51

- 33.4%

69

- 28.6%

55

- 35.0%

Total

-38.8%

- 39.1%

63

Dec-2013

2013

71

- 22.1%

Nov-2013

55

- 17.8%

94

Oct-2013

53

107

Sep-2013

69

- 22.5%

Jul-2013

68

- 29.1%

96

Aug-2013

84

88

- 17.0%

Jun-2013

97

- 16.4%

Apr-2013

87

109
111

May-2013

111

YoY
Change

Mar-2013

98

Condominium

Feb-2013

105

104

YoY
Change

Jan-2013

120

Single-Family

68

- 30.5%

51

- 37.0%

Condominium

Historical Days on Market Until Sale

Single-Family

Condominium

150

130

110

90

70

50

30
Jan-2003

Jan-2004

Jan-2005

Jan-2006

Jan-2007

Jan-2008

Jan-2009

Jan-2010

Jan-2011

Jan-2012

Jan-2013

All data from MLS Property Information Network, Inc. Provided by the Greater Boston Association of REALTORS® and the Massachusetts Association of REALTORS®. Powered by 10K Research and Marketing. | Click for Cover Page | 9
Percent of Original List Price Received
Percentage found when dividing a property’s sales price by its original list price, then taking the average for all properties sold in a given month,
not accounting for seller concessions.

December

Year to Date

+2.3%

+1.8%

Single-Family

2012

2013

+3.4%

+1.9%

Condominium

2011

2012

2013

+1.4%

+2.8%

Single-Family

2011

2013

+2.0%

+3.2%

+ 2.4%

97.6%

+ 3.8%

+ 3.4%

98.8%

+ 3.3%

97.8%

+ 2.6%

99.5%

+ 3.5%

98.4%

+ 3.2%

99.7%

+ 3.5%

98.1%

+ 2.4%

99.9%

+ 3.5%

97.9%

+ 3.2%

99.6%

+ 3.5%

97.3%

+ 2.9%

99.0%

+ 2.6%

97.2%

+ 3.0%

98.8%

+ 3.1%

96.3%

+ 1.7%

98.8%

+ 2.8%

Dec-2013

2012

95.2%
96.7%

Nov-2013
2011

Mar-2013

Oct-2013

2013

+ 3.5%

Sep-2013

2012

+ 3.1%

96.6%

Aug-2013

2011

95.8%

+ 3.1%

Jul-2013

94.0% 95.8%

+ 3.7%

Jun-2013

97.0%
93.1% 94.4%

93.8%
94.1%

May-2013

93.0%

YoY
Change

Apr-2013

95.9%
92.1% 94.2%

Condominium

Feb-2013
98.9%

YoY
Change

Jan-2013
96.2% 98.1%

Single-Family

95.9%

+ 1.8%

98.1%

+ 1.9%

Average

97.0%

+ 2.8%

98.9%

+ 3.2%

Condominium

Historical Percent of Original List Price Received

Single-Family

Condominium

101%

99%

97%

95%

93%

91%

89%
Jan-2003

Jan-2004

Jan-2005

Jan-2006

Jan-2007

Jan-2008

Jan-2009

Jan-2010

Jan-2011

Jan-2012

Jan-2013

All data from MLS Property Information Network, Inc. Provided by the Greater Boston Association of REALTORS® and the Massachusetts Association of REALTORS®. Powered by 10K Research and Marketing. | Click for Cover Page | 10
Pending Sales
A count of the properties in UAG status between the first and last day in a given month, regardless of current status (based on Off Market Date).

December

Year to Date

Single-Family

YoY
Change

Condominium

YoY
Change

Jan-2013

474

504

459
414

10,871

441

9,811
9,091
7,952

+ 18.8%

712

- 4.6%

1,183

+ 2.7%

1,166

+ 9.3%

Apr-2013

10,595

657

- 5.8%

Mar-2013

11,619

+ 2.8%

713

1,389

+ 12.5%

1,272

+ 8.9%

May-2013

510

626

Feb-2013

1,490

+ 15.7%

1,263

+ 7.0%

Jun-2013

1,292

+ 9.8%

1,093

+ 10.1%

Jul-2013

991

+ 5.0%

960

+ 20.5%

Aug-2013

899

+ 15.1%

765

+ 4.9%

Sep-2013

2012

2013

+6.3%

+1.2%

Single-Family

2011

2012

2013

+10.9%

-3.9%

Condominium

2011

2012

2013

+19.6%

+6.9%

Single-Family

2011

2012
+23.4%

+8.0%

793

+ 8.2%

+ 9.3%

823

+ 4.2%

718

+ 4.7%

650

+ 9.1%

Dec-2013

2013

- 1.3%

955

Nov-2013
2011

853

Oct-2013

510

+ 1.2%

441

- 3.9%

11,619

+ 6.9%

10,595

+ 8.0%

Total

Condominium

Historical Pending Sales Activity

Single-Family

Condominium

2,200
2,000
1,800
1,600
1,400
1,200
1,000
800
600
400
200
Jan-2003

Jan-2004

Jan-2005

Jan-2006

Jan-2007

Jan-2008

Jan-2009

Jan-2010

Jan-2011

Jan-2012

Jan-2013

All data from MLS Property Information Network, Inc. Provided by the Greater Boston Association of REALTORS® and the Massachusetts Association of REALTORS®. Powered by 10K Research and Marketing. | Click for Cover Page | 11
New Listings
A count of the properties that have been newly listed on the market in a given month.

December

Year to Date

YoY
Change

Single-Family

Condominium

YoY
Change

Jan-2013

Mar-2013

1,356

- 30.5%

1,344

- 21.1%

2,009

+ 14.3%

1,664

+ 13.6%

2,002

+ 14.3%

1,539

+ 12.9%

1,522

+ 15.1%

1,228

+ 8.4%

1,131

+ 12.9%

998

+ 12.5%

Aug-2013

307

- 14.7%

Jul-2013

12,229 12,676

- 2.5%

952

May-2013

364

355

907

- 21.7%

Apr-2013

13,403
383

- 5.6%

998

Jun-2013

396

883

Feb-2013

14,794 14,394 14,701

447

1,043

+ 6.1%

867

+ 11.2%

Sep-2013

2012

2013

-20.6%

+11.5%

Single-Family

2011

2012

2013

-19.8%

+18.6%

Condominium

2011

2012

2013

-2.7%

+2.1%

Single-Family

2011

2012
-8.8%

+3.7%

1,252

+ 10.8%

+ 17.6%

1,008

+ 17.1%

661

+ 4.8%

553

0.0%

Dec-2013

2013

+ 6.3%

1,231

Nov-2013
2011

1,469

Oct-2013

396

+ 11.5%

364

+ 18.6%

14,701

+ 2.1%

12,676

+ 3.7%

Total

Condominium

Historical New Listing Activity

Single-Family

Condominium

2,750
2,500
2,250
2,000
1,750
1,500
1,250
1,000
750
500
250
0
Jan-2003

Jan-2004

Jan-2005

Jan-2006

Jan-2007

Jan-2008

Jan-2009

Jan-2010

Jan-2011

Jan-2012

Jan-2013

All data from MLS Property Information Network, Inc. Provided by the Greater Boston Association of REALTORS® and the Massachusetts Association of REALTORS®. Powered by 10K Research and Marketing. | Click for Cover Page | 12
City of Boston – Market Overview
Key market metrics for the current month and year-to-date figures for the City of Boston.

Key Metrics

Historical Sparklines

Dec-2012 Dec-2013

Closed Sales

+/–

YTD 2012 YTD 2013

+/–

426

12-2012
12 2012

12-2011

12-2012

12-2011

12-2012

12-2011

12-2012

12-2011

12-2012

12-2011

12-2012

- 20.9%

--

--

--

1.2

- 26.2%

--

--

--

57

- 25.5%

82

47

- 42.4%

97.3%

+ 1.7%

95.6%

98.6%

+ 3.1%

254

+ 5.8%

5,462

5,804

+ 6.3%

213

+ 40.1%

6,827

7,106

+ 4.1%

12-2013

New Listings
12-2010

554

12-2013

Pending Sales
12-2010

- 12.7%

12-2013

Percent of Original
List Price Received
12-2010

100

12-2013

Days on Market Until Sale
12-2010

115

12-2013
12 2013

Months Supply of Inventory
12-2010

- 11.9%

152

12-2011
12 2011

99

12-2013

Inventory of Homes for Sale
12-2010
12 2010

+ 9.7%

240

12-2012

$439,000

95.6%

12-2011

$400,000

12-2013

Housing Affordability Index
12-2010

+ 12.8%

76

12-2012

$451,000

1.6

12-2011

+ 4.7%

12-2013

Median Sales Price
12-2010

5,677

700

12-2012

5,421

113

12-2011

+ 7.3%

$400,000

12-2010

457

12-2013

All data from MLS Property Information Network, Inc. Provided by the Greater Boston Association of REALTORS® and the Massachusetts Association of REALTORS®. Powered by 10K Research and Marketing. | Click for Cover Page | 13

More Related Content

More from Unit Realty Group

September 2015 Greater Boston Real Estate Market Trends Report
September 2015 Greater Boston Real Estate Market Trends ReportSeptember 2015 Greater Boston Real Estate Market Trends Report
September 2015 Greater Boston Real Estate Market Trends ReportUnit Realty Group
 
August 2015 Greater Boston Real Estate Market Trends Report
August 2015 Greater Boston Real Estate Market Trends ReportAugust 2015 Greater Boston Real Estate Market Trends Report
August 2015 Greater Boston Real Estate Market Trends ReportUnit Realty Group
 
February 2015 Greater Boston Real Estate Market Trends Report
February 2015 Greater Boston Real Estate Market Trends ReportFebruary 2015 Greater Boston Real Estate Market Trends Report
February 2015 Greater Boston Real Estate Market Trends ReportUnit Realty Group
 
January 2015′s Monthly Multi-family Housing Activity Report
January 2015′s Monthly Multi-family Housing Activity ReportJanuary 2015′s Monthly Multi-family Housing Activity Report
January 2015′s Monthly Multi-family Housing Activity ReportUnit Realty Group
 
January 2015 Greater Boston Real Estate Market Trends Report
January 2015 Greater Boston Real Estate Market Trends ReportJanuary 2015 Greater Boston Real Estate Market Trends Report
January 2015 Greater Boston Real Estate Market Trends ReportUnit Realty Group
 
December 2014 Greater Boston Real Estate Market Trends Report
December 2014 Greater Boston Real Estate Market Trends ReportDecember 2014 Greater Boston Real Estate Market Trends Report
December 2014 Greater Boston Real Estate Market Trends ReportUnit Realty Group
 
November 2014 Greater Boston Real Estate Market Trends Report
November 2014 Greater Boston Real Estate Market Trends ReportNovember 2014 Greater Boston Real Estate Market Trends Report
November 2014 Greater Boston Real Estate Market Trends ReportUnit Realty Group
 
November 2014 Multi-family Housing Activity Report – Boston, MA Real Estate
November 2014 Multi-family Housing Activity Report – Boston, MA Real EstateNovember 2014 Multi-family Housing Activity Report – Boston, MA Real Estate
November 2014 Multi-family Housing Activity Report – Boston, MA Real EstateUnit Realty Group
 
October 2014 Greater Boston Real Estate Market Trends Report
October 2014 Greater Boston Real Estate Market Trends ReportOctober 2014 Greater Boston Real Estate Market Trends Report
October 2014 Greater Boston Real Estate Market Trends ReportUnit Realty Group
 
September 2014 Multi-family Housing Activity Report – Boston, MA Real Estate
September 2014 Multi-family Housing Activity Report – Boston, MA Real EstateSeptember 2014 Multi-family Housing Activity Report – Boston, MA Real Estate
September 2014 Multi-family Housing Activity Report – Boston, MA Real EstateUnit Realty Group
 
Boston By The Numbers - Boston Housing Stock (Report)
Boston By The Numbers - Boston Housing Stock (Report)Boston By The Numbers - Boston Housing Stock (Report)
Boston By The Numbers - Boston Housing Stock (Report)Unit Realty Group
 
May 2014 Multi-family Housing Activity Report – Boston, MA Real Estate
May 2014 Multi-family Housing Activity Report – Boston, MA Real EstateMay 2014 Multi-family Housing Activity Report – Boston, MA Real Estate
May 2014 Multi-family Housing Activity Report – Boston, MA Real EstateUnit Realty Group
 
January 2014 Greater Boston Real Estate Market Trends Report
January 2014 Greater Boston Real Estate Market Trends ReportJanuary 2014 Greater Boston Real Estate Market Trends Report
January 2014 Greater Boston Real Estate Market Trends ReportUnit Realty Group
 
November 2013 Multi-family Housing Activity Report – Boston, MA Real Estate
November 2013 Multi-family Housing Activity Report – Boston, MA Real EstateNovember 2013 Multi-family Housing Activity Report – Boston, MA Real Estate
November 2013 Multi-family Housing Activity Report – Boston, MA Real EstateUnit Realty Group
 
October 2013 Multi-family Housing Activity Report – Boston, MA Real Estate
October 2013 Multi-family Housing Activity Report – Boston, MA Real EstateOctober 2013 Multi-family Housing Activity Report – Boston, MA Real Estate
October 2013 Multi-family Housing Activity Report – Boston, MA Real EstateUnit Realty Group
 
September 2013 Multifamily Housing Activity Report – Boston, MA Real Estate
September 2013 Multifamily Housing Activity Report – Boston, MA Real EstateSeptember 2013 Multifamily Housing Activity Report – Boston, MA Real Estate
September 2013 Multifamily Housing Activity Report – Boston, MA Real EstateUnit Realty Group
 
August 2013 Multifamily Housing Activity Report – Boston, MA Real Estate
August 2013 Multifamily Housing Activity Report – Boston, MA Real EstateAugust 2013 Multifamily Housing Activity Report – Boston, MA Real Estate
August 2013 Multifamily Housing Activity Report – Boston, MA Real EstateUnit Realty Group
 
July 2013 Multifamily Housing Activity Report – Boston, MA Real Estate
July 2013 Multifamily Housing Activity Report – Boston, MA Real EstateJuly 2013 Multifamily Housing Activity Report – Boston, MA Real Estate
July 2013 Multifamily Housing Activity Report – Boston, MA Real EstateUnit Realty Group
 
July 2013's Monthly Indicators report - Boston Real Estate Market Trends
July 2013's Monthly Indicators report - Boston Real Estate Market TrendsJuly 2013's Monthly Indicators report - Boston Real Estate Market Trends
July 2013's Monthly Indicators report - Boston Real Estate Market TrendsUnit Realty Group
 
June 2013 Multifamily Housing Activity Report – Boston, MA Real Estate
June 2013 Multifamily Housing Activity Report – Boston, MA Real EstateJune 2013 Multifamily Housing Activity Report – Boston, MA Real Estate
June 2013 Multifamily Housing Activity Report – Boston, MA Real EstateUnit Realty Group
 

More from Unit Realty Group (20)

September 2015 Greater Boston Real Estate Market Trends Report
September 2015 Greater Boston Real Estate Market Trends ReportSeptember 2015 Greater Boston Real Estate Market Trends Report
September 2015 Greater Boston Real Estate Market Trends Report
 
August 2015 Greater Boston Real Estate Market Trends Report
August 2015 Greater Boston Real Estate Market Trends ReportAugust 2015 Greater Boston Real Estate Market Trends Report
August 2015 Greater Boston Real Estate Market Trends Report
 
February 2015 Greater Boston Real Estate Market Trends Report
February 2015 Greater Boston Real Estate Market Trends ReportFebruary 2015 Greater Boston Real Estate Market Trends Report
February 2015 Greater Boston Real Estate Market Trends Report
 
January 2015′s Monthly Multi-family Housing Activity Report
January 2015′s Monthly Multi-family Housing Activity ReportJanuary 2015′s Monthly Multi-family Housing Activity Report
January 2015′s Monthly Multi-family Housing Activity Report
 
January 2015 Greater Boston Real Estate Market Trends Report
January 2015 Greater Boston Real Estate Market Trends ReportJanuary 2015 Greater Boston Real Estate Market Trends Report
January 2015 Greater Boston Real Estate Market Trends Report
 
December 2014 Greater Boston Real Estate Market Trends Report
December 2014 Greater Boston Real Estate Market Trends ReportDecember 2014 Greater Boston Real Estate Market Trends Report
December 2014 Greater Boston Real Estate Market Trends Report
 
November 2014 Greater Boston Real Estate Market Trends Report
November 2014 Greater Boston Real Estate Market Trends ReportNovember 2014 Greater Boston Real Estate Market Trends Report
November 2014 Greater Boston Real Estate Market Trends Report
 
November 2014 Multi-family Housing Activity Report – Boston, MA Real Estate
November 2014 Multi-family Housing Activity Report – Boston, MA Real EstateNovember 2014 Multi-family Housing Activity Report – Boston, MA Real Estate
November 2014 Multi-family Housing Activity Report – Boston, MA Real Estate
 
October 2014 Greater Boston Real Estate Market Trends Report
October 2014 Greater Boston Real Estate Market Trends ReportOctober 2014 Greater Boston Real Estate Market Trends Report
October 2014 Greater Boston Real Estate Market Trends Report
 
September 2014 Multi-family Housing Activity Report – Boston, MA Real Estate
September 2014 Multi-family Housing Activity Report – Boston, MA Real EstateSeptember 2014 Multi-family Housing Activity Report – Boston, MA Real Estate
September 2014 Multi-family Housing Activity Report – Boston, MA Real Estate
 
Boston By The Numbers - Boston Housing Stock (Report)
Boston By The Numbers - Boston Housing Stock (Report)Boston By The Numbers - Boston Housing Stock (Report)
Boston By The Numbers - Boston Housing Stock (Report)
 
May 2014 Multi-family Housing Activity Report – Boston, MA Real Estate
May 2014 Multi-family Housing Activity Report – Boston, MA Real EstateMay 2014 Multi-family Housing Activity Report – Boston, MA Real Estate
May 2014 Multi-family Housing Activity Report – Boston, MA Real Estate
 
January 2014 Greater Boston Real Estate Market Trends Report
January 2014 Greater Boston Real Estate Market Trends ReportJanuary 2014 Greater Boston Real Estate Market Trends Report
January 2014 Greater Boston Real Estate Market Trends Report
 
November 2013 Multi-family Housing Activity Report – Boston, MA Real Estate
November 2013 Multi-family Housing Activity Report – Boston, MA Real EstateNovember 2013 Multi-family Housing Activity Report – Boston, MA Real Estate
November 2013 Multi-family Housing Activity Report – Boston, MA Real Estate
 
October 2013 Multi-family Housing Activity Report – Boston, MA Real Estate
October 2013 Multi-family Housing Activity Report – Boston, MA Real EstateOctober 2013 Multi-family Housing Activity Report – Boston, MA Real Estate
October 2013 Multi-family Housing Activity Report – Boston, MA Real Estate
 
September 2013 Multifamily Housing Activity Report – Boston, MA Real Estate
September 2013 Multifamily Housing Activity Report – Boston, MA Real EstateSeptember 2013 Multifamily Housing Activity Report – Boston, MA Real Estate
September 2013 Multifamily Housing Activity Report – Boston, MA Real Estate
 
August 2013 Multifamily Housing Activity Report – Boston, MA Real Estate
August 2013 Multifamily Housing Activity Report – Boston, MA Real EstateAugust 2013 Multifamily Housing Activity Report – Boston, MA Real Estate
August 2013 Multifamily Housing Activity Report – Boston, MA Real Estate
 
July 2013 Multifamily Housing Activity Report – Boston, MA Real Estate
July 2013 Multifamily Housing Activity Report – Boston, MA Real EstateJuly 2013 Multifamily Housing Activity Report – Boston, MA Real Estate
July 2013 Multifamily Housing Activity Report – Boston, MA Real Estate
 
July 2013's Monthly Indicators report - Boston Real Estate Market Trends
July 2013's Monthly Indicators report - Boston Real Estate Market TrendsJuly 2013's Monthly Indicators report - Boston Real Estate Market Trends
July 2013's Monthly Indicators report - Boston Real Estate Market Trends
 
June 2013 Multifamily Housing Activity Report – Boston, MA Real Estate
June 2013 Multifamily Housing Activity Report – Boston, MA Real EstateJune 2013 Multifamily Housing Activity Report – Boston, MA Real Estate
June 2013 Multifamily Housing Activity Report – Boston, MA Real Estate
 

Recently uploaded

Goa Call Girls 8617370543 Call Girls In Goa By Russian Call Girl in goa
Goa Call Girls 8617370543 Call Girls In Goa By Russian Call Girl in goaGoa Call Girls 8617370543 Call Girls In Goa By Russian Call Girl in goa
Goa Call Girls 8617370543 Call Girls In Goa By Russian Call Girl in goaNitya salvi
 
BPTP THE AMAARIO For The Royals Of Tomorrow in Sector 37D Gurgaon Dwarka Expr...
BPTP THE AMAARIO For The Royals Of Tomorrow in Sector 37D Gurgaon Dwarka Expr...BPTP THE AMAARIO For The Royals Of Tomorrow in Sector 37D Gurgaon Dwarka Expr...
BPTP THE AMAARIO For The Royals Of Tomorrow in Sector 37D Gurgaon Dwarka Expr...ApartmentWala1
 
Kohinoor Teiko Hinjewadi Phase 2 Pune E-Brochure.pdf
Kohinoor Teiko Hinjewadi Phase 2 Pune  E-Brochure.pdfKohinoor Teiko Hinjewadi Phase 2 Pune  E-Brochure.pdf
Kohinoor Teiko Hinjewadi Phase 2 Pune E-Brochure.pdfManishSaxena95
 
9990771857 Call Girls Dwarka Sector 9 Delhi (Call Girls ) Delhi
9990771857 Call Girls Dwarka Sector 9 Delhi (Call Girls ) Delhi9990771857 Call Girls Dwarka Sector 9 Delhi (Call Girls ) Delhi
9990771857 Call Girls Dwarka Sector 9 Delhi (Call Girls ) Delhidelhimodel235
 
Call Girls In Krishna Nagar Delhi (Escort)↫8447779280↬@SHOT 1500- NIGHT 5500→...
Call Girls In Krishna Nagar Delhi (Escort)↫8447779280↬@SHOT 1500- NIGHT 5500→...Call Girls In Krishna Nagar Delhi (Escort)↫8447779280↬@SHOT 1500- NIGHT 5500→...
Call Girls In Krishna Nagar Delhi (Escort)↫8447779280↬@SHOT 1500- NIGHT 5500→...asmaqueen5
 
9990771857 Call Girls in Dwarka Sector 2 Delhi (Call Girls) Delhi
9990771857 Call Girls in Dwarka Sector 2 Delhi (Call Girls) Delhi9990771857 Call Girls in Dwarka Sector 2 Delhi (Call Girls) Delhi
9990771857 Call Girls in Dwarka Sector 2 Delhi (Call Girls) Delhidelhimodel235
 
Rohan Harita Tathawade Pune Brochure.pdf
Rohan Harita Tathawade Pune Brochure.pdfRohan Harita Tathawade Pune Brochure.pdf
Rohan Harita Tathawade Pune Brochure.pdfabbu831446
 
Purva Soukhyam in Guduvancheri Chennai.pdf
Purva Soukhyam in Guduvancheri Chennai.pdfPurva Soukhyam in Guduvancheri Chennai.pdf
Purva Soukhyam in Guduvancheri Chennai.pdfpritika141199
 
9990771857 Call Girls in Dwarka Sector 08 Delhi (Call Girls) Delhi
9990771857 Call Girls in Dwarka Sector 08 Delhi (Call Girls) Delhi9990771857 Call Girls in Dwarka Sector 08 Delhi (Call Girls) Delhi
9990771857 Call Girls in Dwarka Sector 08 Delhi (Call Girls) Delhidelhimodel235
 
The Gale at Godrej Park World Hinjewadi Pune Brochure.pdf
The Gale at Godrej Park World Hinjewadi Pune Brochure.pdfThe Gale at Godrej Park World Hinjewadi Pune Brochure.pdf
The Gale at Godrej Park World Hinjewadi Pune Brochure.pdfPrachiRudram
 
Yedi Mavi TOBB Zeytinburnu - Listing Turkey
Yedi Mavi TOBB Zeytinburnu - Listing TurkeyYedi Mavi TOBB Zeytinburnu - Listing Turkey
Yedi Mavi TOBB Zeytinburnu - Listing TurkeyListing Turkey
 
Call Girls in Karkardooma Delhi +91 84487779280}Woman Seeking Man in Delhi NCR
Call Girls in Karkardooma Delhi +91 84487779280}Woman Seeking Man in Delhi NCRCall Girls in Karkardooma Delhi +91 84487779280}Woman Seeking Man in Delhi NCR
Call Girls in Karkardooma Delhi +91 84487779280}Woman Seeking Man in Delhi NCRasmaqueen5
 
SVN Live 5.6.24 Weekly Property Broadcast
SVN Live 5.6.24 Weekly Property BroadcastSVN Live 5.6.24 Weekly Property Broadcast
SVN Live 5.6.24 Weekly Property BroadcastSVN International Corp.
 
Kolte Patil Kharadi Pune E Brochure.pdf
Kolte Patil Kharadi Pune E  Brochure.pdfKolte Patil Kharadi Pune E  Brochure.pdf
Kolte Patil Kharadi Pune E Brochure.pdfabbu831446
 
2k Shots ≽ 9205541914 ≼ Call Girls In Sainik Farm (Delhi)
2k Shots ≽ 9205541914 ≼ Call Girls In Sainik Farm (Delhi)2k Shots ≽ 9205541914 ≼ Call Girls In Sainik Farm (Delhi)
2k Shots ≽ 9205541914 ≼ Call Girls In Sainik Farm (Delhi)Delhi Call girls
 
Greater Vancouver Realtors Statistics Package April 2024
Greater Vancouver Realtors Statistics Package April 2024Greater Vancouver Realtors Statistics Package April 2024
Greater Vancouver Realtors Statistics Package April 2024VickyAulakh1
 
Parksville 96 Surrey Floor Plans May 2024
Parksville 96 Surrey Floor Plans May 2024Parksville 96 Surrey Floor Plans May 2024
Parksville 96 Surrey Floor Plans May 2024VickyAulakh1
 
9990771857 Call Girls in Dwarka Sector 10 Delhi (Call Girls) Delhi
9990771857 Call Girls in Dwarka Sector 10 Delhi (Call Girls) Delhi9990771857 Call Girls in Dwarka Sector 10 Delhi (Call Girls) Delhi
9990771857 Call Girls in Dwarka Sector 10 Delhi (Call Girls) Delhidelhimodel235
 
9990771857 Call Girls in Dwarka Sector 6 Delhi (Call Girls) Delhi
9990771857 Call Girls in Dwarka Sector 6 Delhi (Call Girls) Delhi9990771857 Call Girls in Dwarka Sector 6 Delhi (Call Girls) Delhi
9990771857 Call Girls in Dwarka Sector 6 Delhi (Call Girls) Delhidelhimodel235
 
9990771857 Call Girls in Dwarka Sector 1 Delhi (Call Girls) Delhi
9990771857 Call Girls in Dwarka Sector 1 Delhi (Call Girls) Delhi9990771857 Call Girls in Dwarka Sector 1 Delhi (Call Girls) Delhi
9990771857 Call Girls in Dwarka Sector 1 Delhi (Call Girls) Delhidelhimodel235
 

Recently uploaded (20)

Goa Call Girls 8617370543 Call Girls In Goa By Russian Call Girl in goa
Goa Call Girls 8617370543 Call Girls In Goa By Russian Call Girl in goaGoa Call Girls 8617370543 Call Girls In Goa By Russian Call Girl in goa
Goa Call Girls 8617370543 Call Girls In Goa By Russian Call Girl in goa
 
BPTP THE AMAARIO For The Royals Of Tomorrow in Sector 37D Gurgaon Dwarka Expr...
BPTP THE AMAARIO For The Royals Of Tomorrow in Sector 37D Gurgaon Dwarka Expr...BPTP THE AMAARIO For The Royals Of Tomorrow in Sector 37D Gurgaon Dwarka Expr...
BPTP THE AMAARIO For The Royals Of Tomorrow in Sector 37D Gurgaon Dwarka Expr...
 
Kohinoor Teiko Hinjewadi Phase 2 Pune E-Brochure.pdf
Kohinoor Teiko Hinjewadi Phase 2 Pune  E-Brochure.pdfKohinoor Teiko Hinjewadi Phase 2 Pune  E-Brochure.pdf
Kohinoor Teiko Hinjewadi Phase 2 Pune E-Brochure.pdf
 
9990771857 Call Girls Dwarka Sector 9 Delhi (Call Girls ) Delhi
9990771857 Call Girls Dwarka Sector 9 Delhi (Call Girls ) Delhi9990771857 Call Girls Dwarka Sector 9 Delhi (Call Girls ) Delhi
9990771857 Call Girls Dwarka Sector 9 Delhi (Call Girls ) Delhi
 
Call Girls In Krishna Nagar Delhi (Escort)↫8447779280↬@SHOT 1500- NIGHT 5500→...
Call Girls In Krishna Nagar Delhi (Escort)↫8447779280↬@SHOT 1500- NIGHT 5500→...Call Girls In Krishna Nagar Delhi (Escort)↫8447779280↬@SHOT 1500- NIGHT 5500→...
Call Girls In Krishna Nagar Delhi (Escort)↫8447779280↬@SHOT 1500- NIGHT 5500→...
 
9990771857 Call Girls in Dwarka Sector 2 Delhi (Call Girls) Delhi
9990771857 Call Girls in Dwarka Sector 2 Delhi (Call Girls) Delhi9990771857 Call Girls in Dwarka Sector 2 Delhi (Call Girls) Delhi
9990771857 Call Girls in Dwarka Sector 2 Delhi (Call Girls) Delhi
 
Rohan Harita Tathawade Pune Brochure.pdf
Rohan Harita Tathawade Pune Brochure.pdfRohan Harita Tathawade Pune Brochure.pdf
Rohan Harita Tathawade Pune Brochure.pdf
 
Purva Soukhyam in Guduvancheri Chennai.pdf
Purva Soukhyam in Guduvancheri Chennai.pdfPurva Soukhyam in Guduvancheri Chennai.pdf
Purva Soukhyam in Guduvancheri Chennai.pdf
 
9990771857 Call Girls in Dwarka Sector 08 Delhi (Call Girls) Delhi
9990771857 Call Girls in Dwarka Sector 08 Delhi (Call Girls) Delhi9990771857 Call Girls in Dwarka Sector 08 Delhi (Call Girls) Delhi
9990771857 Call Girls in Dwarka Sector 08 Delhi (Call Girls) Delhi
 
The Gale at Godrej Park World Hinjewadi Pune Brochure.pdf
The Gale at Godrej Park World Hinjewadi Pune Brochure.pdfThe Gale at Godrej Park World Hinjewadi Pune Brochure.pdf
The Gale at Godrej Park World Hinjewadi Pune Brochure.pdf
 
Yedi Mavi TOBB Zeytinburnu - Listing Turkey
Yedi Mavi TOBB Zeytinburnu - Listing TurkeyYedi Mavi TOBB Zeytinburnu - Listing Turkey
Yedi Mavi TOBB Zeytinburnu - Listing Turkey
 
Call Girls in Karkardooma Delhi +91 84487779280}Woman Seeking Man in Delhi NCR
Call Girls in Karkardooma Delhi +91 84487779280}Woman Seeking Man in Delhi NCRCall Girls in Karkardooma Delhi +91 84487779280}Woman Seeking Man in Delhi NCR
Call Girls in Karkardooma Delhi +91 84487779280}Woman Seeking Man in Delhi NCR
 
SVN Live 5.6.24 Weekly Property Broadcast
SVN Live 5.6.24 Weekly Property BroadcastSVN Live 5.6.24 Weekly Property Broadcast
SVN Live 5.6.24 Weekly Property Broadcast
 
Kolte Patil Kharadi Pune E Brochure.pdf
Kolte Patil Kharadi Pune E  Brochure.pdfKolte Patil Kharadi Pune E  Brochure.pdf
Kolte Patil Kharadi Pune E Brochure.pdf
 
2k Shots ≽ 9205541914 ≼ Call Girls In Sainik Farm (Delhi)
2k Shots ≽ 9205541914 ≼ Call Girls In Sainik Farm (Delhi)2k Shots ≽ 9205541914 ≼ Call Girls In Sainik Farm (Delhi)
2k Shots ≽ 9205541914 ≼ Call Girls In Sainik Farm (Delhi)
 
Greater Vancouver Realtors Statistics Package April 2024
Greater Vancouver Realtors Statistics Package April 2024Greater Vancouver Realtors Statistics Package April 2024
Greater Vancouver Realtors Statistics Package April 2024
 
Parksville 96 Surrey Floor Plans May 2024
Parksville 96 Surrey Floor Plans May 2024Parksville 96 Surrey Floor Plans May 2024
Parksville 96 Surrey Floor Plans May 2024
 
9990771857 Call Girls in Dwarka Sector 10 Delhi (Call Girls) Delhi
9990771857 Call Girls in Dwarka Sector 10 Delhi (Call Girls) Delhi9990771857 Call Girls in Dwarka Sector 10 Delhi (Call Girls) Delhi
9990771857 Call Girls in Dwarka Sector 10 Delhi (Call Girls) Delhi
 
9990771857 Call Girls in Dwarka Sector 6 Delhi (Call Girls) Delhi
9990771857 Call Girls in Dwarka Sector 6 Delhi (Call Girls) Delhi9990771857 Call Girls in Dwarka Sector 6 Delhi (Call Girls) Delhi
9990771857 Call Girls in Dwarka Sector 6 Delhi (Call Girls) Delhi
 
9990771857 Call Girls in Dwarka Sector 1 Delhi (Call Girls) Delhi
9990771857 Call Girls in Dwarka Sector 1 Delhi (Call Girls) Delhi9990771857 Call Girls in Dwarka Sector 1 Delhi (Call Girls) Delhi
9990771857 Call Girls in Dwarka Sector 1 Delhi (Call Girls) Delhi
 

December 2013 Greater Boston Real Estate Market Trends Report

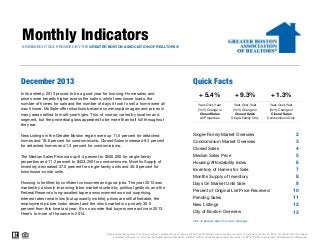
  • 1. Monthly Indicators A RESEARCH TOOL PROVIDED BY THE GREATER BOSTON ASSOCIATION OF REALTORS® December 2013 Quick Facts In its entirety, 2013 proved to be a good year for housing. Home sales and prices were broadly higher across the nation, while foreclosure loads, the number of homes for sale and the number of days it took to sell a home were all much lower. Multiple-offer situations became commonplace again and prices in many areas rallied to multi-year highs. This, of course, varied by location and segment, but the proverbial glass appeared to be more than half full throughout the year. + 5.4% + 9.3% + 1.3% Year-Over-Year (YoY) Change in Closed Sales All Properties Year-Over-Year (YoY) Change in Closed Sales Single-Family Only Year-Over-Year (YoY) Change in Closed Sales Condominium Only New Listings in the Greater Boston region were up 11.5 percent for detached homes and 18.6 percent for condominiums. Closed Sales increased 9.3 percent for detached homes and 1.3 percent for condominiums. Single-Family Market Overview The Median Sales Price was up 6.4 percent to $500,000 for single-family properties and 11.2 percent to $423,250 for condominiums. Months Supply of Inventory decreased 37.0 percent for single-family units and 30.8 percent for townhouse-condo units. Median Sales Price Condominium Market Overview Closed Sales Housing Affordability Index Inventory of Homes for Sale Months Supply of Inventory Housing is fortified by confident consumers and good jobs. The year 2013 was marked by a slowly improving labor market stunted by political gridlock, and the Federal Reserve's long-awaited taper announcement was not surprising. Interest rates remain low (but upwardly mobile), prices are still affordable, the employment picture looks decent and the stock market is up nearly 30.0 percent from this time last year. It's no wonder that buyers were active in 2013. Here's to more of the same in 2014. Days On Market Until Sale Percent of Original List Price Received Pending Sales New Listings City of Boston Overview 2 3 4 5 6 7 8 9 10 11 12 13 Click on desired metric to jump to that page. Data is refreshed regularly to capture changes in market activity so figures shown may be different than previously reported. Current as of January 16, 2014. All data from MLS Property Information Network, Inc. Provided by Greater Boston Association of REALTORS® and the Massachusetts Association of REALTORS®. Powered by 10K Research and Marketing.
  • 2. Single-Family Market Overview Key market metrics for the current month and year-to-date figures for Single-Family Homes Only. Key Metrics Historical Sparklines Dec-2012 Dec-2013 Closed Sales +/– YTD 2012 YTD 2013 +/– 819 12-2012 12 2012 12-2011 12-2012 12-2011 12-2012 12-2011 12-2012 12-2011 12-2012 12-2011 12-2012 - 31.2% -- -- -- 1.8 - 37.0% -- -- -- 69 - 28.6% 98 68 - 30.5% 95.9% + 1.8% 94.4% 97.0% + 2.8% 510 + 1.2% 10,871 11,619 + 6.9% 396 + 11.5% 14,394 14,701 + 2.1% 12-2013 New Listings 12-2010 1,613 12-2013 Pending Sales 12-2010 - 12.7% 12-2013 Percent of Original List Price Received 12-2010 100 12-2013 Days on Market Until Sale 12-2010 115 12-2013 12 2013 Months Supply of Inventory 12-2010 - 11.9% 355 12-2011 12 2011 99 12-2013 Inventory of Homes for Sale 12-2010 12 2010 + 7.6% 504 12-2012 $495,000 94.2% 12-2011 $459,900 12-2013 Housing Affordability Index 12-2010 + 6.4% 97 12-2012 $500,000 2.9 12-2011 + 6.9% 12-2013 Median Sales Price 12-2010 11,442 2,343 12-2012 10,707 113 12-2011 + 9.3% $470,000 12-2010 895 12-2013 All data from MLS Property Information Network, Inc. Provided by the Greater Boston Association of REALTORS® and the Massachusetts Association of REALTORS®. Powered by 10K Research and Marketing. | Click for Cover Page | 2
  • 3. Condominium Market Overview Key market metrics for the current month and year-to-date figures for Condominium Properties Only. Key Metrics Historical Sparklines Dec-2012 Dec-2013 Closed Sales +/– YTD 2012 YTD 2013 +/– 766 12-2012 12 2012 12-2011 12-2012 12-2011 12-2012 12-2011 12-2012 12-2011 12-2012 12-2011 12-2012 - 29.9% -- -- -- 1.4 - 30.8% -- -- -- 55 - 35.0% 87 53 - 38.8% 98.1% + 1.9% 95.8% 98.9% + 3.2% 441 - 3.9% 9,811 10,595 + 8.0% 364 + 18.6% 12,229 12,676 + 3.7% 12-2013 New Listings 12-2010 1,073 12-2013 Pending Sales 12-2010 - 12.2% 12-2013 Percent of Original List Price Received 12-2010 120 12-2013 Days on Market Until Sale 12-2010 137 12-2013 12 2013 Months Supply of Inventory 12-2010 - 15.2% 307 12-2011 12 2011 116 12-2013 Inventory of Homes for Sale 12-2010 12 2010 + 6.9% 459 12-2012 $405,000 96.2% 12-2011 $379,000 12-2013 Housing Affordability Index 12-2010 + 11.2% 84 12-2012 $423,250 2.0 12-2011 + 7.4% 12-2013 Median Sales Price 12-2010 10,370 1,531 12-2012 9,655 137 12-2011 + 1.3% $380,500 12-2010 776 12-2013 All data from MLS Property Information Network, Inc. Provided by the Greater Boston Association of REALTORS® and the Massachusetts Association of REALTORS®. Powered by 10K Research and Marketing. | Click for Cover Page | 3
  • 4. Closed Sales A count of the actual sales that have closed in a given month. December Year to Date Single-Family YoY Change Condominium YoY Change Jan-2013 643 7,918 - 4.0% 628 + 3.5% 778 + 4.9% 806 + 6.5% 1,108 + 10.5% 1,069 + 5.9% Jun-2013 9,655 8,958 622 Apr-2013 10,370 + 13.3% May-2013 10,707 + 24.8% 435 Mar-2013 11,442 776 514 - 7.6% 1,489 - 0.9% 1,248 - 1.2% 1,491 + 17.4% 1,255 + 20.9% Aug-2013 766 + 15.1% 428 Jul-2013 819 736 601 Feb-2013 895 1,441 + 11.6% 1,276 + 6.2% Sep-2013 2012 2013 +11.3% +9.3% Single-Family 2011 2012 2013 +19.1% +1.3% Condominium 2011 2012 2013 +19.5% +6.9% Single-Family 2011 2012 +21.9% +7.4% 891 + 19.1% + 10.3% 764 + 7.3% 796 - 11.8% 708 - 6.5% Dec-2013 2013 + 22.0% 867 Nov-2013 2011 926 Oct-2013 895 + 9.3% 776 + 1.3% 11,442 + 6.9% 10,370 + 7.4% Total Condominium Historical Closed Sales Activity Single-Family Condominium 1,800 1,600 1,400 1,200 1,000 800 600 400 200 Jan-2003 Jan-2004 Jan-2005 Jan-2006 Jan-2007 Jan-2008 Jan-2009 Jan-2010 Jan-2011 Jan-2012 Jan-2013 All data from MLS Property Information Network, Inc. Provided by the Greater Boston Association of REALTORS® and the Massachusetts Association of REALTORS®. Powered by 10K Research and Marketing. | Click for Cover Page | 4
  • 5. Median Sales Price Median price point for all closed sales, not accounting for seller concessions, in a given month. December Year to Date +6.7% +6.4% Single-Family +10.3% +11.2% Condominium $405,000 + 19.1% + 14.2% $387,500 + 4.5% May-2013 $499,000 + 7.3% $410,000 + 7.6% $542,000 + 7.9% $420,000 + 5.0% $532,250 + 4.4% $400,000 + 3.4% $520,000 + 6.1% $415,500 + 9.3% $500,500 + 16.4% $410,000 + 9.3% $468,000 + 8.5% $416,750 + 13.9% Nov-2013 2013 + 2.5% $476,500 Oct-2013 $360,000 2012 $425,100 Sep-2013 2011 - 5.4% Aug-2013 2013 + 4.0% $350,000 Jul-2013 $380,500 2012 $369,250 + 8.8% $475,000 + 6.4% $410,250 + 8.0% Dec-2013 $500,000 + 6.4% $423,250 + 11.2% Median $495,000 + 7.6% $405,000 + 6.9% $405,000 $345,000 2011 + 6.2% Apr-2013 $423,250 $430,000 $429,850 Mar-2013 $452,500 $459,900 YoY Change Jun-2013 $470,000 $440,458 Condominium Feb-2013 $495,000 YoY Change Jan-2013 $500,000 Single-Family 2011 2012 2013 +1.6% +7.6% Single-Family 2011 $379,000 2012 2013 +5.3% +6.9% Condominium Historical Median Sales Price Single-Family Condominium $550,000 $500,000 $450,000 $400,000 $350,000 $300,000 $250,000 Jan-2003 Jan-2004 Jan-2005 Jan-2006 Jan-2007 Jan-2008 Jan-2009 Jan-2010 Jan-2011 Jan-2012 Jan-2013 All data from MLS Property Information Network, Inc. Provided by the Greater Boston Association of REALTORS® and the Massachusetts Association of REALTORS®. Powered by 10K Research and Marketing. | Click for Cover Page | 5
  • 6. Housing Affordability Index This index measures housing affordability for the region. An index of 120 means the median household income was 120% of what is necessary to qualify for the median-priced home under prevailing interest rates. A higher number means greater affordability. December Year to Date +6.9% -11.9% Single-Family 2011 2012 2013 +3.7% 2011 -15.2% 2013 +11.4% Condominium 2012 -12.7% Single-Family 2011 2012 2013 +7.9% -12.2% + 4.5% 128 - 8.8% 112 - 5.3% 136 + 2.7% 104 - 4.8% 124 - 5.0% 90 - 11.6% 114 - 9.2% 92 - 9.4% 120 - 8.4% 93 - 11.6% 115 - 13.8% 98 - 19.0% 118 - 14.0% 104 - 13.1% 116 - 16.6% Nov-2013 2013 123 Oct-2013 2012 Mar-2013 Sep-2013 2011 + 11.2% Aug-2013 100 + 5.6% 146 Jul-2013 103 99 143 - 2.0% Apr-2013 120 115 + 3.7% Jun-2013 113 125 122 May-2013 105 127 116 Condominium Feb-2013 137 137 YoY Change Jan-2013 132 Single-Family YoY Change 109 - 6.4% 125 - 7.6% Dec-2013 99 - 11.9% 116 - 15.2% Average 106 -7.2% 125 -6.6% Condominium Historical Housing Affordability Index Single-Family Condominium 160 150 140 130 120 110 100 90 80 70 60 Jan-2004 Jan-2005 Jan-2006 Jan-2007 Jan-2008 Jan-2009 Jan-2010 Jan-2011 Jan-2012 Jan-2013 All data from MLS Property Information Network, Inc. Provided by the Greater Boston Association of REALTORS® and the Massachusetts Association of REALTORS®. Powered by 10K Research and Marketing. | Click for Cover Page | 6
  • 7. Inventory of Homes for Sale The number of properties available for sale in active status at the end of a given month. December Single-Family - 42.4% 1,706 - 41.8% 2,420 - 40.6% 1,736 - 47.3% 2,813 - 34.9% 1,977 - 40.4% 3,086 - 30.8% 2,075 - 35.3% Jun-2013 3,084 - 26.7% 2,031 - 32.0% Jul-2013 2,905 - 25.3% 1,857 - 32.7% Aug-2013 2,793 - 23.8% 1,727 - 29.4% Sep-2013 3,002 - 21.5% 1,928 - 24.3% Oct-2013 1,073 1,593 - 32.5% Apr-2013 1,531 - 30.6% May-2013 1,613 2,345 2,453 Mar-2013 2,343 YoY Change Feb-2013 2,685 Condominium Jan-2013 3,414 YoY Change 2,847 - 19.5% 1,828 - 21.9% Nov-2013 2011 2012 -31.4% Single-Family 2011 -31.2% 2,315 - 23.7% 1,465 - 27.3% 2012 2013 Dec-2013 1,613 - 31.2% 1,073 - 29.9% -43.0% Condominium 2013 -29.9% Average 2,640 - 28.6% 1,750 - 34.7% Historical Inventory of Homes for Sale Single-Family Condominium 9,000 8,000 7,000 6,000 5,000 4,000 3,000 2,000 1,000 Jan-2003 Jan-2004 Jan-2005 Jan-2006 Jan-2007 Jan-2008 Jan-2009 Jan-2010 Jan-2011 Jan-2012 Jan-2013 All data from MLS Property Information Network, Inc. Provided by the Greater Boston Association of REALTORS® and the Massachusetts Association of REALTORS®. Powered by 10K Research and Marketing. | Click for Cover Page | 7
  • 8. Months Supply of Inventory The inventory of homes for sale at the end of a given month, divided by the average monthly pending sales from the last 12 months. December Single-Family - 53.8% 3.9 - 48.6% 3.9 - 38.1% 2.8 - 49.0% 3.6 - 37.9% 2.5 - 44.0% 2.8 - 37.4% 1.9 - 38.9% Jun-2013 2.1 - 26.1% 1.6 - 31.2% Jul-2013 1.9 - 36.3% 1.5 - 44.3% Aug-2013 1.9 - 31.7% 1.4 - 33.5% Sep-2013 3.2 - 35.6% 2.2 - 36.5% Oct-2013 1.4 3.1 - 27.0% May-2013 1.8 - 39.7% Apr-2013 2.0 3.9 5.7 Mar-2013 2.9 YoY Change Feb-2013 4.2 Condominium Jan-2013 4.6 YoY Change 3.3 - 27.0% 2.4 - 27.2% Nov-2013 2011 2012 -38.3% Single-Family 2011 -37.0% 2.9 - 13.6% 2.1 - 22.3% 2012 2013 Dec-2013 1.8 - 37.0% 1.4 - 30.8% -52.1% Condominium 2013 -30.8% Average 2.9 - 36.9% 2.1 - 44.3% Historical Months Supply of Inventory Single-Family Condominium 16 14 12 10 8 6 4 2 0 Jan-2004 Jan-2005 Jan-2006 Jan-2007 Jan-2008 Jan-2009 Jan-2010 Jan-2011 Jan-2012 Jan-2013 All data from MLS Property Information Network, Inc. Provided by the Greater Boston Association of REALTORS® and the Massachusetts Association of REALTORS®. Powered by 10K Research and Marketing. | Click for Cover Page | 8
  • 9. Days on Market Until Sale Average number of days between when a property is listed and when an offer is accepted in a given month. December Year to Date 2011 2012 2013 -12.7% -28.6% Single-Family 2011 2012 2013 -30.0% -35.0% Condominium 2011 2012 2013 -5.8% -30.5% Single-Family 2011 2012 -17.7% - 35.1% 74 - 22.2% 51 - 40.3% 56 - 37.6% 43 - 42.3% 47 - 41.7% 38 - 46.3% 49 - 44.3% 40 - 47.6% 58 - 35.1% 50 - 41.0% 59 - 33.8% 47 - 44.4% 65 - 26.8% 51 - 33.4% 69 - 28.6% 55 - 35.0% Total -38.8% - 39.1% 63 Dec-2013 2013 71 - 22.1% Nov-2013 55 - 17.8% 94 Oct-2013 53 107 Sep-2013 69 - 22.5% Jul-2013 68 - 29.1% 96 Aug-2013 84 88 - 17.0% Jun-2013 97 - 16.4% Apr-2013 87 109 111 May-2013 111 YoY Change Mar-2013 98 Condominium Feb-2013 105 104 YoY Change Jan-2013 120 Single-Family 68 - 30.5% 51 - 37.0% Condominium Historical Days on Market Until Sale Single-Family Condominium 150 130 110 90 70 50 30 Jan-2003 Jan-2004 Jan-2005 Jan-2006 Jan-2007 Jan-2008 Jan-2009 Jan-2010 Jan-2011 Jan-2012 Jan-2013 All data from MLS Property Information Network, Inc. Provided by the Greater Boston Association of REALTORS® and the Massachusetts Association of REALTORS®. Powered by 10K Research and Marketing. | Click for Cover Page | 9
  • 10. Percent of Original List Price Received Percentage found when dividing a property’s sales price by its original list price, then taking the average for all properties sold in a given month, not accounting for seller concessions. December Year to Date +2.3% +1.8% Single-Family 2012 2013 +3.4% +1.9% Condominium 2011 2012 2013 +1.4% +2.8% Single-Family 2011 2013 +2.0% +3.2% + 2.4% 97.6% + 3.8% + 3.4% 98.8% + 3.3% 97.8% + 2.6% 99.5% + 3.5% 98.4% + 3.2% 99.7% + 3.5% 98.1% + 2.4% 99.9% + 3.5% 97.9% + 3.2% 99.6% + 3.5% 97.3% + 2.9% 99.0% + 2.6% 97.2% + 3.0% 98.8% + 3.1% 96.3% + 1.7% 98.8% + 2.8% Dec-2013 2012 95.2% 96.7% Nov-2013 2011 Mar-2013 Oct-2013 2013 + 3.5% Sep-2013 2012 + 3.1% 96.6% Aug-2013 2011 95.8% + 3.1% Jul-2013 94.0% 95.8% + 3.7% Jun-2013 97.0% 93.1% 94.4% 93.8% 94.1% May-2013 93.0% YoY Change Apr-2013 95.9% 92.1% 94.2% Condominium Feb-2013 98.9% YoY Change Jan-2013 96.2% 98.1% Single-Family 95.9% + 1.8% 98.1% + 1.9% Average 97.0% + 2.8% 98.9% + 3.2% Condominium Historical Percent of Original List Price Received Single-Family Condominium 101% 99% 97% 95% 93% 91% 89% Jan-2003 Jan-2004 Jan-2005 Jan-2006 Jan-2007 Jan-2008 Jan-2009 Jan-2010 Jan-2011 Jan-2012 Jan-2013 All data from MLS Property Information Network, Inc. Provided by the Greater Boston Association of REALTORS® and the Massachusetts Association of REALTORS®. Powered by 10K Research and Marketing. | Click for Cover Page | 10
  • 11. Pending Sales A count of the properties in UAG status between the first and last day in a given month, regardless of current status (based on Off Market Date). December Year to Date Single-Family YoY Change Condominium YoY Change Jan-2013 474 504 459 414 10,871 441 9,811 9,091 7,952 + 18.8% 712 - 4.6% 1,183 + 2.7% 1,166 + 9.3% Apr-2013 10,595 657 - 5.8% Mar-2013 11,619 + 2.8% 713 1,389 + 12.5% 1,272 + 8.9% May-2013 510 626 Feb-2013 1,490 + 15.7% 1,263 + 7.0% Jun-2013 1,292 + 9.8% 1,093 + 10.1% Jul-2013 991 + 5.0% 960 + 20.5% Aug-2013 899 + 15.1% 765 + 4.9% Sep-2013 2012 2013 +6.3% +1.2% Single-Family 2011 2012 2013 +10.9% -3.9% Condominium 2011 2012 2013 +19.6% +6.9% Single-Family 2011 2012 +23.4% +8.0% 793 + 8.2% + 9.3% 823 + 4.2% 718 + 4.7% 650 + 9.1% Dec-2013 2013 - 1.3% 955 Nov-2013 2011 853 Oct-2013 510 + 1.2% 441 - 3.9% 11,619 + 6.9% 10,595 + 8.0% Total Condominium Historical Pending Sales Activity Single-Family Condominium 2,200 2,000 1,800 1,600 1,400 1,200 1,000 800 600 400 200 Jan-2003 Jan-2004 Jan-2005 Jan-2006 Jan-2007 Jan-2008 Jan-2009 Jan-2010 Jan-2011 Jan-2012 Jan-2013 All data from MLS Property Information Network, Inc. Provided by the Greater Boston Association of REALTORS® and the Massachusetts Association of REALTORS®. Powered by 10K Research and Marketing. | Click for Cover Page | 11
  • 12. New Listings A count of the properties that have been newly listed on the market in a given month. December Year to Date YoY Change Single-Family Condominium YoY Change Jan-2013 Mar-2013 1,356 - 30.5% 1,344 - 21.1% 2,009 + 14.3% 1,664 + 13.6% 2,002 + 14.3% 1,539 + 12.9% 1,522 + 15.1% 1,228 + 8.4% 1,131 + 12.9% 998 + 12.5% Aug-2013 307 - 14.7% Jul-2013 12,229 12,676 - 2.5% 952 May-2013 364 355 907 - 21.7% Apr-2013 13,403 383 - 5.6% 998 Jun-2013 396 883 Feb-2013 14,794 14,394 14,701 447 1,043 + 6.1% 867 + 11.2% Sep-2013 2012 2013 -20.6% +11.5% Single-Family 2011 2012 2013 -19.8% +18.6% Condominium 2011 2012 2013 -2.7% +2.1% Single-Family 2011 2012 -8.8% +3.7% 1,252 + 10.8% + 17.6% 1,008 + 17.1% 661 + 4.8% 553 0.0% Dec-2013 2013 + 6.3% 1,231 Nov-2013 2011 1,469 Oct-2013 396 + 11.5% 364 + 18.6% 14,701 + 2.1% 12,676 + 3.7% Total Condominium Historical New Listing Activity Single-Family Condominium 2,750 2,500 2,250 2,000 1,750 1,500 1,250 1,000 750 500 250 0 Jan-2003 Jan-2004 Jan-2005 Jan-2006 Jan-2007 Jan-2008 Jan-2009 Jan-2010 Jan-2011 Jan-2012 Jan-2013 All data from MLS Property Information Network, Inc. Provided by the Greater Boston Association of REALTORS® and the Massachusetts Association of REALTORS®. Powered by 10K Research and Marketing. | Click for Cover Page | 12
  • 13. City of Boston – Market Overview Key market metrics for the current month and year-to-date figures for the City of Boston. Key Metrics Historical Sparklines Dec-2012 Dec-2013 Closed Sales +/– YTD 2012 YTD 2013 +/– 426 12-2012 12 2012 12-2011 12-2012 12-2011 12-2012 12-2011 12-2012 12-2011 12-2012 12-2011 12-2012 - 20.9% -- -- -- 1.2 - 26.2% -- -- -- 57 - 25.5% 82 47 - 42.4% 97.3% + 1.7% 95.6% 98.6% + 3.1% 254 + 5.8% 5,462 5,804 + 6.3% 213 + 40.1% 6,827 7,106 + 4.1% 12-2013 New Listings 12-2010 554 12-2013 Pending Sales 12-2010 - 12.7% 12-2013 Percent of Original List Price Received 12-2010 100 12-2013 Days on Market Until Sale 12-2010 115 12-2013 12 2013 Months Supply of Inventory 12-2010 - 11.9% 152 12-2011 12 2011 99 12-2013 Inventory of Homes for Sale 12-2010 12 2010 + 9.7% 240 12-2012 $439,000 95.6% 12-2011 $400,000 12-2013 Housing Affordability Index 12-2010 + 12.8% 76 12-2012 $451,000 1.6 12-2011 + 4.7% 12-2013 Median Sales Price 12-2010 5,677 700 12-2012 5,421 113 12-2011 + 7.3% $400,000 12-2010 457 12-2013 All data from MLS Property Information Network, Inc. Provided by the Greater Boston Association of REALTORS® and the Massachusetts Association of REALTORS®. Powered by 10K Research and Marketing. | Click for Cover Page | 13