SlideShare ist ein Scribd-Unternehmen logo
1 von 4
Cross Metrics WTD Report Daily Instructions
1. Log on to ShopperTrak → https://portal.shoppertrak.com/st-site/loginform.html?login_error=
2. Click on the Retail Metrics tab located on the left hand side.
3. Click on the Cross Metrics Cmpr by Per report in the dropdown box.
4. The top section of the Cross Metrics Comparison by Period report should replicate the
following. In the ‘Select Hierarchy’ dropdown box, select Division. Division should be selected
under ‘Select Sites.’ Click on Claire’s – ensure that it is highlighted blue. The ‘Reporting Level’
should be by Store. Lastly, ‘Enable Comp’ should be checked.
5. Ensure the ‘Report Period’ and ‘Compare Period’ is correct.
6. Make sure the ‘Group/Show Report Data’ is by ‘Day,’ as seen below. Then, ensure the ‘Output
Type’ is CSV. When finished, run report. The report will be exported into an Excel file.
7. Copy the Cross Metrics Comparison by Period data from the Excel file.
8. Open the current Cross Metrics Claries WTD report.
9. Paste the copied data into the last tab of the Cross Metrics Claries WTD report.
10. Return to the Cross Metrics Comparison by Period report in ShopperTrak for Quebec data.
11. The top section of the Cross Metrics Comparison by Period report for Quebec should replicate the
following. In the ‘Select Hierarchy’ dropdown box, select Quebec. Corporate should be selected
under ‘Select Sites.’ Click on Quebec – ensure that it is highlighted blue. The ‘Reporting Level’
should be by Store. Lastly, ‘Enable Comp’ should be checked.
12. The ‘Report Period’ and ‘Compare Period’ remain the same. In addition, the ‘Group/Show Report
Data’ is still by ‘Day’ and the ‘Output Type’ is still CSV. When finished, run report.
13. Copy Quebec’s Cross Metrics Comparison by Period data from the Excel file.
14. Paste this data into the last tab of the Cross Metrics Claries WTD report underneath the other data.
15. Sort the data in the last tab of the Cross Metrics Claries WTD report by Period, Column A, then by
Store Number/Geography, Column B. Both should be ascending.
16. Copy data from the last tab of the Cross Metrics Claries WTD and paste it in the appropriate tab.
[Example: Sunday data into the Sunday tab]. Caution: When copying and pasting data, ensure
there are enough rows for all the data. We want to avoid overlapping the data and formulas.
17. Sort the data in the tab by Current Traffic, Column C, ascending. If there are stores with zero
traffic, move them to the bottom of the spreadsheet.
18. Then, sort the data by LY Traffic, Column D, ascending. If there are stores with zero traffic, move
them to the bottom of the spreadsheet.
19. Check for any other abnormal numbers in the data. Move any of these stores to the bottom of the
spreadsheet. Here is an example of data at the bottom of the spreadsheet.
20. Repeat these steps for each day, everyday of the week.
21. Repeat these same steps for the Cross Metrics Icing WTD report. Except, choose Icing instead of
Claries, and exclude any Quebec store steps.
Cross Metrics WTD Report Daily Instructions

Weitere ähnliche Inhalte

Andere mochten auch

Andere mochten auch (6)

Claires Internship Journal
Claires Internship JournalClaires Internship Journal
Claires Internship Journal
 
Our way
Our wayOur way
Our way
 
Kalkvik, Project Assignment
Kalkvik, Project AssignmentKalkvik, Project Assignment
Kalkvik, Project Assignment
 
L.G.B.T
L.G.B.TL.G.B.T
L.G.B.T
 
SALES_COACHING_BROCHURE_final
SALES_COACHING_BROCHURE_finalSALES_COACHING_BROCHURE_final
SALES_COACHING_BROCHURE_final
 
CHIẾN DỊCH TÌNH NGUYỆN
CHIẾN DỊCH TÌNH NGUYỆNCHIẾN DỊCH TÌNH NGUYỆN
CHIẾN DỊCH TÌNH NGUYỆN
 

Cross Metrics WTD Report Daily Instructions

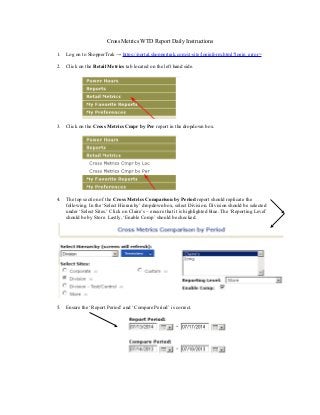
  • 1. Cross Metrics WTD Report Daily Instructions 1. Log on to ShopperTrak → https://portal.shoppertrak.com/st-site/loginform.html?login_error= 2. Click on the Retail Metrics tab located on the left hand side. 3. Click on the Cross Metrics Cmpr by Per report in the dropdown box. 4. The top section of the Cross Metrics Comparison by Period report should replicate the following. In the ‘Select Hierarchy’ dropdown box, select Division. Division should be selected under ‘Select Sites.’ Click on Claire’s – ensure that it is highlighted blue. The ‘Reporting Level’ should be by Store. Lastly, ‘Enable Comp’ should be checked. 5. Ensure the ‘Report Period’ and ‘Compare Period’ is correct.
  • 2. 6. Make sure the ‘Group/Show Report Data’ is by ‘Day,’ as seen below. Then, ensure the ‘Output Type’ is CSV. When finished, run report. The report will be exported into an Excel file. 7. Copy the Cross Metrics Comparison by Period data from the Excel file. 8. Open the current Cross Metrics Claries WTD report. 9. Paste the copied data into the last tab of the Cross Metrics Claries WTD report. 10. Return to the Cross Metrics Comparison by Period report in ShopperTrak for Quebec data. 11. The top section of the Cross Metrics Comparison by Period report for Quebec should replicate the following. In the ‘Select Hierarchy’ dropdown box, select Quebec. Corporate should be selected under ‘Select Sites.’ Click on Quebec – ensure that it is highlighted blue. The ‘Reporting Level’ should be by Store. Lastly, ‘Enable Comp’ should be checked. 12. The ‘Report Period’ and ‘Compare Period’ remain the same. In addition, the ‘Group/Show Report Data’ is still by ‘Day’ and the ‘Output Type’ is still CSV. When finished, run report.
  • 3. 13. Copy Quebec’s Cross Metrics Comparison by Period data from the Excel file. 14. Paste this data into the last tab of the Cross Metrics Claries WTD report underneath the other data. 15. Sort the data in the last tab of the Cross Metrics Claries WTD report by Period, Column A, then by Store Number/Geography, Column B. Both should be ascending. 16. Copy data from the last tab of the Cross Metrics Claries WTD and paste it in the appropriate tab. [Example: Sunday data into the Sunday tab]. Caution: When copying and pasting data, ensure there are enough rows for all the data. We want to avoid overlapping the data and formulas. 17. Sort the data in the tab by Current Traffic, Column C, ascending. If there are stores with zero traffic, move them to the bottom of the spreadsheet. 18. Then, sort the data by LY Traffic, Column D, ascending. If there are stores with zero traffic, move them to the bottom of the spreadsheet. 19. Check for any other abnormal numbers in the data. Move any of these stores to the bottom of the spreadsheet. Here is an example of data at the bottom of the spreadsheet. 20. Repeat these steps for each day, everyday of the week. 21. Repeat these same steps for the Cross Metrics Icing WTD report. Except, choose Icing instead of Claries, and exclude any Quebec store steps.