Sustainable Cotton Production for the Humid South
•
3 likes•3,976 views

Sustainable Cotton Production for the Humid South

Recommended
Recommended
More Related Content
What's hot
What's hot (17)
Viewers also liked
Viewers also liked (8)
Similar to Sustainable Cotton Production for the Humid South
Similar to Sustainable Cotton Production for the Humid South (20)
More from ElisaMendelsohn
More from ElisaMendelsohn (20)
Recently uploaded
Recently uploaded (20)
Sustainable Cotton Production for the Humid South
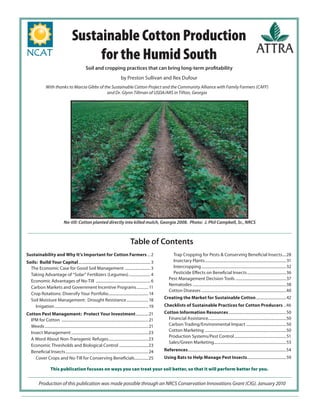
- 1. Sustainable Cotton Production for the Humid South Soil and cropping practices that can bring long-term profitability by Preston Sullivan and Rex Dufour With thanks to Marcia Gibbs of the Sustainable Cotton Project and the Community Alliance with Family Farmers (CAFF) and Dr. Glynn Tillman of USDA/ARS in Tifton, Georgia No-till: Cotton planted directly into killed mulch, Georgia 2008. Photo: J. Phil Campbell, Sr., NRCS Table of Contents Sustainability and Why It’s Important for Cotton Farmers ... 2 Trap Cropping for Pests & Conserving Beneficial Insects....28 Soils: Build Your Capital .......................................................................... 3 Insectary Plants ................................................................................... 31 The Economic Case for Good Soil Management .......................... 3 Intercropping .......................................................................................32 Taking Advantage of “Solar” Fertilizers (Legumes) ...................... 4 Pesticide Effects on Beneficial Insects ........................................36 Pest-Management Decision Tools ....................................................37 Economic Advantages of No-Till ........................................................ 6 Nematodes ................................................................................................38 Carbon Markets and Government Incentive Programs ............ 11 Cotton Diseases .......................................................................................40 Crop Rotations: Diversify Your Portfolio......................................... 14 Creating the Market for Sustainable Cotton ...............................42 Soil Moisture Management: Drought Resistance ...................... 18 Irrigation ................................................................................................ 19 Checklists of Sustainable Practices for Cotton Producers ..46 Cotton Pest Management: Protect Your Investment ............. 21 Cotton Information Resources ...........................................................50 IPM for Cotton ......................................................................................... 21 Financial Assistance................................................................................50 Weeds .......................................................................................................... 21 Carbon Trading/Environmental Impact .........................................50 Cotton Marketing ...................................................................................50 Insect Management ...............................................................................23 Production Systems/Pest Control ..................................................... 51 A Word About Non-Transgenic Refuges .........................................23 Sales/Green Marketing..........................................................................53 Economic Thresholds and Biological Control ..............................23 Beneficial Insects .....................................................................................24 References.....................................................................................................54 Cover Crops and No-Till for Conserving Beneficials ..............25 Using Bats to Help Manage Pest Insects........................................59 This publication focuses on ways you can treat your soil better, so that it will perform better for you. Production of this publication was made possible through an NRCS Conservation Innovations Grant (CIG). January 2010
- 2. Sustainability and Why It’s Important for Cotton Farmers A side from the farmer’s experience, a farm’s most important resources are its soil and water. Think of soil and water as the farm’s “capital” and what the farm produces as the “interest” on that capital. Farmers need to be shrewd investors, able to live off their farm’s production—the “interest”—while also building additional capital—their soil quality. Ignoring soil qual- ity is like making withdrawals from your bank account without making any deposits. When you use cover crops, green manures, and good crop rotations in combination with no-till, you are making investments in your soil qual- ity, in your farm. The return from this investment will be a more productive soil better able to produce profitable No-till combined with crop rotation are tools—investments—that crops and withstand extremes of weather. can conserve organic matter in the soil. “Perhaps the most domi- nant soil degradative processes are soil erosion and organic mat- Until recently, it has been economically feasible to rely ter decline.” —B.A. Stewart, R. Lal, and S.A. El-Swaify. Sustaining the on relatively inexpensive synthetic fertilizers and pesti- Resource Base of an Expanding World Agriculture. In: Soil Manage- cides rather than make longer-term investments in build- ment for Sustainability. R. Lal and F.J. Pierce (eds.), 1991. Photo: J. Phil Campbell, Sr., NRCS ing soil health. But fossil fuel prices are high and likely to go higher, raising the costs of fertilizers and pesticides but also improves water infiltration into his soil, thereby as well as the costs of applying them and pumping water increasing water storage for crop use. No-till production, for irrigation. So growers face important decisions. They combined with a good rotation, also virtually eliminates can continue as before and hope that, somehow, efficien- soil erosion and steadily builds soil organic matter that cies and profits can be maintained. Or they can begin to contributes to the sustainable profitability of the farm. manage the soil as a living resource that requires feeding (organic matter) and care (crop rotations, reduced till- Let’s say this same farmer decides to lengthen his crop age, or no-tillage). This publication outlines some invest- rotation from continuous cotton to a rotation of cot- ments growers can make in their soil and cropping prac- ton followed by corn, then winter wheat, and finally a tices to help ensure long-term profitability. double-crop of soybeans before returning to cotton. In a season or two this longer rotation breaks up weed, dis- For a practical example, let’s say a farmer switches to no- ease, and insect cycles, which reduces pesticide applica- till production. This decision not only saves him money tions, diversifies income sources, spreads the workload and input costs out over the growing season, and reduces the risk of financial disaster that might result from fail- What Is a Sustainable ure of a single crop. Cotton Production System? Let’s say this same farmer decides to sell most of his corn A sustainable cotton production system takes crop to a neighbor who raises hogs, chickens and tur- full advantage of the low-cost services provided keys, and the neighbor agrees to sell his animal manure to the crop farmer. This arrangement keeps money in by soil organisms, green manures and cover the local community. With the adoption of no-till, a crops, natural enemies of pest insects, and longer crop rotation, and the mutually beneficial swap innovative weed control strategies that save between neighbors, the social, financial, and environ- money while protecting the soil and water. mental sustainability of this farm and the farm commu- Cotton should be one crop among several in a nity increases. Many more opportunities for increasing lengthy crop rotation. This helps diversify mar- farm sustainability exist. For a comprehensive under- keting and production risk. Including cover standing of sustainable farming, see the ATTRA pub- crops in the rotation provides additional low- lication Applying the Principles of Sustainable Farming cost soil fertility. at the ATTRA website, www.attra.ncat.org/attra-pub/ trans.html#examples. Page 2 ATTRA Sustainable Cotton Production for the Humid South
- 3. Soils: Build Your Capital the soil left behind and is up to Farmers spend a lot of money dealing with prob- five times richer in organic matter lems that impact their yields—low fertility, com- (Pimentel, 1995). paction, nematodes, poor water infiltration, and Five tons of topsoil (the so-called poor water storage capacity in the soil, to name tolerable soil loss level as defined just a few. More often than not, these problems are by NRCS) can easily contain 100 actually symptoms of an underlying condition— pounds of nitrogen, 60 pounds of poor soil health. These symptoms can be reduced phosphate, 45 pounds of potash, or eliminated by investing in soil improvements 2 pounds of calcium, 10 pounds that increase soil health over time. of magnesium, and 8 pounds of A healthy soil: sulfur. Table 1 shows the effect of We must be good stew- slight, moderate, and severe ero- ards of the soil for future • feels soft and crumbles easily sion on organic matter, soil phos- generations. • drains well; soaks up heavy rain with phorus level, and plant-available little runoff water (water in the soil that plants can take up) on a silt • does not crust after planting loam soil in Indiana (Schertz, 1984). • warms up quickly in the spring • stores moisture for drought periods When water and wind erode soil at a rate of 7.6 tons/ acre/year, it costs $40 per acre (in 1991 dollars) each year • does not require increasing inputs for to replace the lost nutrients with fertilizer and around high yields $17/acre/year to pump enough irrigation water to com- • produces healthy, high-quality crops pensate for the soil’s lost water-holding capacity (Troeh Such soils result from longer crop rotations that et al., 1991). The total annual cost of soil and water lost include cover crops and high-residue crops such as from U.S. cropland amounts to approximately $27 bil- corn, the addition of animal manures where pos- lion (Pimentel, 1995). Fortunately several well-tested sible, and a minimum of tillage. cropping practices (discussed later in this publication) can virtually eliminate soil erosion and help ensure the sustainability of any farm. The Economic Case for Protecting soil from erosion is the first step toward a sus- Good Soil Management tainable agriculture. Since water erosion begins with rain falling on bare soil, any management practice that pro- Topsoil is the capital reserve of every farm. From the tects the soil from raindrop impact will decrease erosion time humans created agriculture, topsoil erosion has and increase water entry into the soil. No-till mulches, been the single greatest threat to yield potential—and, cover crops, and crop residues serve this purpose well. consequently, to farm profitability. The major costs asso- ciated with soil erosion come from replacing lost nutri- Conservation tillage systems that maintain year-round ents and from reduced water-holding capacity. These two crop residue not only virtually eliminate erosion and problems account for 50 to 75% of the lost productivity increase water infiltration but also reduce labor, fuel, of the land. (Pimentel, 1995). Soil lost to erosion typi- and equipment costs without compromising crop yields. cally contains about three times more nutrients than No-till is popular among cotton growers, with 57% of Table 1. Effect of Erosion on Organic Matter, Phosphorus and Plant-Available Water. Erosion Level % Organic Matter Phosphorus (pounds/ac) % Plant-Available Water Remaining in Soil Remaining in Soil Remaining in Soil Slight 3.0 62 7.4 Moderate 2.5 61 6.2 Severe 1.9 40 3.6 From Schertz et al., 1984. www.attra.ncat.org ATTRA Page 3
- 4. NRCS Conservation Practice Cover Crop (Code 340) The Natural Resource Conservation Service (NRCS) can provide funds for farmers to implement new, resource-conserving practices on the farm. Look in your phone book under U.S. Government, USDA, to contact your local NRCS Service Center. Definition: Crops including grasses, legumes & forbs for seasonal cover and other conservation purposes. Purpose: √ Reduce erosion from wind and water √ Increase soil organic matter content Money—and future profits—down the drain. √ Capture and recycle or redistribute nutrients Soil lost to erosion typically contains about three times more nutri- in the soil profile ents than the soil left behind and is up to five times richer in organic √ Promote biological nitrogen fixation matter (Pimentel, 1995). Photo: NRCS √ Increase biodiversity them reporting in a recent survey that they used no-till √ Weed suppression or strip till (Anon., 2007). √ Provide supplemental forage √ Soil moisture management Taking Advantage of “Solar” √ Reduce particulate emissions into the atmosphere Fertilizers (Legumes) √ Minimize and reduce soil compaction Given the increase in commercial fertilizer prices, con- verting free sunlight to nitrogen (N) is becoming increas- established, they were fertilized with 15, 23, and 93 ingly attractive. In a Florida study, Wiatrak et al. (2006) pounds of nitrogen, phosphorus and potassium, respec- achieved maximum cotton yields with 69 pounds per tively, per acre. When cotton was planted into these acre of nitrogen fertilizer following a white lupine cover killed cover crops the following spring, 71 pounds per crop. They concluded that, in general, nitrogen fertil- acre of nitrogen was applied to the cotton crop in all izer on cotton can be reduced by at least 53 pounds per plots. The cover crops, their above-ground yields, and acre where cotton follows lupine because of the legume’s nitrogen production are shown in Table 2. nitrogen contribution. Cotton grown behind black oats, rye, and oilseed radish A group of Georgia researchers evaluated seven cover had greater yields than cotton following the other four crops, each then followed by a cotton crop under either cover crops (Table 2). The authors concluded that rye strip tillage or no-till on a sandy, coastal-plain soil in and black oats were the best choices for sandy, southeast- Georgia (Schomberg, 2006). Once the cover crops were ern coastal-plain soils (Schomberg, 2006). Table 2. Cover Crop and Cotton Yields & Returns on a Coastal-Plain Soil (4-year average). Cover Crop Plant Weight Total Nitrogen Cotton Lint Yield Returns (Pounds/Acre) (Pounds/Acre) (Pounds/Acre) (Dollars/Acre) Austrian Winter Peas 2312 75 1258 $150 Balansa Clover 1647 36 1260 $134 Best Black Oats 2777 45 1510 $187 choices for the sandy Crimson Clover 1647 40 1179 $122 coastal- Hairy Vetch 2634 90 1240 $141 plain soils Oilseed Radish 2446 41 1365 $116 of the Rye 4082 45 1455 $164 American From Schomberg, 2006. Southeast. Page 4 ATTRA Sustainable Cotton Production for the Humid South
- 5. Many cotton-growing areas in the U.S. are subject to soil loss through wind erosion. Georgia Cotton, Peanut Farmers Use Cover Crops to Control Pests Dr. Sharad Phatak describes his work with cotton and peanut farmers: TIFTON,Ga.—Here in southwestern Georgia, I’m working ponds, near irrigation lines and in other non-cropped with farmers who have had dramatic success creating bio- areas as close as possible to fields to provide the food logically active soil in fields that have been convention- needed to support beneficials at higher populations. ally tilled for generations. We still grow the traditional cash When I work with area cotton and peanut growers who crops of cotton and peanuts, but with a difference. want to diversify their farms, we set up a program that We’ve added cover crops, virtually eliminated tillage, looks like this: and added new cash crops that substitute for cotton • Year 1, Fall: Adjust fertility and pH according to soil test. and peanuts some years to break disease cycles and Deep till if necessary to relieve subsurface soil allow for more biodiversity. compaction. Plant a cover crop of rye, crimson Our strategies include no-till planting (using modified clover, cahaba vetch or subterranean clover. conventional planters), permanent planting beds, con- Spring: Strip-till rows 18 to 24 inches wide, leav- trolled implement traffic, crop rotation, and annual ing the cover crop growing between the strips. high-residue winter cover crops. We incorporate fertilizer Three weeks later, plant cotton. and lime prior to the first planting of rye in the conversion • Year 2, Fall: Replant cereal rye or cahaba vetch, allow year. This is usually the last tillage we plan to do on these crimson or subclover hard seed to germinate. fields for many years. Together, these practices give us sig- Spring: Strip-till cotton. nificant pest management benefits within three years. • Year 3, Fall: Plant rye. Growers are experimenting with a basic winter covercrop Spring: Desiccate rye with herbicides. followed by a summer cash crop rotation. Our cover crops No-till plant peanuts. are ones we know grow well here. Rye provides control of disease, weed and nematode threats. Legume crops are • Year 4: The cycle starts again at Year 1. crimson clover, subterranean clover or cahaba vetch. They are planted with the rye or along field borders, around —Dr. Sharad Phatak in Managing Cover Crops Profitably www.attra.ncat.org ATTRA Page 5
- 6. Economic Advantages of No-Till Twelve years of research at the Milan, Tennessee, Experi- ment Station have shown that cotton can be grown suc- cessfully using no-till methods with the same yields as under conventional till (Bradley, 1993). The research team realized savings up to $60/acre by switching to no-till. They recommend that growers start no-till on a small acreage and add acres as they build on their experi- ence. The Milan Experiment station’s leader, Dr. Bradley, lists seven advantages for no-till cotton: 1) elimination of tillage; 2) ability to grow cotton on slopes; 3) reduced soil erosion on sloping land; 4) ability to broadcast fertil- izer and lime on top of the soil; 5) firmer soil at harvest Planting cotton in a high-residue (greater than 4,000 lb/acre) con- time resulting in fewer weather delays; 6) improved soil servation tillage system. Residue from a rye cover crop covers the moisture-holding capacity and tilth; 7) reduced labor at soil. A roller-crimper was used to lay the straw down when the rye began to flower. Photo: J. Phil Campbell, Sr., NRCS planting time by more than 50%. Three Mississippi State University agronomists prepared fields where they have been a problem in the past. Some a concise Extension publication on getting started with herbicide recommendations are included in the MSU no-till practices (McCarty et al., 2009). A summary of publication, and the scouting and herbicide recommen- their publication follows. dations are available from state Extension offices and pri- vate consultants. The decision to go with no-till should be made on a field- by-field basis. Fields with fertility problems or perennial Dabney and others (1993) compared no-till to conven- grass weeds should be avoided or the problems corrected tional tillage in a North Mississippi field that had been before switching to no-till (McCarty et al., 2009). If soil in meadow for several years prior to the experiment. In pH requires lime, it is best applied and incorporated prior the first year of their study, conventional till produced to switching to no-till. Generally, fertilizer can be sur- higher yields and profits than did no-till. During the face applied as needed. Where surface residue is heavy, third through the fifth years, however, no-till resulted nitrogen can be applied in split applications, either on in more cotton production, more profit, equal or better the surface or knifed-in one to two inches deep. stand establishment, more rapid early growth, and ear- lier fruiting. The level of soil organic matter was higher, Wheat planted at one to two bushels of seed per acre and under no-till, access to the fields was easier during makes a good cover crop to precede cotton. If no cover wet weather (Dabney et al., 1993). crop is used, stalks from the previous year’s crop should be mowed after harvest to spread the residue and has- Crozier and Brake (1999) conducted an on-farm case ten its decomposition. Whether natural winter weeds study on no-till in the North Carolina blackland region. or a wheat cover crop is used, all vegetation should be Their study involved Open Ground Farms, Inc., a large killed two to three weeks before planting so that a sec- farm (35,000 acres) growing mostly corn, soybeans, and ond treatment can be done if all the vegetation is not cotton. Managers at Open Ground were making the dead by planting time. If all vegetation is not dead at the transition from conventional tillage to no-till in the late time of planting, add a second burn-down herbicide to 1980s into the early 1990s to reduce wind erosion and the pre-plant tank mix. A good no-till planter that can labor costs. During that time, they grew primarily corn cut through the surface residue and soil while placing and soybeans and were reducing wheat and forage crops the seed at a uniform depth and spacing is essential. while adding cotton to the rotation. One of the primary benefits they realized was reducing the labor force from Planting can start when soil temperatures at the 2-inch 24 to 10 people. They also recognized that the ground depth remain at or above 65 degrees for three consecutive was firmer to drive equipment across. Corn and soybean days. Plant for a final stand of three to four plants per yields during the transition are shown in Figure 1. row-foot using quality treated seed and in-furrow fun- gicides to minimize soil-borne seedling diseases. Early In addition to reducing fuel consumption, conserving crop insect scouting should proceed as with conventional soil moisture, and cutting labor-costs no-till farming cotton, with close attention being paid to cutworms in also provides environmental benefits. Two South Caro- Page 6 ATTRA Sustainable Cotton Production for the Humid South
- 7. lina scientists (Novak and Hayes, 2001) at Clemson Uni- versity compared conventional tillage, phosphorus appli- Table 3. Farming Practices Used in the Clemson cation, cotton varieties, and herbicides with what at that Study (Novak and Hayes, 2001) time (1996) were considered innovative practices. See Table 3 for details on the two systems. Traditional Practices Innovative Practices They ran their study for four years and collected data on Discing, bedding, cultivating No surface tillage cotton yields, water runoff from the two fields, and the In-row subsoiling Para Till subsoiling amount of phosphorus, nitrogen and sediment contained leaves more residue in that water. As shown in Table 4, cotton yields were not statistically different the first year of the study but Conventional BT/Roundup ready were higher under conservation tillage for the remaining cotton variety variety three years. Broadcast phosphorus Precision P applica- application tion using GPS Environmental benefits were also realized from the inno- vative system. Nearly 100 times more sediment eroded Fluometuron, pendimeth- Glyphosate and from the conventionally-tilled field than from the no-till alin, sethoxydim, pyrithio- pendimethalin field, while nitrogen loss was 61 times higher, and phos- bac, cyanazine herbicides herbicides phorus loss was 10 times higher (Table 5). As mentioned in the beginning of the soil section, eroded topsoil typi- cally contains three times more nutrients than the soil left behind. That’s money out of the farmer’s pocket. Table 4. Tillage Effect on Cotton Yield Year Conventional Conservation Tillage Tillage Pounds per acre Pounds per acre 1997 875 830 1998 574 785* 1999 285 354* 2000 596 687* * Indicates a year where significant yield differences occurred between the two farming systems. Table 5. Water, Sediment, and Mineral Losses from Two Cropping Systems. Crop- Water Sediment Nitrogen Phosphorus ping Runoff (Pounds/ (Pounds/ (Pounds/ System (Inches) Acre) Acre) Acre) Inno- 0.1 12 .09 .005 vative Tradi- 2.4 1,176 5.5 .05 tional Note that nearly 100 times more sediment eroded from the conventionally tilled field than from the no-till field, while nitrogen loss was 61 times higher, Figure 1. Corn and soybean yields from no-till and phosphorus loss was 10 times higher. and conventional till over a 12-year period at Open Ground Farms, Inc. (Crozier and Brake, 1999) www.attra.ncat.org ATTRA Page 7
- 8. NRCS Conservation Practices to Help Prevent Soil Erosion Four Different Flavors of Conservation Tillage Residue and Tillage Management, Mulch Till (Code 345) Definition: Managing the amount, orientation and distribution of crop and other plant residue on the soil surface year round while limiting the soil-disturbing activities used to grow crops in systems where the Planter operating in rolled residue. Note modifications to the planter: entire field surface is tilled prior to planting. spoked closing wheels, heavy-duty down-pressure springs, row cleaners behind rippled coulter. Photo: J. Phil Campbell, Sr., NRCS Purpose: √ Reduce sheet and rill erosion √ Reduce wind erosion Residue and Tillage Management, Ridge Till (Code 346) √ Reduce soil particulate emissions Definition: Managing the amount, orientation, and dis- √ Maintain or improve soil condition tribution of crop and other plant residues on the soil sur- √ Increase plant-available moisture face year-round, while growing crops on pre-formed ridges √ Provide food and escape cover for wildlife alternated with furrows protected by crop residue. Purpose: Residue and Tillage Management, √ Reduce sheet and rill erosion No-Till/Strip Till/Direct Seed (Code 329) √ Reduce wind erosion Definition: Managing the amount, orientation and distri- √ Maintain or improve soil condition bution of crop and other plant residue on the soil surface √ Reduce soil particulate emissions year-round while limiting soil-disturbing activities to only √ Manage snow to increase plant-available moisture those necessary to place nutrients, condition residue and plant crops. √ Modify cool wet site conditions Purpose: √ Provide food and escape cover for wildlife √ Reduce sheet and rill erosion Residue Management, √ Reduce wind erosion Seasonal (Code 344) √ Improve soil organic matter content Definition: Managing the amount, orientation, and distri- √ Reduce CO2 losses from the soil bution of crop and other plant residues on the soil surface √ Reduce soil particulate emissions during a specified period of the year, while planting annual √ Increase plant-available moisture crops on a clean-tilled seedbed, or when growing biennial or perennial seed crops. √ Provide food and escape cover for wildlife Purpose: √ Reduce sheet and rill erosion The Natural Resource Conservation Service √ Reduce soil erosion from wind and associated (NRCS) can provide funds for farmers to airborne particulate matter implement new, resource-conserving prac- √ Improve soil condition tices on the farm. Look in your phonebook √ Reduce off-site transport of sediment, nutrients under U.S. Government, USDA to contact or pesticides your local NRCS Service Center. √ Manage snow to increase plant-available moisture √ Provide food and escape cover for wildlife. Page 8 ATTRA Sustainable Cotton Production for the Humid South
- 9. Adding Cover Crops or Poultry Litter to No-Till Farming Cover crops add organic matter to the soil, protect the soil from erosion during the off-season, and provide nitrogen (in the case of legumes). Some cover crops can even reduce soil nematode populations. When used as a no-till mulch, cover crops increase water infiltration and water storage in the soil by reducing evaporation. For more on cover crop management, see the ATTRA publication Overview of Cover Crops and Green Manures available at www.attra.org. Poultry production is common throughout the south- ern cotton belt. Consequently, the poultry litter from these operations is widely used as fertilizer for pastures Planting into a killed cover crop protects the soil from erosion, and and forage crops. Some farmers may be reluctant to use helps the soil retain moisture. Photo: Rex Dufour, NCAT poultry litter on cotton fields, however, fearing loss of cotton lint yields (Table 6). Cover crops did increase lint nitrogen to volatilization and runoff, especially when yields. Higher lint yields were realized following crim- the litter is surface applied. Additionally, some may fear son clover (756 lbs/acre) than after either fallow (694 cotton stalks will grow too tall resulting in yield reduc- lbs/acre) or wheat (705 lbs/acre). tions. The litter should be tested along with the soil to provide guidance on how much poultry litter or fertil- Endale and others (2002) fertilized cotton with poultry izer is needed. litter or commercial fertilizer under either no-till or a conventional-till rye-cover-crop system in Georgia. They Wiatrak et al. (1999) studied the effects of conservation grew a rye cover crop over their research plots each win- tillage and nitrogen rates on cotton yields in a sandy- ter from November to May, then planted cotton directly loam soil in northern Florida. They planted cotton using into the killed rye or into plots where the rye had been either strip tillage or conventional tillage following either chisel plowed and disked several times. Fertilizer rates a cover crop of wheat or crimson clover or no cover crop. were based on 54-pounds of nitrogen per acre, which Nitrogen rates of 0, 60, 120, or 180 pounds per acre were required two tons of poultry litter per acre (based on applied for the cotton crop onto each cover crop treat- 50% release rate the first year) on the poultry litter plots ment the following growing season. The results of their compared to 158 pounds of ammonium nitrate per acre study showed that both tillage systems produced similar to supply the recommended amount of nitrogen on the commercially fertilized plots. Table 6. Effect of Tillage Methods* & Cover Crop on Lint Cotton Yields (3-year average). All the plots received 50 pounds of N and 40 pounds Tillage Previous Crop Average of K per acre in the fall just prior to planting the rye method cover crop. Cotton yield was 21 to 79% higher under no-till than conventional till each year except 1999—a Fallow Crimson Wheat (No Cover) Clover drought year, when the yields were not significantly dif- ferent. When averaged over the five-year period, yields Pounds of Cotton/Acre were 31% higher from no-till than from conventional Strip Till 712a** 748a 669b 709a tillage (Endale et al., 2002) Conven- 677a 764a 739a 715a Cotton yield from poultry litter was 4 to 12% higher tional than from commercial fertilizer when averaged over two Average 694a 756a 705a 712a tillage methods, except in 1999—a drought year, when * Tillage methods were not significantly different at commercial fertilizer yielded 7% more lint (Endale et the 5% level. al., 2002). Under no-tillage, there was no statistical dif- ** Within columns, numbers followed by the same ference between poultry litter and commercial fertilizer letter were not significantly different at the 5% level. in any single year or averaged over all five years (Endale et al., 2002). www.attra.ncat.org ATTRA Page 9
- 10. NRCS Conservation Practice Switching to no-till often produces the Nutrient Management, Code 590 same yields as under the conventional Definition: Managing the amount, source, till for the first few years after the con- placement, form, and timing of the application version, then higher yields thereafter. of plant nutrients and soil amendments. —Boquet et al., 2004 Purpose: nitrogen needs of the cotton crop and assuming a 50% √ To budget and supply nutrients for plant N release rate from the litter. The litter-only treatments production. received 3.65 tons/acre of litter in 2003 and 3.4 tons/acre √ To properly utilize manure or organic by- in 2004 and 2005, based on pre-application N analysis products as a plant nutrient source. of the litter. The litter plus supplemental nitrogen treat- √ To minimize agricultural nonpoint source ments used 2.45 tons/acre litter plus 30 pounds/acre of pollution of surface and ground water urea ammonium nitrate (UAN–N) in 2003, 2.27 tons resources. per acre litter plus 90 pounds/acre UAN–N in 2004, and 30 pounds/acre UAN–N in 2005. √ To protect air quality by reducing nitrogen emissions (ammonia and NOx compounds) Lint yields showed poultry litter to be a good source of and the formation of atmospheric particu- fertility for cotton in any of the three tillage treatments lates. (see Table 7). Litter alone outperformed fertilizing with √ To maintain or improve the physical, chemi- conventional fertilizer or a combination of litter and fer- cal and biological condition of soil. tilizer (Tewolde et al., 2008). Incorporating the poultry litter at roughly 3.5 tons/ acre improved cotton yields over surface application at Tewolde et al. (2008) studied poultry litter as a cotton the same rate. Where litter was incorporated approxi- fertilizer under different tillage systems in Mississippi. mately two inches deep, cotton yields increased from Their primary tillage treatments were no-till and conven- 932 to 1007 pounds per acre when averaged over the tional till. A third treatment under no-till was included, first and third years of the four-year study. A hail storm where the poultry litter was incorporated lightly after during the second year of the study damaged cotton so application, to determine the yield reduction due to the badly that yield was not presented, and the fourth year litter not being incorporated. All fertility needs were of the study was extremely dry (5.7 inches of rain dur- provided under each tillage treatment by poultry litter ing the growing season) and resulted in much lower (litter-only treatment), litter plus supplemental nitrogen yields than normal. (litter plus N treatment), or exclusively by commercial fertilizer. Poultry litter was applied at a rate based on the The researchers documented increases in soil carbon (organic matter), phosphorus, potassium, copper, and zinc concentrations where poul- Table 7. Cotton Yields Averaged Over 3 Years, by Tillage & Fertility try litter had been used. At the (Tewolde et al., 2008). end of the last year of the study, Fertility Treatment No-Till Yields- Conventional Till soil having litter applied to it con- Pounds/Acre Yields– Pounds/Acre tained 4.27 grams of organic car- No Fertilizer 775c* 984c bon per pound of soil compared to 3.37 grams per pound of soil at Standard Fertilizer 883b 1006c the start of the study three-years Tilled Litter + Nitrogen 938ab 1023c earlier. The researchers concluded Untilled Litter + Nitrogen 904b 1042bc that poultry litter was a more effective cotton fertilizer than Tilled Litter Alone 1007a 1106ab conventional inorganic fertilizers Untilled Litter Alone 932ab 1116a under tilled or no-till conditions *In each column, yield numbers followed by the same letter are not signifi- (Tewolde et al., 2008). cantly different. Least significant difference is less than .10 Page 10 ATTRA Sustainable Cotton Production for the Humid South
- 11. Of all the tillage, nitrogen, and cover crop combinations, the only ones that had a net gain in soil organic carbon sequestra- tion over the three-year study period were the no-till with cover-crop treatments. All the rest suffered a loss of soil organic matter that could not be made up with cover crops or crop residue. —Sainju, et.al, 2006 Combining no-till with a good cover crop not only protects your soil and seedlings (shown here just emerging), but also reduces Carbon Markets and production risk from lack of—or too much—rain. Government Incentive Programs Photo: J. Phil Campbell, Sr., NRCS Worldwide awareness of the dangers posed by rising car- Boquet et al. (2004) studied cotton grown with a wheat bon dioxide (CO2) levels in the atmosphere has moti- cover crop, a hairy vetch cover crop, and no cover crop, vated government agencies and others to find ways to under either conventional tillage or no-till, using sev- sequester (remove from the air and store) carbon diox- eral different nitrogen rates. Starting in year five of ide. Cap-and-trade programs will likely be paying land- their study, they found consistently higher yields under owners for using plants and soils to capture CO2. Some no-till when adequate nitrogen was provided. In subse- strategies for sequestering CO2 include establishing tim- quent years, no-till on average increased yield by about ber or grassland plantings or extending the durations for 9% each year. timber stands and grasslands. Annual cropland is also seen as a means for carbon sequestration under cap and The researchers mention that shorter-term studies pro- trade. Typically, annual cropland has been a net contrib- duced inconsistent yield responses to no-till production utor of CO2 to the air. Conventional tillage speeds the in the first few years after conversion from conventional decomposition of crop residue, converting the carbon in till. They go on to say that most studies indicate that the crop residue back to atmospheric CO2. Tillage also cotton yields are not reduced under no-till. To sum- speeds the decomposition of soil organic matter, releas- marize, switching to no-till often produces the same ing even more CO2. No-till, by minimizing soil distur- yields as conventional tillage for the first few years after bance, allows carbon to build up in the soil. the conversion and higher yields thereafter (Boquet et al., 2004). Sainju et al. (2006) studied changes in soil organic car- bon (organic matter) that resulted from using cover In the cover crop portion of their study, hairy vetch crops and tillage on fields growing cotton or sorghum. produced optimal cotton yields under both no-till and They grew cover crops of hairy vetch, rye, a rye-hairy- conventional till with no supplemental nitrogen fer- vetch mixture, and winter-fallow weeds near the Fort tilizer. Other studies—Boquet and Coco (1993) and Valley Agricultural Research Station in Georgia. Three Schwenke et al. (2001)—found that hairy vetch pro- nitrogen rates (0, 55 and 110 pounds per acre) were vided about half the nitrogen cotton needs. Where applied to the cotton or sorghum. The three tillage nitrogen was applied to hairy vetch at a rate above 105 methods were no-till, strip till, and chisel-till (chisel pounds per acre, cotton yields declined, most likely due plowed plus disc harrow). to excessive vegetative growth (Boquet et al., 2004). Under a wheat cover crop, excess nitrogen (greater than Of all the tillage, nitrogen, and cover crop combinations, 105 pounds/acre) did not reduce cotton yields, most the only ones that had a net gain in soil organic carbon likely due to nitrogen immobilization from the high sequestration over the three-year study period were the carbon-to-nitrogen ratios in the wheat residues (Boquet no-till with cover-crop treatments. All the rest suffered et al., 2004). Their data show that the optimal nitrogen a loss of soil organic matter that could not be made up rate for cotton following a non-legume cover crop was with cover crops or crop residue. In the top four inches 105 pounds per acre. of no-till soil, the rye cover crop accumulated organic www.attra.ncat.org ATTRA Page 11
- 12. Carbon Modeling Software CQUESTR was developed by the USDA and simu- DAYCENT is a daily time-step version of Cen- lates the effect of several management practices tury. DAYCENT is a terrestrial biogeochemical on soil organic carbon stocks. It does not con- model. DAYCENT has been applied to estimate sider livestock, farm fuels and by-products. The N2O emissions from various native and man- model has been calibrated and validated in tem- aged systems at different spatial and tempo- perate regions. (Fuller, et.al., 2003) ral scales, including its use to estimate annual N2O emissions from cropped soils for the USA Century: The Century Soil Organic Matter model national greenhouse gas inventory. is a generalized biogeochemical ecosystem A major strength of the model is the required model that simulates carbon, nitrogen, and inputs (daily weather, soil texture, vegetation other nutrient dynamics. The model simulates cover, land management) are relatively easy to cropland, grassland, forest and savanna ecosys- acquire for many systems. Major weaknesses tems and land use changes between these differ- are that the model does not account for all the ent systems. factors related to denitrification (e.g. microbial community, lateral flow of water) and the factors The Century Model was developed by CSU and that are accounted for are on relatively coarse USDA Agriculture Research Service (ARS). spatial and temporal scales compared to the Various other models, including EPIC and scales at which denitrification actually occurs. COMET VR incorporate the Century model as The model is available to the public and can be part of their program. run from DOS or UNIX. The model is relatively user friendly for those with minimum experience COMET-VR: The Voluntary Reporting of Green- in computer programming. house Gases—CarbOn Management Evalua- tion Tool (COMET-VR ) is a decision support EPIC (Erosion Productivity Impact Calculator) is a tool for agricultural producers, land managers, widely tested and adapted model originally built soil scientists and other agricultural interests. to quantify the effects of erosion on soil produc- COMET-VR provides an interface to a data- tivity. It has since evolved into a comprehen- base containing land use data from the Carbon sive agro-ecosystem model capable of describing Sequestration Rural Appraisal (CSRA) and cal- the behavior of many crops grown in complex culates in real time the annual carbon flux using sequences and tillage operations. a dynamic Century model simulation. Addi- (Williams, 1995) tional information is available at: www.cometvr.colostate.edu. The model contains parameters to simulate about 100 crops and up to 12 plant species in a field. EPIC contains routines to handle CO2 fer- Users of COMET-VR specify a history of agri- tilization effects on plant growth and water use cultural management practices on one or more (Stockle et al., 1992a,b), hydrological balance, parcels of land. The results are presented as ten N and P cycling, soil density changes, tillage, year averages of soil carbon sequestration or erosion, and leaching. The C and N dynam- emissions with associated statistical uncertainty ics captured from Century (another C model- values. Estimates can be used to construct a ing program) now interact directly with the soil soil carbon inventory for the 1605(b) program, moisture, temperature, erosion, tillage, soil den- which is USDA’s voluntary greenhouse gas sity, leaching, and translocation functions of reporting system. EPIC. (Izaurralde, et. al, 2001) Page 12 ATTRA Sustainable Cotton Production for the Humid South
- 13. carbon at a rate of 267 pounds per acre/year; the hairy vetch accumulated 207 pounds per acre/year; and the Benefits of Increasing Soil Organic Matter (SOM) rye-hairy vetch mixture accumulated 267 pounds per • SOM increases absorption of rainfall/irrigation acre/year. Where no cover crop was grown on no-till and storage capacity of soil moisture. soil, there was a net loss of 149 pounds per acre/year of • SOM acts as a reservoir for nitrogen. organic carbon. • SOM helps provide phosphorus through mycorrhizal-mediated interactions. Other studies in the southeastern United States show • SOM increases Cation Exchange Capacity. that growing cotton under no-till increases soil carbon • SOM provides other micronutrients through in the range of 429 to 499 pounds per acre compared to an effective soil food web. conventional till (Causarano et al,, 2006). When a cover • SOM helps buffer soil pH. crop was added to a no-till operation, soil carbon levels —Sustainable Soils, B. Wolf, G.H. Snyder, 2003 increased 561 to 597 pounds per acre. These increases in organic matter not only improve soil tilth, water holding capacity, and nutrient cycling, but can also be converted wind (Hubbs et al., 2002). A negative SCI reading pre- into cash through one or more USDA programs. dicts soil organic carbon will decline, while a positive reading predicts an increase in soil organic carbon. The Natural Resources Conservation Service (NRCS) has a tool known as the Soil Conditioning Index (SCI) The SCI does not give a quantity of organic carbon pres- that predicts changes in soil organic carbon based on ent in the soil but rather a probability of achieving a tillage and cropping management. The SCI accounts change in organic carbon based on the cropping system. for organic-matter additions, and field operations such NRCS uses the SCI to help inform decisions about pay- as tillage, planting, fertilizing, and harvesting. Based on ments to landowners enrolled in some of its conservation these practices, it also predicts soil erosion by water and programs. In Tables 8 and 9, SCI values are provided for two tillage and rotation systems that include cotton Table 8. Soil Conditioning Index Values for Rotation (Causaran et al., 2005). in 2 Tillage Systems — Mississippi Valley Region. The NRCS Conservation Stewardship Program (CSP) Slope Soil Mono-Crop Mono-Crop Rotated provides financial and technical assistance to farm- % Texture Cotton, Cotton, Cotton,* ers for conserving and improving soil, water, and air Conventional No-till No-till Tillage quality among other things. Some of the practices that qualify under the program are conservation till- 5% Silty loam -8.4 -1.9 .07 age, cover cropping, crop rotation, and grassed water- 2% Silty loam -1.9 .03 .11 ways. Learn more about the CSP program from the 2% Silty loam -1.9 .36 .42 NRCS website, www.nrcs.usda.gov/programs/new_csp/ 2% Silty loam -1.5 .08 .52 csp.html. A 3-page list of CSP enhancements (steward- * Rotation was cotton/wheat-cover/corn/wheat-cover ship practices that NRCS may help pay for) can be found at www.nrcs.usda.gov/new_csp/cmt_scoring_pdfs/ Enhancement_list_with_scores.pdf. Table 9. Soil Conditioning Index Values for Rotation Under 2 Tillage Systems — Eastern Texas Region. Finally, a carbon-trading market has been established Slope Soil Mono-Crop Mono-Crop Rotated in the U.S. The Chicago Climate Exchange (CCX) % Texture Cotton, Cotton, Cotton,* offers trading of carbon credits at the present time. Conventional No-till No-till Carbon credits are created through consultants known Tillage as aggregators who gather project acres into a bundle 2% Clay -1.1 .55 .53 large enough to offer for sale on the climate exchange. 2% Clay loam .71 .26 .36 Each project has to be verified by an independent 2% Silty clay .70 .41 .51 third party to be eligible for sale on the exchange. loam Continuous conservation tillage for a five-year period * Rotation was cotton/corn. is one of the practices that qualify as a carbon-offset project. As the value of carbon credits rises, interest Negative Soil Conditioning Index (SCI) values predict in carbon trading will increase. Learn more about a decline in organic matter. Positive values predict an carbon credits and carbon trading at the CCX website, increase in organic matter. www.chicagoclimateexchange.com. www.attra.ncat.org ATTRA Page 13
- 14. Crop Rotations: Diversify Your Portfolio Crop rotations are one of the most cost-effective means of breaking soil-borne pest-insect and plant-disease when grain crops follow nitrogen-fixing legumes. In cycles. Likewise, many problem weeds are suppressed many cases, yields are increased by the “rotation effect.” by the nature and timing of different cultural practices. Three crop scientists (Wesley et al., 1993) compared Rotations also affect soil fertility in significant ways cotton-soybean and cotton-sorghum rotations to each crop when forage legumes serve as a nitrogen source for sub- grown alone near the Stoneville, Mississippi, Experiment sequent crops. Station for five years. The study was done in two separate Crop rotations are an affordable and low-cost method locations with either conventional tillage or ridge-till. of risk management. Rotations can reduce input costs Cotton yields were higher from the cotton-sorghum over the long-term and also reduce pest management rotation than from cotton monoculture or cotton-soybean risks. A farmer who produces only a single crop, such rotation in both conventional and ridge-till systems. as cotton, is taking on greater risk because there is only Soybean yields were 16 to 19% higher when rotated with a single market for the sorghum in conventional crop, and the repetition of tillage and 40 to 80% One of the major benefits realized from rotation cotton year after year will higher under ridge-till is improved control of weeds, insects and diseases be certain to create pest (Wesley et al., 1993). by breaking or interfering with pest life cycles. problems. Sorghum yields remained unaffected under either If instead farmers diversify crops and in some cases even tillage regimen. In essence, sorghum increased and integrate plant and animal production, they won’t be stabilized yields of both cotton and soybeans when rotated reliant on a single market, and the rotations will benefit with either. The researchers noted that the high levels of their soils, thereby further reducing risk. Increasing crop residue produced by sorghum will aid producers who soil functions begins with crop rotations, which break plant annual crops on highly erodible land in achieving weed and pest life cycles and provide complementary compliance with their conservation plans required by fertilization to crops in sequence with each other, as USDA cost-share programs. Planting cotton every year with 120 pounds N per acre as fertilizer A three-year rotation of cotton, winter legume, corn, small grain and no winter cover crop has resulted in poor soil quality (less than harvested for grain, and soybean results in more than 2.5% soil 1% soil organic matter) and severe soil crusting in the spring. In spite organic matter and the highest average cotton lint yields (two bales of the difficulty of getting a stand of cotton with conventional till- per acre). Only 60 pounds N is applied during the three-year rotation age, long-term average yields have been only slightly less than the and that is applied to the small grain, which is either wheat or rye. two-year or three-year rotation. This is typical of most cropping situ- ations in the South. The two photographs above are from The Old Rotation—the oldest continuous cotton experiment in the world, started by Professor J. F. Duggar to demonstrate the benefits of winter legumes as a cover crop, and crop rotations on cotton and corn production in the South. Located on the campus of Auburn University, Alabama. Page 14 ATTRA Sustainable Cotton Production for the Humid South
- 15. One important benefit realized from rotation is improved weed control due to changing herbicides from one crop NRCS Conservation Practice to another. Following cotton with corn helps break up Conservation Crop Rotation, Code 328 herbicide resistance that may be present in a field because The Natural Resource Conservation Service (NRCS) can different herbicides may be used on corn than on cotton. provide funds for farmers to implement new, resource- Another advantage is soil moisture conservation when conserving practices on the farm. Look in your phone cotton follows a soybean-wheat rotation. The wheat book under U.S. Government, USDA to contact your local straw insulates the soil, thus reducing water evaporation, NRCS Service Center. runoff, and erosion, while increasing water infiltration. Definition: Growing crops in a recurring sequence on the same field. The Huerkamp brothers, who farm 3400 acres near Macon, Mississippi have found that continuous cotton Purpose: This practice may be applied as part of a con- doesn’t work on their farm. When they rotate with corn, servation management system to support one or more of the following: the corn stalks leave behind a good root system that √ Reduce sheet and rill erosion. decomposes into organic matter. Consequently, they realize better cotton plant development and higher yields √ Reduce soil erosion from wind. (Horton, 2008). √ Maintain or improve soil organic matter content. √ Manage the balance of plant nutrients. Three Mississippi researchers studied the economic √ Improve water use efficiency. potential of a cotton-corn rotation. They interviewed 11 √ Manage saline seeps. farmers in the Mississippi delta and developed enterprise √ Manage plant pests budgets for their rotations (Martin et al., 2002). These (weeds, insects, and diseases). farmers estimated their cotton lint yields were 150 to √ Provide food for domestic livestock. 400 pounds per acre higher the first year after corn. √ Provide food and cover for wildlife. They reported corn yields ranging from 135 to 225 bushels per acre. next. Corn was harvested in late summer and cotton Most of the farmers saw some reduction in equipment in the fall. These savings resulted from greater ease use and lower labor costs resulting from the timing of in getting the two crops planted and harvested, since corn planting and harvest in conjunction with cotton less of each crop went on the same total acreage that planting and harvest. In other words, the use of once grew only cotton. Net income results are shown equipment was spread out over a longer period since corn in Tables 10 and 11 at left. Under both irrigated and was planted starting in March, then cotton was planted non-irrigated cropping systems, a rotation of corn and cotton produced more net income than Table 10. Average Returns Above Survey Costs Per Acre for Con- did continuous cotton, based on a corn tinuous Cotton & Irrigated Corn-Cotton in Rotation. Corn yield: price of $2.50 per bushel and cotton at 165 bu/acre; cotton yield: 825 lbs/acre. (Martin et al., 2002) three prices. Cotton Price $0.55/pound $0.60/pound $0.65/pound If forage crops can be included in the Rotation Corn Net @ $108/acre $131/acre $155/acre crop rotation, even more benefits can be $2.50/bu realized. Sod crops, such as bahiagrass, Continuous Cotton $-6/acre $35/acre $76/acre not only keep the soil entirely covered Net Income but also have massive root systems that produce far more organic matter than is Table 11. Average Returns Above Survey Costs Per Acre for Con- lost. Sod crops are the best soil-building tinuous Cotton & Non-Irrigated Corn-Cotton Rotation. Corn yield: crops—they can heal the damage done 135 bu/acre; cotton yield: 750 lbs/acre. (Martin et al., 2002) to soil by row cropping. Weed control improves when sod crops are added Cotton Price $0.55/pound $0.60/pound $0.65/pound because the types of weeds encouraged Rotation Corn Net @ $97/acre $119/acre $140/acre by row-cropping systems are usually not $2.50/bu adapted to growing in a sod/hay crop. An Continuous Cotton $-7/acre $31/acre $69/acre ideal rotation might include one year of Net Income sod crop for each year of row crop, and as www.attra.ncat.org ATTRA Page 15
- 16. ence 60 drought days from May through August in 5 out of 10 years. However, with a 60-inch rooting depth, they would experience only 11 drought days. With climate change, the number of drought days may well increase, so getting your soils into shape by eliminating hard pans and increasing organic matter is a good investment and a good risk-management strategy. Bahiagrass sod also dramatically reduces soil erosion, as does no-till cropping with cover crops. Including perennial grasses such as bahiagrass into a cropping system is a cost-effective way to hold and slowly build organic matter (Katsvairo et al., 2006). Building and maintaining organic matter enhances many soil func- Under no-till cropping systems and perennial sod, earthworm popu- tions. These functions include nutrient cycling by soil lations increase along with all the benefits they provide, including microbes and earthworms and resistance to soil-borne improved rooting, aeration through worm channels, and better nutrient cycling from worms processing the soil. Conventional till- diseases through the buildup of beneficial nematodes age diminishes surface residue, disrupts earthworm channels, and and fungi. With increases of organic matter, we also see reduces worm populations. improvements in soil tilth, water infiltration, water stor- age capacity, and aeration. many years of small grain or cover crops as make sense No-till and perennial sod increase plant-surface resi- in the system. dues that serve as food for earthworms. Thus, under One challenge of incorporating sod crops into a crop these two cropping practices, earthworm populations rotation is finding a market for the hay. Fortunately, increase along with all the benefits they provide, includ- land capable of producing a 100-bushel per acre corn ing improved rooting, aeration through worm channels, yield will generally produce 5-ton hay yields, making the and better nutrient cycling from worms processing the income potential quite good. With prices of $60 to $70 soil. Conventional tillage, however, diminishes surface per ton being common for ordinary hay, and $3/bale for small 50-pound bales ($120/ton), gross revenues per acre Table 12. Earthworm Numbers from Three Crop from hay will exceed those from corn as long as corn is Rotations in Florida Over a Two-Year Period. under $3.00 per bushel. The net income picture is even Rotation Earthworms/ more encouraging, however, because conventional pro- square meter* duction costs for an acre of corn are quite a bit higher 2004 than for hay. Bahiagrass–Bahiagrass– 9.5 a Katsvairo et al. (2006), in their extensive literature Peanuts–Cotton** reviews, advocated including forage grass into a typical Cotton–Peanuts– 1.2 b cotton-peanut rotation in the Gulf South. These south- Cotton–Cotton ern scientists discussed the benefits of adding bahiagrass 2005 to the peanut-cotton rotation. Besides being drought-tol- erant and well adapted to the South, bahiagrass roots Bahiagrass–Bahiagrass– 24.7 a can also penetrate a hardpan. When the roots die and Peanuts–Cotton decay, they leave channels that allow deeper water pene- Cotton–Peanuts– 7.0 c tration into the soil and are large enough for cotton roots Cotton–Cotton to grow through (Long and Elkins, 1983). Cotton–Peanuts– 14.1 b Perennial bahiagrass can reduce irrigation needs for a fol- Cotton–Cotton lowing annual cotton crop. This is attributable in part to * Numbers followed by a different letter are deeper root penetration by the cotton plants when they significantly different at the 0.05 level. follow perennial grass in rotation. Elkins et al. (1977) determined that for a typical coastal plain sandy-loam ** Underlined entries indicate the period in the soil, a crop with a rooting depth of 12 inches will experi- rotation sequence when worms were sampled. Page 16 ATTRA Sustainable Cotton Production for the Humid South
- 17. residue and disrupts earthworm channels, thereby reduc- ing worm populations. Rodriguez-Kabana et al. (1988) reported Katsvairo et al. (2007) examined earthworm popula- a 98% decrease in tions from two cotton rotations, one containing bahia- root-knot nematodes grass and the other a cotton-peanut rotation. Earthworm at harvest for bahia- numbers were much higher in the bahiagrass rotation grass-rotated pea- than in the cotton-peanut rotation (Table 12). This is nuts, compared to primarily due to the additional food provided by the continuous peanuts, perennial sod roots, increased soil moisture under the and this increased sod, and the lack of soil disturbance from no-till. Earth- yield by up to 27%. worms, through their burrowing, increase soil aeration, Bahiagrass. water infiltration, and root proliferation. The researchers observed cotton roots penetrating the natural soil com- peanuts, and this increased paction zone, cotton roots following earthworm burrows, yield by up to 27%. and earthworms burrowing through old bahiagrass root An interesting no-till double-crop rotation study was channels. Cotton yields were similar under both rota- done on a sandy soil in Georgia (Gascho et al., 2001). tions when averaged over the two-year period. The researchers set out to determine the optimum broiler Weed life cycles are broken when bahiagrass is included litter rate and litter’s effect on plant diseases and nema- in a cotton-peanut rotation because the system shifts todes in a rather complex rotation under irrigated no-till from annual crops to perennial sod. Different herbicides management. The cropping sequence was cotton–fallow could be used on the grass from those normally used on in year one, pearl millet–wheat in year two, then pea- cotton or peanuts. When the grass is grazed or hayed, nut–canola in the third year (Table 13). Broiler litter there is additional weed suppression. was broadcast one to three weeks before planting either winter or summer crops in the rotation at rates of two, Higher peanut yields have been realized following bahia- four, or six tons per acre per year. Winter crops were grass sod. Norden et al. (1980) reported improved peanut no-till planted, while summer crops had in-row sub-soil- yields for up to five years following a long-term bahia- ing and strip tillage. No fertilizer was applied other than grass rotation. In fact, peanut yield increased follow- broiler litter during the entire four-year study. Crops ing even one year of bahiagrass in the rotation (Norden were irrigated as needed. et al., 1980). Rodriguez-Kabana et al. (1988) reported a 98% decrease in root-knot nematodes at harvest for Cotton yields increased from using either the four or six bahiagrass-rotated peanuts, compared to continuous tons/acre litter rate during the first two years of the study (Table 14). But rates above two tons per acre did not Table 13. Cropping Sequence in the Double-Crop increase cotton yields during the last two years of the study, Rotation Study by Gascho, et al., 2001. possibly indicating a cumulative effect. Peanut yields actu- Year First Crop Second Crop ally decreased from poultry litter application. The research- ers concluded that broiler litter was a cost-effective addi- 1 Cotton Fallow tion to all their no-till crops except peanuts. In the case 2 Pearl millet Wheat of cotton, the yield gains were 583, 734, and 673 pounds 3 Peanut Canola per acre for two, four, or six tons of broiler litter per acre, respectively, av- eraged over Table 14. Effect of Poultry Litter on Yields of Various Crops Averaged Over the the four-year Four-Year Study Period. study period. Litter rate Wheat Canola Cotton Pearl millet Peanut At a sale price Tons/acre Pounds/acre Pounds/acre Pounds/acre Pounds/acre Pounds/acre of $.65/pound, 0 733 885 581 1965 2906 that amounts to $379, $477, and 2 1781 1559 1164 3253 2654 $437 per acre 4 2888 2008 1315 3505 2610 gain above no 6 2949 1970 1254 3718 2420 litter or fertil- www.attra.ncat.org ATTRA Page 17
- 18. izer. At a litter price of $15/ton, the per acre litter costs would be $30, $60, or $90 per acre, respectively. Root-knot nematode numbers were generally low, with no galls showing up on any sampled plants through- out the study. Stubby-root nematodes increased in cot- ton, canola, and peanut with the age of the study but never reached harmful levels. Ring nematodes were low overall. The severity of Rhizoctonia limb rot in peanuts increased with litter rate during the middle two years of the study. Lodging in the canola crop during the last year of the study was caused by Sclerotinia and was related to litter application. Soil Moisture Management Peanuts in straw mulch, Georgia. Photo: Rex Dufour, NCAT Drought Resistance Your soil can be made more drought-resistant by You can drought proof your soils by: increasing the organic matter in it. Since rainwater is free, why not capture as much of it as possible and • Increasing levels of organic matter store it in the soil for future plant use? And wouldn’t (which stores water) it be good if plant roots could penetrate the soil and • Using no-till and leaving mulch residues proliferate as much as possible? One way to achieve that protect the soil from the sun and these benefits is through management of organic matter, increase water infiltration which can increase water storage by 16,000 gallons per acre for each one percent of organic matter (Scott et al., 1986). That is roughly 1.5 quarts of water per cubic Ground cover can also reduce water evaporation from foot of soil for each percent of organic matter. Figure soil. In a Kentucky study, surface evaporation was five 2 shows the relationship of organic matter to water- times less under no-till (which leaves a surface mulch) holding capacity. than with conventional tillage during the May to September season (Table 15). Because less water was lost to evaporation, more water was available for plants. Tillage systems and equipment have enormous impacts on water infiltration, storage, and plant water-use efficiency. These impacts include mechanical stress on soil aggregates, adverse effects on soil microorganisms, and the tendency to create hardpans. Of most importance to drought-resistance, however, is the extent to which a surface cover is maintained. Table 15. Water Evaporation and Transpiration* from Tillage Types Over a 5-Month Growing Season (Phillips, 1980) Tillage Evaporation Transpiration* Type mm of water (inches) mm of water (inches) No-Till 41 (1.6) 307 (12.1) Conven- 191 (7.5) 242 (9.5) Figure 2. The soil’s ability to hold water increases tional Till significantly as the percentage of soil organic * Transpiration is the release of water vapor matter increases. (Scott, H.D., et al., 1986) by plants. Page 18 ATTRA Sustainable Cotton Production for the Humid South
- 19. a sorghum crop. To summarize, a June-harvested wheat crop is followed by fallow until the following June, when sorghum is planted. Following sorghum harvest in October, fallow ensues until the following October, wwhen wheat is planted again. In this study, cotton was substituted for sorghum in the typical rotation for that region. The study showed that crop residues increased soil water- storage during the fallow period. During the first year of the study, when less than three and one-half inches of rain fell, available soil water during the fallow period was five inches for no-till, four inches for sweep till, and two and one-half inches with disk tillage. In the second year of the study, when nearly 12 inches of rain fell, 8 inches of soil water was stored in all the tillage treatments. This killed cover crop mulch conserves soil moisture and protects the soil from erosion. Georgia 2008. Photo: Rex Dufour, NCAT Table 16 shows three different tillage methods and how they affect water entry into the soil. Notice the direct Soil under no-till has more than relationship between tillage type, ground cover, and water three times the water infiltration infiltration. No-till has more than three times the water of moldboard-plowed soil. infiltration of moldboard-plowed soil. Additionally, the no-till field would have higher soil particle aggregation from the organic matter decomposing on-site. Irrigation Table 17 shows the differences in water infiltration A team of North Carolina scientists compared overhead in dry soil between no-till and conventional tillage sprinkler irrigation with subsurface drip irrigation (Nuti systems. With no-till, wet soil has more than double the et al., 2006). Lint yield averaged 1247 pounds per acre infiltration rate compared to tilled wet soil. under overhead sprinkler irrigation and 1310 pounds per In a dryland Texas study, Baumhardt et al. (2008) set out acre with subsurface drip irrigation. Though these yields to determine tillage-system effects on soil water-storage were statistically similar, plants grown using subsurface and cotton yield. Typical crop rotation sequences in the drip exhibited more vigorous growth, improved fiber study include a year of fallow between a wheat crop and length, more second-position bolls, more total bolls per plant, and an improved percentage of fruit retention Table 16. Tillage Effects on Water Infiltration and (Nuti et al., 2006). The researchers also recognized that Ground Cover (Boyle and Frankburger, 1989) with subsurface drip (SSD), cotton can be irrigated after bolls open, and subsurface drip can provide water in Water Infiltration Ground Cover more precise increments. (mm/minute) Percent No-Till 2.7 48 Whitaker et al. (2008) also compared subsurface drip Chisel Plow 1.3 27 with overhead irrigation at two locations (Stripling and Lang) in Georgia. Irrigation treatments consisted of Moldboard 0.8 12 overhead irrigation that was activated when soil moisture Plow reached minus 5.8 pounds/inch2 at the 8-inch depth or Table 17. Effects of Tillage on Water Infiltration minus 7.25 pounds/inch2 at the 16- or 24-inch depths. in a Silt Loam Soil (Mcgregor et al., 1991) When these soil conditions were met, one inch of water was applied to the cotton crop. Two subsurface drip sys- Tillage Dry Soil Wet Soil tems were installed, one that was activated at the same History mm water/hour mm water/hour time as the overhead irrigation and applied the same No-Till 43 22 amount of water (SSD matched), and the other activated Conventional 31 10 based on the same soil moisture conditions but applying Till only 0.3 to 0.60 inches of water (SSD reduced). www.attra.ncat.org ATTRA Page 19