Comparing Energy Use in Conventional and Organic Cropping Systems
•
2 gefällt mir•1,903 views

Comparing Energy Use in Conventional and Organic Cropping Systems

Empfohlen
Empfohlen
Weitere ähnliche Inhalte
Was ist angesagt?
Was ist angesagt? (19)
Andere mochten auch
Ähnlich wie Comparing Energy Use in Conventional and Organic Cropping Systems
Ähnlich wie Comparing Energy Use in Conventional and Organic Cropping Systems (20)
Mehr von ElisaMendelsohn
Mehr von ElisaMendelsohn (20)
Kürzlich hochgeladen
Kürzlich hochgeladen (20)
Comparing Energy Use in Conventional and Organic Cropping Systems
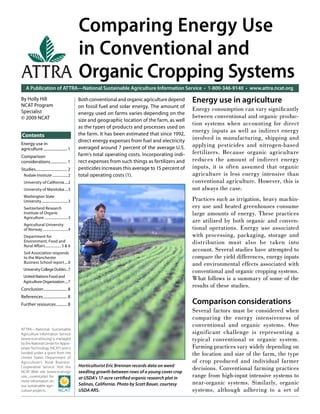
- 1. Comparing Energy Use in Conventional and ATTRA Organic Cropping Systems A Publication of ATTRA—National Sustainable Agriculture Information Service • 1-800-346-9140 • www.attra.ncat.org By Holly Hill Both conventional and organic agriculture depend Energy use in agriculture NCAT Program on fossil fuel and solar energy. The amount of Specialist Energy consumption can vary significantly energy used on farms varies depending on the © 2009 NCAT between conventional and organic produc- size and geographic location of the farm, as well tion systems when accounting for direct as the types of products and processes used on the farm. It has been estimated that since 1992, energy inputs as well as indirect energy Contents involved in manufacturing, shipping and direct energy expenses from fuel and electricity Energy use in averaged around 7 percent of the average U.S. applying pesticides and nitrogen-based agriculture ........................ 1 farm’s total operating costs. Incorporating indi- fertilizers. Because organic agriculture Comparison considerations ................. 1 rect expenses from such things as fertilizers and reduces the amount of indirect energy Studies................................ 2 pesticides increases this average to 15 percent of inputs, it is often assumed that organic Rodale Institute ..................2 total operating costs (1). agriculture is less energy intensive than University of California ....2 conventional agriculture. However, this is University of Manitoba ....3 not always the case. Washington State University ................................3 Practices such as irrigation, heavy machin- Switzerland Research ery use and heated greenhouses consume Institute of Organic large amounts of energy. These practices Agriculture ...........................3 are utilized by both organic and conven- Agricultural University of Norway .............................4 tional operations. Energy use associated Department for with processing, packaging, storage and Environment, Food and Rural Affairs .................. 5 & 6 distribution must also be taken into Soil Association responds account. Several studies have attempted to to the Manchester compare the yield differences, energy inputs Business School report ....6 and environmental effects associated with University College Dublin...7 conventional and organic cropping systems. United Nations Food and Agriculture Organization ....7 What follows is a summary of some of the results of these studies. Conclusion ........................ 8 References ........................ 8 Further resources ........... 8 Comparison considerations Several factors must be considered when comparing the energy intensiveness of conventional and organic systems. One ATTRA—National Sustainable Agriculture Information Service significant challenge is representing a (www.ncat.attra.org) is managed typical conventional or organic system. by the National Center for Appro- priate Technology (NCAT) and is Farming practices vary widely depending on funded under a grant from the United States Department of the location and size of the farm, the type Agriculture’s Rural Business- of crop produced and individual farmer Horticulturist Eric Brennan records data on weed Cooperative Service. Visit the decisions. Conventional farming practices NCAT Web site (www.ncat.org/ seedling growth between rows of a young cover crop sarc_current.php) for at USDA’s 17-acre certified organic research plot in range from high-input intensive systems to more information on our sustainable agri- Salinas, California. Photo by Scott Bauer, courtesy near-organic systems. Similarly, organic culture projects. USDA ARS. systems, although adhering to a set of
- 2. standards, differ in implementation. Some three-year rotation of hairy vetch/corn and organic farms are highly sustainable rye/soybeans and wheat. The two organic ecological systems, but some are large-scale systems receive no chemical fertilizers or monocropping or mass livestock operations pesticides. that operate like conventional farms, with David Pimentel, a Cornell University profes- the exception of not using synthetic pesti- cides, fertilizers and veterinary drugs (2). sor of ecology and agriculture, was the lead author of this study and concluded that “fos- Other factors that affect a reliable compari- sil energy inputs in organic corn production son of conventional and organic agricultural were 31 percent lower than conventional corn systems include: production, and the energy inputs for organic • Limited research in the United States soybean production were 17 percent lower than conventional soybean production.” (3) Many of the studies included in this www.organic-center.org/reportfiles/ENERGY_ publication are international in scope. SSR.pdf This is due to a lack of comparison trials in the United States. Energy utilization Sustainable Agriculture comparisons are difficult among countries Farming Systems Project: Related ATTRA because differences in climatic conditions Publications and crop rotations affect inputs and yields. University of California, Davis Farm Energy International organic certification standards A team of researchers, farmers and farm Calculators: Tools also may differ somewhat from U.S. advisors established the Sustainable Agri- for saving money Department of Agriculture standards. culture Farming Systems project (SAFS) on the farm at the University of California, Davis, in • Structure of comparison Efficient 1988 to study the transition from conven- Agricultural Buildings: One issue that affects reliable compar- tional farming systems to low-input organic An Overview ison is how to account for the potential systems. The project has compared four yield differences between systems. Should systems: organic, low-input, conventional Energy Savings Tips for Irrigators energy consumption be measured per unit four-year rotations and a conventional two- of land area, per unit of economic activity year rotation. Cash crops in the four-year Renewable or per unit of produce? rotations include processing tomatoes, Energy Opportunities on the Farm • Boundaries of comparison saff lower, dry beans, wheat and corn. The two-year rotation includes tomatoes Federal Resources Another issue is how to account for embed- and wheat. for Sustainable ded and indirect energy consumption. How Farming and Ranching do comparisons incorporate pre- and post- The team found that the low-input system Federal Conservation production energy inputs? was most energy efficient and that crop Resources yields were comparable among the differ- ent systems. Tomato and corn yields in the Food Miles: Studies organic system were a little lower than in Background and Marketing Rodale Institute the low-input and conventional systems, Farming Systems Trial mainly from nitrogen limitations. Differ- ences in yields were much greater between The widely referenced 27-year Rodale Insti- years than between systems. tute Farming Systems Trial (FST) is the longest-running side-by-side comparison of The SAFS team concluded that “the organic organic and conventional corn and soybean system is less efficient than the low-input production systems in the United States. system because of the great distance that The study compares a conventional farm many organic fertilizers (such as dried sea- that uses recommended fertilizer and pes- weed) are shipped before arriving at the ticide applications with an organic animal- field, and because of energy requirements based farm where manure is applied and for mechanical weed control.” (4) an organic legume-based farm that uses a http://wsare.usu.edu/pro/pr2001/SW99-008.pdf Page 2 ATTRA Comparing Energy Use in Conventional and Organic Cropping Systems
- 3. University of Manitoba Glenlea environmental and economic sustainability, Study of long-term rotations this study rated the organic system first, the integrated system second and the conven- The Glenlea Study began in 1992 with tional system last. the objective of creating a long-term compari- son of the biological, environmental and eco- Researchers measured several indicators nomic impacts associated with conventional, of sustainability, including energy effi- low-input and organic cropping systems. ciency. Energy accounting was divided into Reseachers analyzed energy use between inputs such as labor, fuel, fertilizers and 1992 and 2003. The experiment included so on; output, or yield; and output-to-input two four-year crop rotations of either wheat- ratios, or a measure of energy efficiency. pea-wheat-fl ax (WPWF) or wheat-alfalfa- Cumulative energy inputs and outputs for alfalfa-fl ax (WAAF); and two crop input the six-year study period were lower for the combinations of either a fertilizer- and organic system than for the conventional herbicide-added (F+H+) conventional and integrated systems. The output-to-input system or a no-inputs organic system (F-H-). ratio for the organic system during the See Table 1 for more information. six-year study period, however, was 7 per- This study found that eliminating fertilizer and cent greater than that for the conventional pesticide inputs in the organic system resulted system and 5 percent greater than that for in energy-use reductions. Also notable is the the integrated system, making the organic potential of perennial forage legume crops, in system the most energy efficient (5). this case alfalfa, in reducing energy use. Learn more about the study online at www. For a full discussion of results, along with crop- nature.com/nature/journal/v410/n6831/full/ ping system yield information, weed dynamics, 410926a0.html. soil nutrient status and economic analysis, see the Glenlea Study Web site at www.umanitoba. Switzerland Research Institute ca/faculties/afs/plant_science/glenlea/ glenlearesresults.html. of Organic Agriculture: Soil Fertility and Biodiversity Washington State University: in Organic Farming Sustainability of three apple The DOK (bio-Dynamic, bio-Organic, and production systems Konventional) long-term field experiment was In this study, researchers at Washington State developed in 1978 in Therwil, Switzerland. University investigated the sustainability The experiment investigated differences in of organic, conventional and integrated crop yield, soil biology, environmental health apple production systems in Washing- and product quality among organic, biody- ton State from 1994 to 1999. In terms of namic and conventional agriculture methods. Table 1. Total rotational energy consumption (MJ/ha)* in the Glenlea long-term cropping systems study, 1992-2003 Total Seed energy Fuel and Machinery Pesticide Fertilizer Rotation Inputs energy lube energy energy energy energy consumption WPWF F+H+ 68,498 7,902 16,133 2,367 7,116 34,980 WPWF F-H- 24,233 7,902 14,229 2,102 0 0 WAAF F+H+ 49,255 3,657 18,184 2,515 3,499 21,400 WAAF F-H- 22,181 3,657 16,213 2,311 0 0 WPWF = wheat-pea-wheat-flax; WAAF = wheat-alfalfa-alfalfa-flax *MJ/ha=megajoules/hectare www.attra.ncat.org ATTRA Page 3
- 4. Between 1978 and 1998, this Swiss exper- www.mindfully.org/Farm/Organic-Farming- iment evaluated energy use for potatoes, Fertility-Biodiversity31may02.htm. winter wheat, beetroots, barley and grass- clover under four different cropping systems: Agricultural University of 1) BIODYN, or biodynamic; Norway: Energy Utilization in 2) BIOORG, or bioorganic; Crop and Dairy Production in Organic and Conventional 3) CONFYM, or conventional using mineral Livestock Production Systems fertilizer plus farmyard manure; and This study used data recorded between 4) CONMIN, or conventional using mineral 1990 and 1992 from 14 organic and 17 fertilizer exclusively. conventional farms affiliated with the Nor weg ian Inst itute of Ag r iculture This study found that the organic farming Science. All of the farms studied had dairy systems used from 20 to 56 percent less production combined with grain produc- energy to produce a crop unit, measured in tion, except two of the organic farms that metric tons. Per land area this difference had beef cattle as the main endeavor. was from 36 to 53 percent. See Table 2 for additional information (6). Energy use was analyzed for small grains, grass clover and fodder beets in three soil For more information on this experi- types. Energy price was determined by the ment, visit http://orgprints.org/7682/01/ total number of energy inputs in megajoules Fliessbach_ et_ al_ DOK-trial.doc a nd divided by the total yield output in kilograms. Table 2. Energy input per unit land area (GJ ha–1) in the second crop rotation (n = 3) Crop BIODYN BIOORG CONFYM CONMIN Potatoes 26.39 28.42 39.85 40.69 Winter wheat 1 12.52 11.56 18.88 19.74 Beetroots 16.31 15.14 28.53 31.56 Winter wheat 2 10.31 9.79 20.49 21.81 Barley 8.82 9.62 16.29 15.78 Grass-clover 6.43 7.63 6.78 6.75 sowing year Grass-clover 3.91 4.27 5.22 11.75 1st year Grass-clover 4.86 6.48 9.98 20.47 2nd year Sum 89.55 92.91 146.02 168.55 Mean (energy 12.79 13.27 20.86 24.08 input per year, sum/7) Mean% (CONFYM = 61 64 100 115 100%) biodynamic bioorganic with manure without manure Page 4 ATTRA Comparing Energy Use in Conventional and Organic Cropping Systems
- 5. This study found that “conventional crop • Organic crops still show a lower yields were higher but they also used more energy per unit when energy input indirect energy with input factors, espe- is analyzed per yield, but the dif- cially fertilizers. The conventional yields ference is reduced due to the lower were not sufficiently higher to compensate organic output. Organic carrots are for the extra use of energy compared with more energy intensive due to flame the organic crops.” (7) weeding and higher distribution costs than conventional carrots. See Learn more about this study at http:// Figure 2 for a graph of energy input orgprints.org/6189/01/6189.pdf. by category on a unit output basis. For livestock enterprises, energy input is lower Department for Environment, in organic systems, particularly dairy. See Food and Rural Affairs: Energy Figure 3 (next page) for a graph of direct use in organic farming systems and indirect energy inputs into livestock The United Kingdom Department for enterprises (8). Environment, Food and Rural Affairs (DEFRA) has conducted a number of stud- Figure 1. Energy input by category on an area basis (MJ/ha) ies related to the sustainability of organic agriculture systems. The objective of this March 2000 report was to develop a model of energy inputs in organic farming systems. The model was used to compare energy use in organic and conventional systems of similar capacities. The model incorporated average yield data from previous studies including vegetables, dairy, beef and sheep. This report also took into account energy use associated with transportation. Among the results found in this study, the following points were established: • Mechanical weeding of organic crops involved less energy than herbicides did in conventional production. Figure 2. Energy input by category on a unit output basis (MJ/t yield) • Flame weeding may involve as much or more energy than herbicides. • Transport energy inputs for organic vegetable crops are greater because of smaller production levels, smaller delivered loads and longer average distances to certificated organic packing facilities. • Organically grown crops have a lower energy input per unit area than conventional crops, largely because of lower fertilizer and pesticide inputs. See Figure 1 for a graph of energy input by category on an area basis. www.attra.ncat.org ATTRA Page 5
- 6. Figure 3. Direct and indirect energy inputs into livestock enterprises conventional potato production because cooling and storage account for 40 percent of the energy use in potato production for both organic and nonorganic crops. • Organic milk production appears to require less energy but much more land than conventional production. It also creates more emissions of greenhouse gases, acid gases and eutrophying substances per unit of milk produced. • Organic production of beef, sheep and pig meat is associated with lower energy demands, but organic poultry requires higher energy inputs. See Table 3 (next page) for more information. The DEFRA report concludes that more research needs to be done in order to more For more information on this study, accurately determine the environmental visit http://randd.defra.gov.uk/Document. impacts of organic and conventional foods (9). aspx?Document=OF0182_181_FRP.pdf. This article received much press with titles such as “Why going organic could cost the Department for Environment, earth,” “UK research casts doubt on environ- Food and Rural Affairs: mental claims” and “How green is organic?” Environmental Impacts of Food In response, the Soil Association released a Production and Consumption statement to assure consumers of the benefits This 200-page report was released by of organic food. See the following summary DEFRA in December 2006 with the objec- for details: http://randd.defra.gov.uk/Document. tive of informing government policy about aspx?Document=EV02007_4601_FRP.pdf reducing the environmental impacts of food consumed in the United Kingdom. Soil Association responds to Included in this study was an analysis of the Manchester Business School the environmental impacts of organic ver- sus conventional food systems in the United report: Environmental Impacts Kingdom. The report states producing many of Food Production and foods organically affects the environment Consumption less than producing the foods conventionally. The Soil Association argued that organic However, that is not true for all foods and farming is about 30 percent more energy effi- is rarely true for all classes of environmen- cient for producing the same quantity of food tal effects. The report said that not enough as conventional agriculture. In their argu- evidence is available to state that organic ment, the association included the following agriculture will have fewer harmful effects on list of food products and how much energy the environment than conventional systems. an organic system required to produce the More specifically, the DEFRA report food in comparison to a conventional system. proposed the following: See Table 3 (next page) for more information. • Organic potato production has The Soil Association also promoted the other similar energy requirements to environmental benefits of organic agriculture, Page 6 ATTRA Comparing Energy Use in Conventional and Organic Cropping Systems
- 7. Table 3. Energy used to produce food United Nations Food and products in organic agriculture systems compared to conventional systems Agriculture Organization: Energy Use in Organic Food Systems Leeks 58% less Onions 16% less This report, released in August of 2007 by the Food and Agriculture Organization of Milk 38% less Pig meat 13% less the United Nations, used existing research to Beef 35% less Potatoes 2% more examine the potential of organic and nonor- ganic agricultural systems to reduce energy Wheat 29% less Eggs 14% more consumption and mitigate climate change. Tomatoes (long season) The study revealed the following points: Carrots 25% less 30% more • In most cases, organic agriculture Lamb 20% less Chicken 32% more uses from 30 to 50 percent less energy in production than compa- including improved soil quality, supporting rable conventional agriculture. local food markets, increased biodiversity and reduced pesticide pollution, water usage and • Organic agriculture typically uses packaging waste. For more information, energy more efficiently than nonor- visit www.soilassociationorg/web/sa/saweb.nsf/ ganic agriculture. 89d058cc4dbeb16d80256a73005a2866/ 80ca2af0ab639f5a8025728800608e08! • Organic agriculture often requires Open Document. a bout one t h i rd add it iona l human labor hours as a trade-off University College Dublin: for energy-intensive inputs used in Greenhouse Gas Emissions conventional agriculture. from Conventional, The report indicated that further research Agri-Environmental Scheme and is needed to determine whether reductions Organic Irish Suckler-Beef Units in energy consumption on the production In this study, 15 suckler-beef units in south- side of organic systems are maintained ern Ireland were assessed in terms of green- through post-production processing, pack- house gas emissions. The units included aging and transport. five conventional, five organic and five According to the Food and Agriculture Rural Environmental Protection Scheme Organization, “Organic agriculture holds (REPS) systems. REPS was implemented in a great potential for pioneering energy- Ireland as a system for rewarding farmers that reducing practices through the framework adhere to strict guidelines regarding nutrient management and habitat conservation. of organic standards. Organic principles, which emphasize environmental stewardship, Emissions factors considered included diesel farm-level self-sufficiency and incorpora- fuel used, fertilizer applied, manure manage- tion of externalities, can be leveraged to ment and electricity, among others. Results develop strategies for limiting use of fossil of this study indicated that applying REPS fuel-based energy in organic agriculture. systems would result in less greenhouse gas Especially in the areas of post-production emissions in comparison to conventional handling, innovations in the organic supply suckler-beef production. Emissions could chain to decrease energy consumption can be reduced even more by applying organic influence parallel conventional sectors.” (2) systems, but would result in a substan- tial drop in production (10). For additional Visit www.fao.org/docs/eims/upload/233069/ information on this project, visit http://jeq. energy-use-oa.pdf for additional information scijournals.org/cgi/content/full/35/1/231. on this research. www.attra.ncat.org ATTRA Page 7
- 8. Conclusion cases. In some cases, organic agriculture As is apparent in a review of existing may be more energy intensive depending on studies, there are many complexities the specific farming operation, the crop pro- involved in comparing energy consumption duced and the post-production handling. It in conventional and organic cropping sys- is important to assess the energy intensive- tems. Some research indicates that organic ness of food systems in a holistic manner agriculture is more energy efficient than that incorporates energy consumption for conventional agriculture, but not in all the entire life cycle of the food product. References 1) Shoemaker, Robin, et al. 2006. Agriculture and Farming Systems. http://randd.defra.gov.uk/Document. Rural Communities Are Resilient to High Energy aspx?Document=OF0182_181_FRP.pdf. Costs. Amber Waves. April 2006. www.ers.usda.gov/ 9) Department for Environment, Food and Rural AmberWaves/April06/Features/Energy.htm. Affairs. December 2006. Environmental Impacts of 2) Ziesemer, Jodi. August 2007. Energy Use Food Production and Consumption. http://randd.defra. in Organic Food Systems. Natural Resources gov.uk/Document.aspx?Document=EV02007_4601_ Management and Environment Department, Food and FRP.pdf Agriculture Organization of the United Nations. 10) Casey, J.W. et al. April 2005. Greenhouse Gas www.fao.org/docs/eims/upload/233069/energy-use-oa.pdf. Emissions from Conventional, Agri-Environmental 3) Pimentel, David. August 2006. Impacts of Organic Scheme, and Organic Irish Suckler-Beef Units. Farming on the Efficiency of Energy Use in Agri- University College Dublin. http://jeq.scijournals.org/cgi/ culture. An Organic Center State of Science Review. content/full/35/1/231 www.organic-center.org/reportfiles/ENERGY_SSR.pdf. 4) The Transition from Conventional to Low-Input Further resources or Organic Farming Systems: Soil Biology, Soil Granatstein, David. Does Organic Farming Use Less Chemistry, Soil Physics, Energy Utilization, Energy? Compared to what? Washington State Uni- Economics, and Risk. November 2000. University versity. Presentation at the ACEEE Conference, Food of California Sustainable Agriculture Research and and Energy from the Ground Up: Efficiency’s Role in Education Program. www.sarep.ucdavis.edu/Grants/ Sustainable Agriculture, Des Moines, Iowa, February Reports/Temple/temple88-225.htm. 20–22, 2008. www.aceee.org/conf/08ag/presentations/ DGranatstein.pdf 5) Reganold, John, et al. April 2001. Sustainability of three apple production systems. Nature. Washington State University. www.nature.com/nature/journal/v410/ n6831/full/410926a0.html. Comparing Energy Use in Conventional and Organic Cropping Systems 6) Mader, Paul, et al. May 2002. Soil Fertility By Holly Hill and Biodiversity in Organic Farming. Science. NCAT Program Specialist Switzerland Research Institute of Organic Farming. © 2009 NCAT www.mindfully.org/Farm/Organic-Farming-Fertility- Holly Michels, Editor Biodiversity31may02.htm. Amy Smith, Production 7) Refsgaard, Karen, et al. November 1997. Energy This publication is available on the Web at: Utilization in Crop and Dairy Production in Organic www.attra.ncat.org/attra-pub/croppingsystems.html and Conventional Livestock Production Systems. Agri- or cultural Systems. Agricultural University of Norway. www.attra.ncat.org/attra-pub/PDF/croppingsystems.pdf http://orgprints.org/6189/01/6189.pdf. IP339 Slot 337 8) Department for Environment, Food and Version 051409 Rural Affairs. March 2000. Energy Use in Organic Page 8 ATTRA