Esri News for Facilities Winter 2012/2013 newsletter
•
1 gefällt mir•618 views

Esri News for Facilities Winter 2012/2013 newsletter

Empfohlen
Weitere ähnliche Inhalte
Was ist angesagt?
Was ist angesagt? (20)
Ähnlich wie Esri News for Facilities Winter 2012/2013 newsletter
Ähnlich wie Esri News for Facilities Winter 2012/2013 newsletter (20)
Mehr von Esri
Mehr von Esri (20)
Kürzlich hochgeladen
Kürzlich hochgeladen (20)
Esri News for Facilities Winter 2012/2013 newsletter
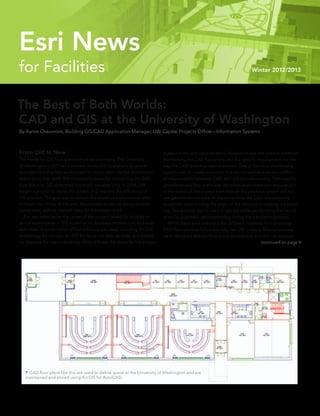
- 1. for Facilities Winter 2012/2013 Esri News The Best of Both Worlds: CAD and GIS at the University of Washington By Aaron Cheuvront, Building GIS/CAD Application Manager, UW Capital Projects Office—Information Systems From Old to New The needs for GIS floor plans are varied and many. The University of Washington (UW) had a process to use GIS floor plans for space management that had worked well for many years. As the inventory of space grew over time, the manual processes for converting the CAD floor plans to GIS consumed too much valuable time. In 2008, UW began a project to revise the system and improve the efficiency of the process. The goal was to reduce the dozen or more manual steps to fewer than three. In the end, the process ended up being entirely automated, with no manual steps for translation at all. Esri was selected at the outset of the project based on its position as the world leader in GIS as well as its database architecture and avail- able tools. A combination of Esri software was used, including ArcSDE technology for storage, ArcGIS for Server for web services, and ArcGIS for Desktop for map publishing. While GIS was the driver for the project, it was not the only consideration. Paramount was the need to continue maintaining the CAD floor plans and the specific requirements for the way the CAD drawings were prepared. One of the most challenging aspects was to create a solution that would resolve a serious conflict of requirements between CAD and GIS: georeferencing. The need for georeferenced floor plans was identified as an important requirement at the outset of the project even though the previous system did not use georeferenced data. At the same time, the CAD requirements would not allow moving the origin of the drawing or rotating the build- ing. The solution was to use a single world file per building that would allow for automatic georeferencing during the translation process. While there were already a few different methods for translating CAD floor plans to GIS, none fully met UW’s needs. Most processes were designed entirely from a GIS perspective and did not address continued on page 4 CAD floor plans like this are used to define space at the University of Washington and are maintained and stored using ArcGIS for AutoCAD.
- 2. Winter 2012/2013 Esri News for Facilities is a publication of the Government Solutions Group of Esri. To contact the Esri Desktop Order Center, call 1-800-447-9778 within the United States or 909-793-2853, ext. 1-1235, outside the United States. Visit the Esri website at esri.com. View Esri News for Facilities online at esri.com/fm or scan the code below with your smartphone. Advertise with Us E-mail ads@esri.com. Submit Content To submit articles for publication in Esri News for Facilities, contact Karen Richardson at krichardson@esri.com. Manage Your Subscription To update your mailing address or subscribe or unsubscribe to Esri publications, visit esri.com/publications. International customers should contact an Esri distributor to manage their subscriptions. For a directory of distributors, visit esri.com/distributors. Circulation Services For back issues, missed issues, and other circulation services, e-mail requests@esri.com; call 909-793-2853, extension 2778; or fax 909-798-0560. 2 Esri News for Facilities Winter 2012/2013 Contents Cover 1 The Best of Both Worlds: CAD and GIS at the University of Washington Case Study 3 Green Goes Underground 5 Cornerstone Partner Spotlight 6 Integrating GIS into Your Facilities Workflow Solution 9 ArcGIS for Facilities Portal Esri News 10 Esri Online 10 Washington, D.C. was the venue for the latest in Government GIS Software 11 ArcGIS for AutoCAD: Maximize CAD and GIS across the Enterprise The information contained in this work is the exclusive property of Esri or its licensors. This work is protected under United States copyright law and other international copyright treaties and conventions. No part of this work may be reproduced or transmitted in any form or by any means, electronic or mechanical, including photocopying and recording, or by any information storage or retrieval system, except as expressly permitted in writing by Esri. All requests should be sent to Attention: Contracts and Legal Services Manager, Esri, 380 New York Street, Redlands, CA 92373-8100 USA. The information contained in this work is subject to change without notice. The Geographic Advantage, Esri, the Esri globe logo, 3D Analyst, ArcAtlas, ArcCatalog, ArcData, ArcDoc, ArcEditor, ArcExplorer, ArcGIS, the ArcGIS logo, ArcGlobe, ArcIMS, ARC/INFO, ArcInfo, ArcLogistics, ArcMap, ArcNetwork, ArcNews, ArcObjects, ArcPad, ArcPress, ArcReader, ArcSDE, ArcSurvey, ArcToolbox, ArcTools, ArcUser, ArcView, ArcVoyager, ArcWatch, ArcWeb, ArcWorld, ArcXML, Business Analyst Online, BusinessMAP, CommunityInfo, EDN, Geography Network, GIS Day, MapData, MapObjects, Maplex, MapStudio, Model- Builder, MOLE, NetEngine, RouteMAP, SDE, Sourcebook•America, StreetMap, Tapestry, @esri.com, esri.com, arcgis.com, geographynetwork.com, gis.com, and gisday.com are trademarks, service marks, or registered marks of Esri in the United States, the European Community, or certain other jurisdictions. Other companies and products or services mentioned herein may be trademarks, service marks, or registered marks of their respective mark owners. Copyright © 2013 Esri. All rights reserved. Printed in the United States of America.
- 3. Green Goes Underground Underground Visualization of Utilities at Green Square Complex in Raleigh, North Carolina The Green Square Complex—located in the heart of Raleigh, North Carolina’s capital city—is a two-block, multiuse sustainable develop- ment project that is now home to North Carolina’s state environmental offices and the new Nature Research Center. The complex includes two beautifully designed “green” buildings that integrate the gold standard of sustainable design strategies, costing less to operate and maintain by incorporating energy- and water-efficiency tech- niques. The Green Square Complex was built in conjunction with the Department of the Environment and Natural Resources (DENR) and the North Carolina Museum of Natural Sciences to enable those organiza- tions to lead by example in promoting stewardship and Leadership in Energy and Environmental Design (LEED) Gold Standard compliance. The new DENR offices are housed in a five-story building that connects, via a one- level bridge over McDowell Street, to the remaining DENR offices in the adjacent block. The second building on the Green Square Complex is the Nature Research Center, which will connect to the existing North Carolina Museum of Natural Sciences on the opposite side of the Green Square Complex via a two-story bridge over Salisbury Street. The research center was built for scientists to conduct their research while visitors from the neighboring museum observe science in action. Its most unusual design feature is a 50-foot globe of the earth, called The Daily Planet. Project Evolution In spring 2008, planning for the construction of the new buildings and a parking garage on the Green Square Complex began. The civil and structural engineers needed critical depth information regarding the location of the existing above- and belowground utility infrastructure in the roadway around the block. Following a review of engineering firms, the project engineers contracted with Esri partner McKim & Creed’s Subsurface Utility Engineering (SUE) team (Raleigh, North Carolina) to provide the detailed underground utility mapping. By using SUE quality level A locating services (the highest level of accura- cy), which use nondestructive pneumatic vacuum excavation to expose subsurface utilities, data regarding the precise vertical, horizontal, pipe diameter, and type of utility was collected for accurately planning the construction of the project. While the standard delivery method for this sort of information is typically a CAD or MicroStation drawing file, with so much exact data and information collected, the team created a GIS geodatabase to house the information. Advanced Utility Mapping To protect the foundation of the existing Old Education Building (built in 1938) located on the Green Square Complex block, stabilization of the soil was needed in a pit dug around the perimeter where the two new buildings were to be constructed. To shore the soil slope and prevent landslides, steel reinforcement bars were inserted into the soil and anchored to the soil strata in a pit roughly 40–50 feet deep, a technique called soil nailing or pinning. The construction process starts by drilling holes for the steel bar and grouting the nails into the soil to create a composite mass. Precise SUE data was used for determining the drilling location so the nails would not be bored into the utilities. Since the SUE team collected 139 test hole locations (pneumatic vacuum excavated) on the utilities, a true-to-life, three-dimensional model was created of the underground and aboveground features around the Green Square Complex to assist in determining the nail locations. Using ArcGIS (3D Analyst extension) to create the 3D environ- ment, first a TIN was generated from the survey contours to establish the ground surface elevation. The building corners were surveyed and the footprints ex- truded as a multipatch feature class. An exist- ing 3D SketchUp building model (downloaded from the Trimble 3D Warehouse) on the Green Square Complex block was imported to replace one of the existing buildings. The utility pipe geometry was given the correct elevation values based on the test hole data. Once all the data was spatially correct hori- zontally and vertically, the Green Square Complex 3D Utility Inventory was ready for rendering. Many of the point features are imported from the file model components, such as the sanitary sewer manhole covers, the concrete underground storm water drains, and the power and telephone utility poles. The pipes are 3D simple line tube symbols color-coded per specific utility system (blue for water, red for electric, green for sewer, orange for telephone/fiber optic, yellow for gas, and purple for storm water). When the existing pipes were removed and/or new ones added during the Green Square Complex construction phase, the information was captured for easy updates to the utility inventory atlas that the city maintains, thereby taking the SUE data to a higher level. When the technologies used to locate belowground infrastructure were paired with advanced utility mapping, such as GIS and 3D GIS modeling, city and Green Square Complex facility managers developed a utility inven- tory atlas to aid in damage prevention programs. This atlas will serve as a continually growing library for managing existing utility location data and future data that may be collected. For more information, contact Julie Willett, GISP, McKim & Creed (tel.: 919-233-8031, e-mail: jwillett@mckimcreed.com), or W. Sean Patterson, SUE project manager, McKim & Creed (tel.: 919-233-8031, e-mail: spatterson@mckimcreed.com). With so much exact data and information collected, the team created a GIS geodatabase to house the information. 3Winter 2012/2013 esri.com/fm Case Study
- 4. the complete workflow. UW’s solution is designed from a CAD user perspective for maintenance but results in a GIS output that is much more flexible than CAD could ever be. Standards, Standards, Standards Did I mention standards? It turns out standards are important. More time and money for the project was spent on the standardization and cleanup of the CAD drawings than anything else. By defining a good set of CAD standards and, more importantly, enforcing them, the process of writing code to perform automation could be accomplished. While trying to write some automation code, the unpredictable nature of the source data (CAD) turned out to be too complex to be worth the effort. By standardizing, the custom code was much easier to write. What about BIM? When the system was redesigned, building information modeling (BIM) was not part of the picture. Since then, some models have been incorporated into the inventory but are not fully automated yet. The current process requires exporting the “sheets” to CAD, which com- pletely overrides the existing CAD drawing. The process with BIM now requires a couple of manual processes, but the efficiencies of updating in BIM more than make up for it. So How Does It Work? Unfortunately, it’s impossible to describe all the nuts and bolts of what it takes to make a system like this work in a short article, but the key to the entire process is ArcGIS for AutoCAD. ArcGIS for AutoCAD provides the functionality to create GIS feature classes within the CAD drawing itself. The end result is that the translation is not a CAD to GIS translation but actually a feature class to feature class translation. It also means that it doesn’t matter which “flavor” of AutoCAD is used. The GIS feature class schema from ArcSDE is replicated in CAD, which makes the translation simple. The translation itself is a combination of a Python script and Safe Software’s FME. The whole process runs every hour and is able to identify any floor plans that have changed since the last run and only processes those drawings that have changed. Using GIS Floor Plans: The New “Basemap” The core need for the UW GIS floor plan system is the space manage- ment system, but by leveraging that initial investment and combining it with a couple other pieces of technology, UW is taking GIS floor plans to a whole new level. One of the capabilities that has become very important for using GIS floor plans is the Data Driven Pages system released with ver- sion 10.0 and enhanced at ArcGIS 10.1. One of the major differences between traditional GIS and GIS for interior building space is that the floor plan itself becomes the basemap that all other data uses for context. Moreover, without filtering the data by building and/or floor, it is impossible to make any sense of the data. The Data Driven Pages system provides an excellent framework for addressing the filtering problem. Another crucial component is the Attribute Assistant found in the Campus Editing template. By combining Data Driven Pages with Attribute Assistant, managing floor plan-based datasets is a breeze. Reports can be created from the information that is stored in ArcGIS. ArcGIS provides an easy-to-access overview of all capital projects with the ability to open up the CAD files associated with each project. 4 Esri News for Facilities Winter 2012/2013 The Best of Both Worlds: CAD and GIS at the University of Washington continued from cover
- 5. continued on page 6 Cornerstone Shelli Stockton Global Facilities Industry Manager, Esri Collaboration, Not Competition More and more, I see organizations designing workflows that utilize technologies that best fit their business functions. And with the interoperability functionality we find with software systems, there is no need to choose between technologies—you can use the best one for the job. For facilities managers, CAD or building information modeling (BIM) may be the technology of choice. This is great news for GIS users, because CAD and BIM are great data sources. Using a technology like ArcGIS for AutoCAD ensures that CAD operators can stay in the environments they were trained for and understand while creating data that can be used for more advanced operations and analysis of the buildings that are in their care. Adding GIS to your existing building operations and mainte- nance functions provides technology that allows you to introduce geographic information—something that’s not present in either CAD or BIM. Adding GIS to workflows ensures that real-world co- ordinates are used for better organization and analysis of building data during the longest and most expensive phase of the building life cycle—the maintenance and operations phase. Using location data, managers can better coordinate many func- tions for more cost-effective planning of workers and funds. Jobs such as ensuring that all work orders in the same vicinity are han- dled by one worker make so much sense but can be complex tasks if the information is not maintained in a system that has access to all the data and understands where in the building that information is located. Creating emergency routes or analyzing lighted areas or perme- able areas around buildings are other examples of tasks easily achieved with GIS thanks to intelligent, location-aware data. The great user stories showcased in this issue of Esri News for Facilities exemplify how embracing GIS and introducing it into the facilities workflow has brought the best of all worlds to these lead- ing organizations. And to help you get started, a tutorial is included describing how to get your data from your CAD program into GIS. You can always check out more great tips from Esri staff and users at the online ArcGIS Resources site at resources.arcgis.com. I hope you had an opportunity to hear your colleagues talk about their successes at the Esri Federal GIS Conference held on February 25–27, 2013, in Washington, D.C. There you were able to see firsthand how geospatial technology can help you accomplish your mission and make 2013 the best year possible. If you weren’t able to join us, you can still view presentations and papers at esri.com/fedcon. So . . . GIS or CAD? Is it too much to ask for both? By creating a fully automated process for integrating CAD floor plans with GIS, UW has been able to realize the best of both worlds. Depending on the situation, the appropriate format is selected, but the data is exactly the same in both platforms. With the core infrastructure now in place, UW is exploring many avenues for making floor plan-based systems more efficient and even looking at processes that were never cost-effective to do before. Some of these include interior building navigation, interior utilities management, asset management linked to computerized maintenance management systems (CMMS), and emergency evacuation mapping, and there are many more. For more information contact Aaron Cheuvront, building GIS/CAD application manager, UW Capital Projects Office— Information Systems at 206-616-4489 or aaronch@u.washington.edu. Georeferencing campus data means that GIS analysis can be used to provide more efficient planning around the large facility. Campus routing is available inside and outside buildings. ArcGIS for AutoCAD allows CAD operators to work within the environment they are familiar with. Cover Story 5Winter 2012/2013 esri.com/fm
- 6. Integrating GIS into Your Facilities Workflow Introduction to GIS-Facility Integration Concepts By John Przybyla, PE, GISP, Woolpert GIS-centric vs. GIS-Linked Integration There are two basic approaches to integrating GIS and these other information systems—the GIS-centric approach and the more common GIS-linked approach. These approaches differ in fundamental ways, and each provides advantages and disadvantages over the other. As an organization considers what it wants from GIS integration, it should first address this issue. GIS-centric Integration GIS-centric integration is one in which the GIS is the core database that stores informa- tion about the facilities, spaces, equipment, and other physical assets. This means that the other applications don’t store this data natively inside their own data structures but rather reach into the GIS for this information. The huge advantage of this approach is that the data exists in only one location, and there is no overhead associated with synchronizing multiple infrastructure databases. The disadvantage of the GIS-centric ap- proach is that it requires such tight integration with GIS that the transactional application (CMMS, IWMS, etc.) must be written to be specifically integrated with Esri’s GIS prod- ucts (generally to a specific version). Most vendors of these products are reluctant to tie themselves that tightly with a specific GIS product line. The real power of GIS can best be real- ized when it is connected to another information system to become a visuali- zation and analysis tool. GIS can expose data in new ways, perform analyses that provide new understanding, and turn large amounts of impenetrable tabular data into information-packed spatial images. Transactional systems such as CAFM, IWMS, ERP, work manage- ment (or CMMS), and enterprise asset management solutions (EAMS) perform essential functions for organizations that manage facilities. However, they generally lack the visual and analytical power that is inherent in GIS technol- ogy. Integration provides the means to unleash that power. Integration of GIS and facilities-related information systems is similar to inte- gration with other information systems. Integration of any two information systems requires both the basic ability of the two information systems to connect to and be given access to each other’s data and use of common IDs to provide a means for information in one system to be matched to the appropriate informa- tion in the other system. However, some vendors have made the decision that the benefits outweigh the draw- backs and have developed their products to be fully Esri GIS-centric. Some of the leading GIS-centric software vendors have banded together to form the National Association of GIS-Centric Systems (NAGCS); see www.NAGCS.org. NAGCS certifies software and applica- tions that meet the following GIS-centric performance-based criteria: •• A standard Esri GIS geodatabase as the feature database (including for storing feature attributes) •• Nonredundant feature data storage (no reliance on views, data mapping, database triggers, or “transparent” links) •• A fully user-definable feature data model (customizable without vendor support) •• A nonproprietary feature data model format (such as for data names, fields, tables, relationships, and other data design elements) •• Product interoperability (providing maximum compatibility with any other GIS-centric application, including concurrent use of the feature database) •• Inherent feature data coordinate location and connectivity (inherent in the feature or asset data model, enabling full utilization of such spatial analysis capabilities as linear referencing and events) •• Feature data creation and maintenance using Esri’s ArcGIS software. NAGCS’s main goals are to provide enter- prise GIS solutions that promote interoper- ability, open standards, and shared-database approaches among GIS-centric software. As a result, NAGCS software provides both a high level of GIS integration and interoperability between applications. However, there are only a limited number of vendors of facilities-related transactional products that are GIS-centric. So, for many users, GIS-linked choices must be considered. 6 Esri News for Facilities Winter 2012/2013
- 7. GIS-Linked Integration In a scenario where facilities management software is not GIS-centric, it must be linked to the GIS via the use of common key IDs. This is because each area, piece of equip- ment, or asset is represented separately in the computerized maintenance management system (CMMS)/CAFM application database and in the GIS database. The linking IDs could be user-based, or computer generated and invisible to the user, but in either case, they must be kept synchronized. This can be a huge challenge as items are added, moved, and decommissioned over time, because edits must be made in both systems at ap- proximately the same time for the systems to remain in sync. This approach, known as GIS-linked inte- gration, is actually much more popular than GIS-centric integration: •• It allows the CMMS/CAFM/etc. system to be implemented even if no GIS exists. •• It gives the CMMS/CAFM/etc. software vendor more control over the data model and other integrations (energy monitoring, ERP, etc.). The GIS-linked approach results in significant operational challenges in keeping the two space/equipment/asset databases synchronized. Typically, these systems require the development of tools to autopopulate one system from the other, check that records exist in both systems, and discover items that exist as orphans in one or the other. However, these tools are only as valuable as the effort taken to develop the proper workflows and use them operationally on a continuous basis. Since maintenance of these two datasets often falls to differing staffs within an organi- zation, this problem can often be very difficult to overcome and, in many organizations, is the biggest single stumbling block to successful integration of GIS and facilities management software. Integration Use Cases for CMMS/EAMS There are multiple opportunities to enhance the functionality of CMMS/EAMS applications with GIS. These opportunities generally fall into two major categories—using GIS to deter- mine where work will be performed and using GIS to manage the work and report results. Using GIS to Determine Where Work Will Be Performed GIS can provide a significant operational ad- vantage to the process of determining where work will be performed. There is a series of use cases that incorporate typical map-based tools that operate from within the CMMS/ EAM application and add the following GIS capabilities: Selecting Physical Assets for Work There are many ways in which GIS can be used to select the assets where work will be performed. GIS can perform spatial searches that can locate features by address, street intersection, coordinates, and so on. GIS can also locate features via tabular and/or spatial attributes, such as locating all manholes within a floodplain. With the capability of modern geometric networks, GIS can even be used to perform trace-based selections, such as locating all the features that are upstream or downstream of a specific point. GIS features and objects can be used together to perform an asset search, such as selecting all the motors (objects) within a specific pump station (feature). The power and flexibility of the underlying geodatabase design will define the degree to which these selections can be performed. Creating Service Requests, Work Orders, or Inspections Once one or more assets are selected, the next step is to indicate the work to be performed. In a nonintegrated CMMS, often the work is determined first, then the location or asset is defined. With GIS integration, this workflow is often reversed, with the initial step Data Modeling When implementing an Esri GIS, developing a data model that accurately and completely abstracts the real-world elements into GIS features is of critical importance. Fortunately, through the efforts of Esri staff and a large user community, a baseline data model for facilities has been developed and is available on the Esri website. The Buildings and Interior Space Data Model (BISDM), which is available at ifmacommunity.org, provides a very good starting point for modeling buildings, floors, spaces, equipment, and other elements within GIS in such a way that it supports integration with GIS and facilities management systems. Like other Esri data models, BISDM is not intended to be a finished product that will support the needs of all users; rather, it is a well-conceived template that can be a start- ing point for refinement based on the specific needs of any organization. The BISDM model supports the use of GIS features to represent items that would typically be shown as separate point, line, or polygon features and the use of GIS objects to support items that would typically not be shown as graphic figures but would be at- tached through a tabular key to a feature. This allows modeling of facilities to any level of detail depending on the needs and data that might be available. For instance, in modeling a heating, ventilation, and air-conditioning (HVAC) system, an air handling unit could be modeled in the GIS as a feature, and the as- sociated equipment that must be maintained (blowers, dampers, filters, etc.) could be mod- eled as objects and attached to the feature via a relationship. In addition to integration with facilities management systems, BISDM is also de- signed to support integration with other infor- mation systems. It was specifically designed to be extended to allow importation of data at varying levels of detail from BIM. continued on page 8 7Winter 2012/2013 esri.com/fm Partner Spotlight
- 8. being the selection of one or more assets, then determination of the work. This method allows for precise matching of the kinds of work that are appropriate for the type of asset with minimal effort on the part of the user. Another powerful feature of GIS integra- tion is the ability to select multiple features from the map to perform a single activity (e.g., inspect all the street signs in a given neighborhood) or to select multiple features and autocreate individual activities for each (e.g., perform a pressure test of each fire hydrant within a district and report the results individually). Using GIS to Manage the Work GIS is a powerful tool to manage CMMS activities. It can be used to perform a myriad of both spatial and tabular reporting, such as “show the locations of all the open work orders in my sector,” or “show all the surface restoration work orders and color-code them by age.” If the GIS is integrated with an intelligent vehicle reporting (IVR) system, both the location of the work and the organiza- tion’s vehicles can be shown on a map in real time. And of course, the GIS can be used as a query tool to select the appropriate data for generating tabular reports. With a sophisticated integration of GIS, CMMS, and customer information systems (CIS), even more sophisticated GIS queries can be developed, such as “show the valves that will have to be closed to isolate this main break and generate a report of all the custom- ers that will be impacted.” These advanced queries fully leverage both the analytical and integration power of GIS technology. Integration Use Cases for CAFM or IWMS When integrating a CAFM or IWMS with GIS, additional use cases apply. These might include those discussed below. Linking to Tenant/Leasing Databases CAFM/IWMS systems generally manage information regarding tenants and leases in a series of transactional tables. In some cases, the CAFM system includes CAD-based spatial representation of spaces, color coded by tenant or another indicator. However, this data is typically presented in a highly con- strained view, consisting of only one level of one building, with typically only one thematic overlay at a time. By linking the full power of GIS to this data, much more power and flex- ibility can be exposed, including the ability to display multiple floors in 3D GIS, see multiple buildings within their context, and display multiple thematic layers simultaneously in a sophisticated fashion. Space/Move Management Tools The real power of GIS comes to the fore with the development of tools to assist in space management and move management. The potential use cases for such tools include queries that work across space and time, such as, “show all the leasable spaces of more than 500 square feet that will be available within the next year that are within 200 feet of a Starbucks,” or “show where there will be contiguous free space of at least 2,000 square feet that will be available from June 1 to September 30 for temporary relocation.” More sophisticated applications can be developed that use algorithms to develop optimized space allocations based on adja- cency and efficiency benefits. Other specific examples can be developed based on the needs of a specific organization. Wayfinding and Routing Other GIS capabilities that support facility management are those related to wayfinding and routing of pedestrians. The potential use cases include simple routing between two points, advanced routing based on handicaps (ADA-compliant routes, routes optimized for the blind), security planning, evacuation rout- ing, and emergency planning. Integrating GIS into Your Facilities Workflow continued from page 7 Integration Use Cases for ERP and Asset Management There is an additional set of use cases that apply to the integration of GIS with enterprise resource planning (ERP) and asset manage- ment systems. These include the following: Integrating GIS with Facility Condition Assessment Data Facility condition assessments are often performed to document deficiencies in existing facilities and equipment and develop estimates of effort needed to remedy the deficiencies. Data from these efforts, if captured in a way that can be linked to spatial features, can then be displayed within GIS and analyzed spatially. Using GIS to Develop Asset Life Cycle and Repair/Replacement Costs The combination of spatial and tabular GIS data (age, condition, environmental setting, etc.) can be used as the foundation for the development of tools to predict asset life cycle, probability of failure, and consequence of failure, leading to the calculation of risks associated with each feature. This informa- tion can then be used, along with projected costing information, to develop predictions of long-term operational costs and ultimately to facilitate capital improvement planning. 8 Esri News for Facilities Winter 2012/2013
- 9. Discover, Organize, and Share When critical, time-sensitive decisions need to be made regarding the status of facility assets, you don’t want to get stuck trying to find the right map or application. The ArcGIS for Facilities portal can be used over the public Internet or on premises to discover, organize, share, and utilize facility mapping resources specific to a particular facility’s life cycle activity. You can easily discover helpful geospatial data resources, build and share intelligent maps, and collaborate in public and private groups. Mapping and Analyzing Your Portfolio Have you ever considered that where your building assets are located may affect their performance? Proximity of assets to location-based variables, such as physical geography, geology, climate, transit networks, and amenities, can impact portfolio performance. ArcGIS for Facilities provides an atlas of freely available map templates designed to improve portfolio performance problem solving and decision support. These map templates are supported by a foundational real property portfolio data model. This allows the end user to easily set up, filter, and map meaningful portfolio attributes. The map templates also provide access to a variety of basemaps, preconfigured symbols for assets at a variety of scales, and helpful pop-up windows that help reveal asset performance patterns and trends. Campus and Building Performance Mapping ArcGIS for Facilities provides freely available campus and building map and application templates as well as supportive data models and work- flows. These resources are designed to help facility and building manage- ment professionals quickly and easily implement a foundation level of facility mapping capabilities. Map and application templates are provided for desktop, web, cloud, and mobile computing environments. ArcGIS for Facilities resources are available in nine different modules. Current modules supported include Portfolio Management, Planning and Site Selection, Space and Move Management, Safety and Security, and Energy and Sustainability. Future modules to be supported include Emergency Management, Operations and Maintenance, Environmental Compliance, and Work Order Management. In addition to resources found in each module, Esri also provides a core set of facility map and application tem- plates at the ArcGIS for Facilities group at ArcGIS.com. These intelligent mapping resources are designed to help improve operational awareness and decision support, reduce the time and cost required to solve prob- lems, and minimize unnecessary and sometimes harmful risks. Maintain Facilities and Grounds Data The Campus Editing template consists of a preconfigured ArcMap editing map, additional editing tools, and a set of editing workflows for managing building, interior space, and related exterior campus data. It is an editor that can be used by mapping technicians in a college or university, private corporation, or public works agency to streamline the collection, maintenance, and use of asset information. This template includes the following: •• A multiscale ArcMap document designed for editing •• An Editing toolbar add-in to your ArcGIS for Desktop Advanced or ArcGIS for Desktop Standard installation •• The local government geodatabase with sample data from the Esri Redlands campus The Campus Editing map can be used to capture interior and/or exterior assets on a university or business campus. It can also be used by government agencies to capture these same assets in a downtown area or on a government complex or military base. These interior and exterior assets are the foundation for a variety of desktop, mobile, and web mapping applications deployed to support facilities management, education, public works, planning, and military business needs. This editing map supports two data management workflows, which can be optimized to support the format of your facilities source data and used to create and/or import interior and exterior features. For example, there are workflows that help you do the following: •• Add exterior facilities and assets on your campus using high-resolution imagery as a guide •• Add buildings, floors, and interior spaces using a georeferenced scan of a building floor plan as a guide Additional detail on each of these workflows can be found in the Campus Editing Workflow Tutorial provided in the Documentation folder. The Campus Editing template also includes an add-in called the Attribute Assistant. The add-in is an editor extension that uses a series of predefined methods to automatically populate attributes when you update and/or add new campus interior or exterior features to the geodatabase. For example, one method will automatically populate the name of a building’s FacilitySite ID by intersecting the Facility Site polygon feature it resides within. Other methods will help maintain the integrity of your campus data by populating the last editor and last update date on each feature. Visit ArcGIS for Facilities at resources. arcgis.com/en/communities/facilities. ArcGIS for Facilities Portal This demo from Esri business partner R&K Solutions shows how ArcGIS can assist campus managers with facilities budget and forecasting. 9Winter 2012/2013 esri.com/fm Solution
- 10. Listen to New Podcasts Visit esri.com/podcasts to hear the latest Speaker and Instructional Series podcasts. Here’s a glimpse of what you’ll find: Speaker Series NASA Langley Uses GIS for Facilities Management Brad Ball, GIS team leader at NASA Langley Research Center, discusses the use of GIS for managing facilities at NASA Langley. Become a Fan Join thousands of others from around the world in an online community on Facebook and Twitter. Check out these Facebook pages: •• Official Esri UC •• Official Esri Developer Summit •• GIS Day Follow Esri and participate in conversations on Twitter with these hashtags: #Esri, #EsriUC, #EsriMobile, and #ArcGIS. •• Follow Esri News for Facilities editor Karen Richardson: @mudmo Esri Video Tune in to the latest videos by visiting video.esri.tv. Find Resources Visit resources.arcgis.com to find the information you need including help documentation, tutorials, videos, ArcGIS templates, models, and scripts. Attend a Free Online Training Seminar Live training seminars bring the GIS instruction you need to your desktop. Technical experts lead these hour-long sessions, which are streamed live. Should you miss the interactive presentation, you can access the recording online. Visit training.esri.com for more information. Esri Online The Esri Federal GIS Conference in Washington, D.C. was held February 25–27, 2013 and included presentations and papers and the latest news on technological advancements in GIS. For three days, govern- ment workers were able to learn, network, and take part in unmatched opportunities. More than 100 conference sessions, including technical sessions led by experts and user sessions focused on case studies and best practices and FederalDevGo sessions just for developers were held. New ArcGIS for National Government sessions showcasing Esri’s comprehensive government solutions and Federal GIS Solutions EXPO, featuring products and services from more than 70 government solu- tions providers, were available for attendees to discover. Sessions and user presentations focused specifically on facility management in the federal space. Technical workshops focused on portfolio management and planning, operations management, and safety and security. Attendees learned how federal agencies are implementing new technologies to better track and assess their real property in an effort to reduce costs, increase resource productivity, and more effectively balance their portfolios. GIS is helping agencies improve these processes with innovative QA/QC of data, problem solving and decision support capabilities. Workshops highlighted Esri solutions for real property management including ArcGIS for Facilities resources, as well as Community Analyst, which helps agencies with site selection and resource planning through analysis of geodemographic data at user defined geographies. Several workflows that users can adopt were highlighted that address whole- agency, as well as facility-specific, portfolio assessments. Workflows including planning and impact studies for objectives such as effectively locating new telework centers and community impacts of disposing of underutilized, excess property were discussed. Analysis, mapping, and reporting of key real property metric and performance indicators, as well as the underlying real property data models were covered. User papers and technical presentations are online and can be viewed at esri.com/fedcon. Washington, D.C. was the venue for the latest in Government GIS 10 Esri News for Facilities Winter 2012/2013
- 11. For engineers and planners who use AutoCAD to construct and maintain drawings of infrastructure and utilities, Esri’s latest release of ArcGIS for AutoCAD simplifies the communication of information between the CAD and GIS platforms. ArcGIS for AutoCAD is a free plug-in that allows users to access, create, edit, and share GIS data inside AutoCAD. Through ArcGIS for AutoCAD, GIS and CAD users can share information throughout an organization without costly add-on software, conversion, or complex workflows. Most notably, ArcGIS for AutoCAD users with read/write access to ArcGIS for Server feature services can now edit geodatabases through AutoCAD. ArcGIS for AutoCAD is the interface between ArcGIS and AutoCAD. Through this interface, AutoCAD users can access all the data content, sharing, and data management options available in ArcGIS. AutoCAD files created with ArcGIS for AutoCAD include the GIS data stored completely within them and are directly usable as ArcGIS datasets. The advantages of using this free plug-in are numerous: workflows are faster, duplicate efforts are eliminated, and staff throughout the ArcGIS for AutoCAD: Maximize CAD and GIS across the Enterprise Free, New Version Available enterprise become more empowered in their daily work with this added access. ArcGIS for AutoCAD users can do the following: •• Edit ArcGIS geodatabases through a feature service •• Add Esri map and imagery services, such as from ArcGIS Online •• Add maps from enterprise or cloud servers •• Navigate within drawings by using a street address •• Create ArcGIS feature classes in AutoCAD •• Extract GIS data from feature services Also, AutoCAD 2010/2011/2012 (32 bit and 64 bit) systems are supported. To learn more about ArcGIS for AutoCAD and download it free, visit esri.com/autocadapp. Use ArcGIS for AutoCAD to access a geolocation service and locate place-names in your drawing. 11Winter 2012/2013 esri.com/fm Software
- 12. Presorted Standard US Postage Paid Esri 380 New York Street Redlands, California 92373-8100 usa 30-day free trial: esri.com/agol Creating your own map from maps published by other users is just one of many ways to take advantage of the rich collection of data and resources ArcGIS SM Online makes available to you. Welcome to the new frontier in geographic information systems. ArcGIS Online Copyright © 2012 Esri. All rights reserved. 30-day free trial: esri.com/agol Creating your own map from maps published by other users is just one of many ways to take advantage of the rich collection of data and resources ArcGIS SM Online makes available to you. Welcome to the new frontier in geographic information systems. ArcGIS Online Maps made better. (Some assembly required.) Copyright © 2012 Esri. All rights reserved. 133568 QUAD9.3M3/13tk