Esri News for Electric & Gas Winter 2012/2013 issue
•
1 gefällt mir•637 views

Esri News for the Electric and Gas Utilities Winter 2012/2013 issue

Empfohlen
Weitere ähnliche Inhalte
Was ist angesagt?
Was ist angesagt? (20)
Ähnlich wie Esri News for Electric & Gas Winter 2012/2013 issue
Ähnlich wie Esri News for Electric & Gas Winter 2012/2013 issue (20)
Mehr von Esri
Mehr von Esri (20)
Kürzlich hochgeladen
Kürzlich hochgeladen (20)
Esri News for Electric & Gas Winter 2012/2013 issue
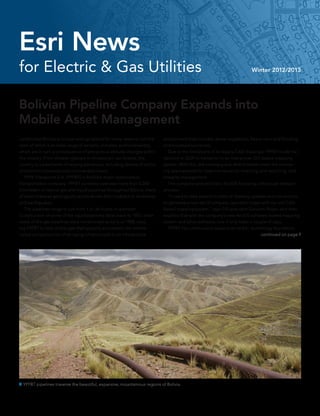
- 1. for Electric & Gas Utilities Winter 2012/2013 Esri News Bolivian Pipeline Company Expands into Mobile Asset Management Landlocked Bolivia is unique among nations for many reasons, not the least of which is its wide range of terrains, climates, and biodiversity, which are in turn a consequence of precipitous altitude changes within the country. From Andean glaciers to Amazonian rain forests, the country is a patchwork of varying elevations, including dozens of active and extinct volcanoes and innumerable rivers. YPFB Transporte S.A. (YPFBT) is Bolivia’s major hydrocarbon transportation company. YPFBT currently operates more than 6,200 kilometers of natural gas and liquid pipelines throughout Bolivia, many of which traverse geologically active terrain that’s subject to landslides and earthquakes. The pipelines range in size from 4 to 36 inches in diameter. Construction of some of the liquid pipelines dates back to 1955, while some of the gas pipelines were constructed as early as 1968, caus- ing YPFBT to face challenges that typically accompany the mainte- nance and protection of an aging infrastructure in an inhospitable YPFBT pipelines traverse the beautiful, expansive, mountainous regions of Bolivia. environment that includes dense vegetation, heavy rains and flooding, and mountainous terrain. Due to the limitations of its legacy CAD drawings, YPFBT made the decision in 2009 to transition to an interactive, GIS-based mapping system. With this, the company was able to better meet the increas- ing requirements for data maintenance, mapping and reporting, and integrity management. The company selected Esri’s ArcGIS following a thorough research process. “It used to take several months of drawing updates and corrections to generate a new set of company operation maps with our old CAD- based mapping system,” says GIS specialist Giovanni Rojas, who then explains that with the company’s new ArcGIS software-based mapping system and other software, now it only takes a couple of days. YPFBT has continued to expand on its Esri technology foundation. continued on page 9
- 2. Winter 2012/2013 Esri News for Electric & Gas Utilities is a publication of the Electric & Gas Group of Esri. To contact the Esri Desktop Order Center, call 1-800-447-9778 within the United States or 909-793-2853, ext. 1-1235, outside the United States. Visit the Esri website at esri.com. View Esri News for Electric & Gas Utilities at esri.com/electricgas or scan the code below with your smartphone. Advertise with Us E-mail ads@esri.com. Submit Content To submit articles for publication in Esri News for Electric & Gas Utilities, contact Jessica Wyland at jwyland@esri.com. Manage Your Subscription To update your mailing address or subscribe or unsubscribe to Esri publications, visit esri.com/publications. International customers should contact an Esri distributor to manage their subscriptions. For a directory of distributors, visit esri.com/distributors. Circulation Services For back issues, missed issues, and other circulation services, e-mail requests@esri.com; call 909-793-2853, extension 2778; or fax 909-798-0560. 2 Esri News for Electric & Gas Utilities Winter 2012/2013 Contents Cover 1 Bolivian Pipeline Company Expands into Mobile Asset Management Esri News 3 The Deadly Backlog—A Hole in the Safety Net 4 Changing the Discussion: The 2012 Esri Electric and Gas GIS Conference 5 Thank You, EGUG Sponsors 6 Esri Study: Geospatial Investments Help Utilities Boost Productivity, Reduce Costs 6 Esri Announces New Pipeline and Gas Utility Industry Manager 7 Podcast: GIS for Asset Management and Beyond 8 What’s Going On with GITA? Case Study 10 ArcGIS Online at 10.1 and Why You Should Care 12 Feedback Strengthens GIS Data Quality The information contained in this work is the exclusive property of Esri or its licensors. This work is protected under United States copyright law and other international copyright treaties and conventions. No part of this work may be reproduced or transmitted in any form or by any means, electronic or mechanical, including photocopying and recording, or by any information storage or retrieval system, except as expressly permitted in writing by Esri. All requests should be sent to Attention: Contracts and Legal Services Manager, Esri, 380 New York Street, Redlands, CA 92373-8100 USA. The information contained in this work is subject to change without notice. The Geographic Advantage, Esri, the Esri globe logo, 3D Analyst, ArcAtlas, ArcCatalog, ArcData, ArcDoc, ArcEditor, ArcExplorer, ArcGIS, the ArcGIS logo, ArcGlobe, ArcIMS, ARC/INFO, ArcInfo, ArcLogistics, ArcMap, ArcNetwork, ArcNews, ArcObjects, ArcPad, ArcPress, ArcReader, ArcSDE, ArcSurvey, ArcToolbox, ArcTools, ArcUser, ArcView, ArcVoyager, ArcWatch, ArcWeb, ArcWorld, ArcXML, Business Analyst Online, BusinessMAP, CommunityInfo, EDN, Geography Network, GIS Day, MapData, MapObjects, Maplex, MapStudio, ModelBuild- er, MOLE, NetEngine, RouteMAP, SDE, Sourcebook•America, StreetMap, Tapestry, @esri.com, esri.com, arcgis. com, geographynetwork.com, gis.com, and gisday.com are trademarks, service marks, or registered marks of Esri in the United States, the European Community, or certain other jurisdictions. Other companies and products or services mentioned herein may be trademarks, service marks, or registered marks of their respective mark owners. Copyright © 2013 Esri. All rights reserved. Printed in the United States of America.
- 3. The Deadly Backlog—A Hole in the Safety Net Bill Meehan, Esri Director of Utility Solutions We have all heard the term safety net. It’s a system, policy, program, or device used to offer protection to its owners just in case something bad happens. For example, people often refer to social security as a safety net for older people who don’t have a pension. The term comes from the circus, where large roped nets are set up below trapeze artists. Should a trapeze artist make a mistake, he or she would fall harmlessly into the net. Without the net, sweaty palms or small distractions could mean instant death. However, most trapeze artists never wanted to fall into the net. First of all, falling is a sign of failure of their craft. Second, they didn’t trust the integrity of the net, as circuses had notoriously bad maintenance. The trapeze artist knew that most safety nets have flaws. Some even have holes. When I worked for a power company, one seasoned manager of the nuclear plant told me that every safety net has a hole. The nuclear power industry has procedures, training programs, meticulous docu- mentation, and practices to avoid mistakes at all costs. Yet every single program or system could fail. It was the manager’s job to recognize where the holes were located and do what could be done to plug them. Failing that, the manager must add another safety net. Of course, no matter how many safety nets are put in place, they all have holes. Bad things happen when all the holes in all the safety nets line up perfectly. The trick of risk mitigation is to understand each of the holes in each of the safety nets. Although it is probably not possible to entirely eliminate accidents, the more safety nets a utility puts in place and the smaller the holes, the lower the probability that the holes will all line up. The recent accident at the Fukushima Nuclear Power Plant in Japan is an example of how the holes in each of the safety nets lined up perfectly. We call this alignment of holes in all the safety nets the perfect storm. I believe that one of the benefits of a utility GIS is the improvement in safety for employees and customers. Not many people agree. My argument is that if workers are unsure of where something is located, they might mistake one device for another and perhaps get hurt. Those who disagree with me say that utility workers would never work on a power line or gas main without first testing it, dead or empty, and get- ting clearance from the dispatchers. Many argue that having good data is fine for other reasons, but it doesn’t improve safety. My detractors are certainly right to a point. No one would be crazy enough to rely solely on outdated or sketchy records in the face of life-threatening decisions, right? No. But good, up-to-date data—and, specifically, a good GIS—is one of the safety nets. I’ll give you an example. Several years ago, a line worker had to discon- nect a faulted cable from a switch cabinet near the intersection of two busy streets. A printout of the GIS map clearly showed the location and identification number of the switch cabinet. The dispatcher had informed the worker that the cable in question had been deenergized. The worker found the switch, opened the cabinet door, and cut into the cable. The flash knocked the worker several feet and burned his face and hands. The cable faulted, causing a substantial outage. Luckily, the worker survived. The company recorded a lost-time injury. The Occupational Safety and Health Administration (OSHA) told the company to explain why this ac- cident happened. An expensive and time-consuming audit followed. The worker was out of work for many days. What really happened? First, the map was not exactly wrong. It was simply out-of-date. Months ago, someone in engineering issued a work order to move the switch to a different location. The worker was at the wrong switch. The as-built construction records ended up in a pile of completed work orders just waiting for someone to update the GIS. Do we blame the GIS for the accident? Do we blame the worker or the dispatcher? Do we blame the worker’s supervisor for not having a fully trained staff? Who or what is to blame? The first safety net in this example is the rule that says no one is allowed to work on a cable, dead or alive, without testing. The worker ignored the rule—the first hole in the safety net. Maybe the worker was out sick the day of the safety training class. He fell through the first hole. Every worker is supposed to wear protective gear. This rule is an- other safety net. But why put on hot and uncomfortable gear when he knew the cable was dead? The worker failed to put on his safety gear— the second hole in the safety net. These two holes lined up. The third rule says no work is to be done unless the dispatcher gives the order and declares the cable deenergized. This additional hole in the safety net was caused by an incorrect record of the location of the switch. If the GIS was right and everything else was wrong, nothing bad would have happened, even though the worker violated two safety rules. Of course, this careless worker was an accident waiting to happen. GIS alone doesn’t improve safety, but it is an essential safety net. Incorrect or inconsistent information causes confusion and uncertainty. Using GIS, there are several safety nets utilities can put in place to protect workers. First, they can invest in the reduction of the deadly backlog of unposted transactions and corrections to core data. Next, they can implement systems that shorten the time span between when a change in the system occurs and when the GIS gets updated. Mobile GIS can help here. Utilities can use mobile technology to implement systems that facilitate sharing and collaboration of data. In my exam- ple, even if the utility had corrected its GIS data, there is no guarantee that the dispatcher would have had access to the current data. Even today, many dispatchers operate from paper maps or printouts of GIS maps. Utilities can upgrade systems to ensure that all parties operate from the same information base—whether on a GIS desktop, the web, or a mobile device such as a phone or tablet computer. GIS in the cloud, distributed to all parties, can help here. Every safety net has a hole. We can’t completely eliminate these holes. But like the trapeze artist, we understand that holes do exist, and we must be ever diligent. The larger the stack of unposted data, the larger the hole in the company’s safety program—the safety net. Get rid of the deadly backlog. Use executive dashboards, GIS func- tionality, and up-to-date data to protect workers, knowing that with all the procedures and programs in place, people will still do unpredict- able things. Put processes and technology in place to ensure that the hole in the safety net is as small as possible. 3Winter 2012/2013 esri.com/electricgas Esri News
- 4. Changing the Discussion: The 2012 Esri Electric and Gas GIS Conference Nearly 500 utility professionals from 12 countries gathered October 7–10, 2012, in Salt Lake City, Utah, for the Esri Electric and Gas GIS Conference. This year’s emphasis was Changing the Discussion. Attendees focused on issues such as analytics, data quality, and collaboration. “The Plenary Session challenged the audi- ence to take their thinking to the next level and change the current discussion about the role of GIS within the enterprise,” said Wayne Meyer, president of the Esri Electric and Gas User Group (EGUG). Highlights of the 2012 Esri Electric and Gas GIS Conference included technical work- shops on lidar and ArcGIS Online, free data health checks to assess the accuracy and quality of a specific dataset, and a Hands-on Learning Lab offering a variety of free training courses. Nearly 40 paper sessions were presented by utility professionals and Esri partners, cover- ing topics such as weather events, smart grid, distribution integrity management programs (DIMP), data management, outage management, budget constraints, aging infrastructure, and new technology. Those in attendance also enjoyed the Birds of a Feather networking meetings designed for electric transmission, gas utilities, electric distribution, and small utilities. A GIS Solutions EXPO featured Esri partner solutions. Guests also had a chance to be part of the site visit to the Questar Gas Emergency Response Training Facility. Introducing the 2013 EGUG Officers The Electric and Gas User Group (EGUG) is an active community of people dedicated to sharing information, ideas, and experiences about Esri technology in the electric and gas industry. By joining EGUG, you benefit from intellectual collaboration with and personal inspiration of your peers. Discuss challenges Save the Date 2013 Esri Electric and Gas GIS Conference October 20–23 San Antonio, Texas about GIS in the electric and gas industry with users from around the world, as well as Esri staff. Not an EGUG member? Membership is freely open to all Esri users, user organizations and Esri partners. Join the EGUG at esri.com/egug President Wayne Meyer SCANA Vice President William Wickersheim Burbank Water and Power Conference Chair James Trevino CPS Energy 4 Esri News for Electric & Gas Utilities Winter 2012/2013
- 5. Thank You, EGUG Sponsors Gold Sponsors EXPO Social Sponsors Welcome Social Sponsors Party Sponsor Listen to New Podcasts Visit esri.com/podcasts to see the latest Speaker and Instructional Series podcasts. Become a Fan Join thousands from around the world in an online community on Facebook, Twitter, and LinkedIn. Check out these Facebook pages: Esri, Esri UC, EnergyGIS. Follow Esri and participate in conversations on Twitter with these hashtags: #Esri and #ArcGIS. •• Follow Esri’s utility industry writer Jessica Wyland: @EnergyGIS •• Follow Esri’s director of utility solutions Bill Meehan: @bill_meehan •• Follow Esri’s Electric and Gas User Group (EGUG): @EsriEGUG Spring Lineup on Esri TV Tune in to the latest videos, such as those from Esri describing step-by-step instructions for using arcgis.com. Visit youtube.com/esritv. Attend a Free Online Training Seminar Live training seminars bring the GIS instruction you need to your desktop. Technical experts lead these hour-long sessions, which are streamed live. Should you miss the interactive presentation, you can access the recording online. Visit training.esri.com for more information. Electric and Gas Resource Center The Electric and Gas resource center is the place where you can find ArcGIS maps and applications that help you manage geographic information, visualize trends, and publish great web maps. Visit resources.arcgis.com and click the Electric and Gas link. Esri Online Esri News 5Winter 2012/2013 esri.com/electricgas
- 6. Esri Study: Geospatial Investments Help Utilities Boost Productivity, Reduce Costs In a recent Esri study of electric utility professionals, nearly half reported a more than 10 percent increase in productivity due to the use of GIS technology. The study was designed to assess electric utility geospatial technology in terms of return on investment. Results were analyzed and compiled into a benchmark report, The Business Benefits of GIS for Utilities, now available for download. “We really wanted to find out about the benefits utilities have experienced with GIS from customer care or supply chain or account- ing,” said Bill Meehan, Esri director of utility solutions. “GIS and IT professionals can access the report to communicate technology needs to management, assess their utility’s use of GIS, or identify areas for needed GIS expansion.” Additional major findings of The Business Benefits of GIS for Utilities include the following: •• Forty-one percent report savings of 7 percent or greater in plant accounting. •• Sixty-five percent report saving more than 6 percent in system and distribution planning. •• Twenty-five percent reduced System Average Interruption Duration Index (SAIDI) by 7 percent or more. View the webinar presentation of The Business Benefits of GIS for Utilities and read the report at esri.com/roisurvey. Esri Announces New Pipeline and Gas Utility Industry Manager Tom Coolidge, the recently appointed pipeline and gas utility industry manager for Esri, believes that now is a very exciting time to work with GIS. “GIS has advanced to a point where it is delivering on the long-held dream of all GIS could do to help pipelines and utilities be their best,” Coolidge said. The dream Coolidge speaks of centers on GIS as much more than mapping and imagery. It builds on the early movement, dating to the 1970s and 1980s, that uses a subset of GIS for automated mapping and facilities management (AM/FM). The dream is about applying GIS beyond AM/FM to all applications with a spatial dimension and in all functional areas. Today that dream is reality, according to Coolidge. “In ways only imagined not long ago, Esri core technology provides an ideal frame through which spatial data can be viewed, analyzed, and managed by users throughout a pipeline or gas utility, wherever they are located—in the office or in the field,” he said. Coolidge noted that utilities are now able to access authorita- tive data—information such as network assets and customers that is maintained by colleagues who are certain of its correctness and currency. Utilities can also access public data such as geographic features, weather, and emergency conditions. It is even possible for GIS to consume social media. In his new role at Esri, Coolidge will focus on helping pipeline and gas customers use what he sees as “the full power of GIS.” “Esri technology provides a corporate information repository so that anyone in the company can access up-to-date information whenever it is needed to perform job tasks or make decisions,” Coolidge said. “Geography is enabling new workflows and ways of working, making knowledge workers more productive regardless of whether they’re working individually or in teams.” Before assuming the industry manager position at Esri, Coolidge was a member of Esri’s electric and gas utilities account management team. Prior to joining Esri, he worked for 26 years in key leadership and management roles with Stoner Software, now an offering of GL Noble Denton. Coolidge helped the company evolve from a small entrepreneurship into a leading corporate provider of internationally acclaimed simulation and asset integrity software solutions for the natural gas, petroleum, electric, and water industries. Coolidge is a former president and longtime member of the Geospatial Information & Technology Association (GITA) and actively participates in various industry associations and groups. Contact Tom Coolidge at tcoolidge@esri.com. 6 Esri News for Electric & Gas Utilities Winter 2012/2013
- 7. Podcast: GIS for Asset Management and Beyond In a newly released Esri podcast, Kurt Towler, GIS coordinator for Sulphur Springs Valley Electric Cooperative in southeastern Arizona, shares insight about GIS for asset management, engineering calcula- tion, electric network analysis, and maintenance prioritization. Sulphur Springs Valley Electric Cooperative is a nonprofit, member- owned distribution cooperative providing electricity to more than 53,000 services over some 4,059 miles of energized line. Listen to the podcast at esri.com/towlerpodcast. American Petroleum Institute—2013 Pipeline Conference April 16–17, 2013 San Diego, CA, USA www.api.org International SAP Conference for Utilities April 17–19, 2013 Copenhagen, Denmark EEI Transmission, Distribution and Metering Conference April 28–May 3, 2013 Chicago, IL, USA www.eei.org WINDPOWER May 5–8, 2013 Chicago, IL, USA www.windpowerexpo.org UTC Expo May 15–17, 2013 Houston, TX, USA utctelecom2013.utc.org AGA Operations Conference & Biennial Exhibition May 21–24, 2013 Orlando, FL, USA www.aga.org Smart Electricity World Australasia June 25–26, 2013 Melbourne, Australia On the Road Esri News 7Winter 2012/2013 esri.com/electricgas Webinar: ArcGIS Online Best Practices for Utilities How are utility companies deploying ArcGIS Online? Esri experts, along with presenters from SCANA, We Energies, and National Grid made the business case for implementing ArcGIS Online and dis- cussed strategies for deployment in this recorded webinar. Look for it at esri.com/electric under the Webinars section.
- 8. Q: What kind of changes is GITA going through? A: The first thing we have to explain is that GITA had been invested very heavily in annual conference events, and those events had been successful for a long while. But, in doing those events in major cities and major venues, the commitments were three years out. Over the past three years, we experienced a precipitous decline in attendance. From the members we talked to, it was nothing to do with the conference itself; it was due to budgetary restrictions. Our staff has done a spectacular job on the events. However, the board members’ decision was that we can no longer hold these events. There is an exception, which is the oil and gas conference. Q: What are your thoughts about refocusing GITA? A: We know there are some things we are doing right and some things we need to address. In the doing-right category, we provide high-quality educational opportunities that can be used toward GISP [geographic information system professional] certification and to meet continuing education needs within various professions—we know we do a really good job with that. Traditionally, that education had been delivered through the conference, but now we are going to deliver the majority of it online. We have developed a thought leader symposium with quite a number of experts lined up from the infrastructure sector such as electric, gas, and water utilities. The experts will talk about the new issues such as data integration, systems integration, and security issues. We will talk about the future—what does that look like? On our website, we will take the conference format and host white papers and member testimonials. Q: What do you want GITA to do better? A: We want to better connect our members with organizational lead- ership and representation. While GITA is not a lobbying group, we do have a presence in many high-profile committees and groups. We are seeking to establish a forum where our members can have discussions and have their voices heard on important issues. We want to create two-way communication between our members and larger organizations or government organizations. We also want to better engage our vendors—to be more open to vendor involvement. We want to give them a chance to talk about their solutions. We realize that the growth of their business is important to the growth of the industry. To be clear, we are not going to be in advertisement. But we do want to provide solutions and approaches that can be discussed in a reasonable fashion. We want to connect vendors with users. We recognize the increase in specialization in the geospatial industry. Through that, there is a diversification of needs and solutions. So while initially you had to choose a GIS platform, now users have to wade through many solution providers before they can make a decision. Q: What is your message to members and potential members? A: We are back on track with infrastructure and utilities as our focus. This includes local and regional governments that often oversee or operate utilities. We need our members to be patient with us as we make the transition to an all-volunteer organization. The board members have taken on responsibilities for finance, IT, educa- tion, membership, research, media communications, and awards. We are now in the midst of the learning curve. We are asking our members and people in the larger community to be part of shap- ing GITA. They can contact me with their interests, and we will welcome them with open arms. Q: Has the mission of GITA changed? A: Our core mission is the same: to provide education to our constituents. The context has shifted. We also want to provide representation and direction. We want to provide educational content, based on demand. Q: What prompted you to get involved with GITA at this point, and at the presidential level? A: I work in academia. One of the things I realized long ago is that there is a fundamental disconnect between education and industry. As a geospatial professional, I participate in industry, and it has had tremendous benefits. Also, we have a highly motivated group at the board level. That camaraderie and commitment will ensure our future success. GITA is hungry. Visit www.gita.org. What’s Going On with GITA? A Conversation with GITA President-Elect Talbot Brooks At the 2012 Esri International User Conference, industry writer Jessica Wyland sat down for a question-and-answer session with Talbot Brooks, the president-elect of the Geospatial Information & Technology Association (GITA) and director of the Center for Interdisciplinary Geospatial Information Technologies at Delta State University in Mississippi. 8 Esri News for Electric & Gas Utilities Winter 2012/2013
- 9. The ArcGIS Pipeline Data Model geodatabase schema has also proved to be an enormous boost to YPFBT’s GIS capabilities, since it was designed specifically for storing information specific to gas and liquid pipeline systems. Before YPFBT moved to its new mapping system and the In-Line Inspection (ILI) tool, anomalies detected were located by a manual chaining method so the defects could be exposed and repaired. “Locating a defect this way was inaccurate, labor-intensive, and very expensive,” says Juan Hurtado, YPFBT’s ILI operations manager, “re- quiring pipeline maintenance crew members to chain the site and usu- ally several verification digs. Now, with GPS and linear referencing, we can accurately locate the underground pipeline features and defects. This means that when the ILI tool reports a defect, a crew member can easily navigate to the site and locate and mark the position for the excavation crew.” works performed by maintenance crews,” says Graciela Gutierrez, risk assessment operations manager. “This emphasized the need to add accurate field data collection to our GIS-based mapping system and risk assessment in order to ensure precision and reliability.” The detailed requirements list for the mobile solution was extensive and arrived at through a collaborative and iterative process between YPFBT office and field personnel. The solution had to support ArcGIS for Server. It would have to support relational databases using globally unique identifiers for primary and foreign keys, as well as support Oracle Spatial and SQL Server spatial databases. YPFBT also wanted the mobile solution to integrate directly with the ArcGIS Pipeline Data Model because it would enable the company to manage the pipeline data in standardized format. In the end, YPFBT chose CartoPac Mobile from Esri partner CartoPac International of Fort Collins, Colorado. The solution’s GPS-enabled data capture process was designed specifically to map, inventory, and manage field assets with very high accuracy. It allowed field teams to use intelligent, configurable workflow forms running on mobile devices to standardize the asset inventory efforts across all the field teams. YPFBT began implementation of its mobile solution with a pilot program focused on field data collection related to class location and high-consequence areas. Prior to initiating the 2011 pilot program, YPFBT personnel attended an in-depth training program on the solu- tion to build competence in building, modifying, and managing their own workflow solutions. The objective of the pilot program was to capture field asset data in two districts over the course of three months, evaluating the solu- tion for accuracy, ease of use, and reliability. The results of the pilot program were a success, and in early 2012, full implementation began. The scalable architecture will eventually support a growing number of mobile users from the Maintenance, Cathodic Protection, and Coating Departments. YPFBT’s expansion into mobile technology was methodical and precise. This extensive, inclusionary selection process resulted in an enterprise approach to defining YPFBT’s mobile asset management needs, extending and building on top of the company’s GIS system. For more information, contact Mario Haderspock España, senior pipeline integrity manager, maintenance management, YPFB Transporte S.A. (tel.: 591-3-356-6772, cell: 721-01587), or Jake Opdahl, Americas sales manager, CartoPac International, Inc. (e-mail: jake.opdahl@cartopac.com, tel.: 970-692-5181). YPFBT’s mobile devices exchange asset data with its GIS. Finding the right solution involved many entities within the organization. Enhancing Field Data Collection In 2011, YPFBT was looking for ways to build on the success it had achieved with ArcGIS. The company wanted to enhance the level of detail and integrity of its field asset data collection processes and was looking for a mobile solution that could support complex workflows through standardized forms. “While collecting burial data for the geohazard risk assessment pro- ject, we encountered many undocumented reroutes and emergency 9Winter 2012/2013 esri.com/electricgas Bolivian Pipeline Company Expands into Mobile Asset Management continued from cover Cover
- 10. ArcGIS Online at 10.1 and Why You Should Care By Skye Perry, Principal Consultant, SSP Innovations If you’ve attended any Esri conference, presentation, or strategic meeting in the last six months, you’ve undoubtedly heard about Esri’s new focus on ArcGIS Online accompanying the release of ArcGIS 10.1. The people at SSP Innovations have received the message from Esri account managers, marketing, and many consultants. SSP Innovations is a GIS and work management software company specializing in implementing solutions based on Esri and Schneider Electric technolo- gies for electric, gas, water, and fiber utilities. Although there were concerns among the SSP Innovations staff re- garding the viability and security of the new model, the ArcGIS Online message prevailed. Here’s why you should take a look at where ArcGIS Online might fit within your organization. technical expertise. And when we say geographic content, we aren’t just talking about feature classes, shapefiles, and map services. We are talking about spreadsheets, comma-separated value (CSV) files, and just about any other file format you might store your data in. ArcGIS Online allows you to add and publish this data within your account as a feature service. The feature service can be overlaid onto an existing Esri basemap to create an ArcGIS Online web map, which is the foundational element of the new ArcGIS Online service. At this point, you are starting to think this is sounding a bit technical. And didn’t we just state your users didn’t need any technical expertise? In its simplest form, you can create a new web map by clicking the New Map button, confirming or changing the default basemap, and drag- ging and dropping your CSV file onto the map. The service automati- cally detects the addressing fields and projects your data onto the map. And you can perform all this in your web browser. At its core, ArcGIS Online presents a fundamental shift in the way we consume and interact with our GIS data. In the past, we’ve needed our GIS department to perform even the simplest mapping tasks, such as overlaying data from a spreadsheet on top of our GIS data to provide a spatial view to support some business function. ArcGIS Online will allow an entire organization to easily complete these types of tasks and so much more. It all starts with creating an ArcGIS Online subscription account for your organization. There are different subscription levels depending on how many named users you want to include, and each level comes with a specified number of credits. Credits can be used for serving data over the Internet or even using ArcGIS Online to run various geoprocessing tasks that may benefit from the scal- able power of the cloud. You see, ArcGIS Online utilizes Amazon Web Services, which has the ability to add servers on an as-needed basis, resulting in virtually unlimited processing power. This is accomplished without any effort from your organization—it’s built in. But this is the standard pitch of any web services busi- ness plan and is not unique to Esri. What Esri brings is a functional, easy-to-use interface that allows just about anyone to publish and consume geographic content without any 10 Esri News for Electric & Gas Utilities Winter 2012/2013
- 11. The user can now share a new custom web map with his or her own organization, other ArcGIS Online users, or even with the general public based on Esri’s built-in security model. And here’s the best part: viewers can access the web map on virtu- ally any device out there via a plethora of applications—most easily via web browsers on the PC, Mac, iPhone, iPad, Android, et cetera—but also via many free Esri applications including ArcGIS Explorer (thick client or web based) and all the free native Esri mobile applications Why is this release significant? There are some real guts to this technology and some serious value. And even more, this release of ArcGIS Online is just the tip of the ice- berg. Esri has made a major investment in ArcGIS Online—in capital, marketing, and manpower. And that’s because this is the new direction of the company, from Esri president Jack Dangermond on down. As we head into the future of GIS, you will certainly see ArcGIS Online as a foundational component of the technology, the workflows, and the larger business platform. We too were wary at first, but SSP has seen enough and experimented enough to see not only the viability but the probability of ArcGIS Online being part of our future. So where does SSP Innovations fit into the picture with ArcGIS Online, if it’s such an easy technology? That is a good question that we have discussed with a number of folks at Esri. It’s certainly our role as a part- ner to introduce our customers to this new technology and help them begin to use it within their organizations. But it is also our job to begin enabling ArcGIS Online within our customers’ day-to-day operations. The basics of web mapping are indeed easy and will provide a lot of value on their own. But we can take this technology to a whole new level by extending it into the data management, collection, quality assurance, and analytics of a utility. We’ve already begun building some custom ArcGIS Online demos for utilities, and we promise you are going to love interacting with your back- office electric, gas, and water data from your iPad or any other device. For now, go get your organization signed up for an ArcGIS Online account. If you need assistance, contact your Esri account manager, or ping SSP, as we are here to answer any questions and can help you get off the ground in no time at all. for iOS, Android, or Windows Mobile devices. And don’t forget good old bulky ArcMap—it can consume web maps as well. We’ve invested heavily in ArcGIS for Server. Where does that fit in? We’ve talked about publishing content from CSV and Excel, but you can also add ArcGIS for Server map services and feature services directly to your web maps and even combine them with all the other data you’ve added to your ArcGIS Online account. You remember when Esri started talking about mashups a few years back? ArcGIS Online makes the mashing easy. Grab a public basemap, add your utility assets via an ArcGIS for Server map service, and overlay your file-based data from every other department in your There’s no way we can publish our proprietary data into the cloud. Where’s the security? This was likely our most important recent revelation. You can use your private, back-office GIS data via ArcGIS Online without ever publishing or moving it to the cloud. We’re talking about your poles, transformers, gas main, valves, regulators, and even your customers. Many utilities take the security around this data seriously, and for good reason. So get excited: you can leave that data on your private network. You can create a new ArcGIS Online web map that includes an ArcGIS for Server map service hosted on your private ArcGIS for Server instance. You can share that web map with other users in your organiza- tion. And as long as they are in the office or anywhere they can connect to their VPN, they can load the web map including the private ArcGIS for Server data. organization—all in about five minutes. Share the map and have your depart- ment head, city manager, or CEO reviewing it on an iPad seconds later. More and more utilities are enabling field users with cel- lular-based air cards and VPN access. It’s no coincidence that ArcGIS Online sup- ports this model. So let’s talk about your (and our) objections and concerns. Here are three we’ve heard from many customers. 11Winter 2012/2013 esri.com/electricgas Case Study
- 12. Feedback Strengthens GIS Data Quality By Michael Buri, Nashville Electric Service In 1997, Nashville Electric Service (NES) in Tennessee started maintaining GIS network connectivity information for its outage management system (OMS). Since that time, GIS operators have asked for feedback on the quality of the GIS data to improve its accuracy. Those who used the data were asked to report any information that was missing or incorrect so it could be investigated and fixed. However, feedback can be difficult to give and receive. Supervisors at NES took a number of steps to increase the odds of receiving feedback. They continue to ask for errors and omissions to be reported, assign top editing priority to reported OMS issues, and follow up on all findings or corrections. The feedback process started with occa- sional verbal communications, then devel- oped into a paper process and then an e-mail process. Pole numbers (unique identifiers) were listed alongside issues associated with, or near, that pole. The listed poles were manu- ally identified with a geographic region and a specific editor. The editor’s name was added “The new tag process is a huge improvement over past methods to track needed changes.” Carolyn Smith, Senior Associate Engineer at NES alongside each pole number, and the listed poles were then e-mailed to the editors for in- vestigation and correction. When completed, the editors would e-mail back notification— and list comments, if any—on items that were investigated but found to be correct. As time progressed, more complex issues were added to the process such as multiple circuit connections on a single pole or within a tight area like a substation gateway. As these more complicated situations could not be summarized in a single line, staff used screen prints and added notes and graphics. They printed two copies—one for the OMS engineer and the other for the editor. Once corrected, the print was sent back to the OMS engineer to be marked as complete and stored. Over time, the stored papers, which had not been corrected, would be investi- gated and re-sent to editors for correction. In some cases, the original paper was misplaced, corrected but not sent, or sent but not received. Overall, the process was working, but not very efficiently. The team was receiving The ModelBuilder Process 12 Esri News for Electric & Gas Utilities Winter 2012/2013
- 13. Field Picture of Single-Phase Transformer (with lightning arrestor) continued on page 14 feedback, sometimes quite a lot of it, but still needed to improve the workflow. To do this, NES supervisors turned to the OMS. The OMS at NES provides dispatchers with a geographic view (x- and y-coordinates) of the electrical system. It also allows the use of tags to document events or processes. Based on these two features, it was decided to im- plement GIS tags within the OMS to capture feedback for the GIS editors. The tags would be stored in the OMS database, with x- and y-coordinates. Because prior OMS feedback had passed through the OMS engineer, it was initially decided to not link directly from the OMS database into the GIS database but to allow the OMS engineer to copy tag records into a spreadsheet. Within the spreadsheet, the OMS engineer screens and translates (for clarification) dispatcher comments and cre- ates graphically enhanced screen captures on complex issues. After review, the OMS engi- neer sends the spreadsheet via e-mail to the GIS specialist with associated screen captures linked in common directories to individual spreadsheet records (rows). A GIS specialist processes the spread- sheet through ArcGIS ModelBuilder, which intersects tag locations (points) and GIS editor areas of responsibility (polygons) and appends features (now identified by editor) into a GIS feature class designated CADOPS_ TAGS. The GIS specialist then e-mails the GIS editors that an update is now available and advises them to check their areas for feedback. Utilizing definition queries, editors can quickly see just their new tags and linked images and begin work to investigate, cor- rect, comment on, and mark as completed. This removes the completed tags from their definition query and view. A GIS specialist then quality reviews the tags for completion and marks them as reviewed. The records may then be reviewed by the OMS engineer. The new feedback system has generated 1,500 tags in 18 months. It has improved the NES process by eliminating paper; program- matically identifying the responsible GIS editor for each tag; and storing information regarding comments, completion, review, and time stamps. Tags, unlike paper, cannot be misplaced or easily duplicated. Tags also direct the editor to the specific area where work is requested. Users can select the indi- vidual feature and pan to its location. Further, NES staff has experienced unin- tended benefits in completing feedback loops between its operations department (which re- ports changed fuse sizes) and its planning de- partment (which verifies protection coordina- tion on the changed fuses or corrects the fuse size through a work order). Additionally, the system has improved communication between operations and customer engineering related to issues of job changes and pole ownership. These workflows are handled through the GIS editors, who contact personnel in planning or customer engineering personnel via e-mail. NES supervisors are now considering a portal based on ArcGIS—this would allow them to use the GIS as the initial capture point for feedback and enable more detailed error reports, as not all GIS features are located within the OMS. The portal would also allow feedback to occur from other users in different areas of the company by use of a standard web browser rather than special- ized software (such as the OMS). It would also allow mobile reporting while at the site of the discrepancy. Capturing user ID at the time of data entry would allow e-mails to be sent back to reporting users upon completion of the work to thank them for reporting and let them know what was done, thereby closing the loop. Statistics could be reported showing users and groups with the most reports or the most correct reports to help cultivate good reporters. A tag stated a three-phase transformer was in the field, but the GIS had it as a single phase. A GIS editor comment states that the picture confirms it is a single-phase transformer (so no change was made to the GIS data). 13Winter 2012/2013 esri.com/electricgas Case Study
- 14. Feedback Strengthens GIS Data Quality continued from page 13 A tag is shown verifying fuses installed in the field. Comments and an attribute indicated the engineering planning group was informed and approved the equipment. “When I’ve completed all the notifications and made all the corrections, I just change the status to complete, then reconcile and post, and the record is removed from my list of updates to do. It couldn’t be easier.” Carolyn Smith, Senior Associate Engineer at NES The new feedback process has worked well for NES, according to GIS and operations per- sonnel. By receiving feedback and improving the quality of data, NES can now rely on GIS as a stronger and more valuable tool. “The new tag process is a huge improve- ment over past methods to track needed changes,” said Carolyn Smith, senior associate engineer at NES. “It’s wonderful to be able to track the status of each of these records at any given time and for others to be able to see our progress as well. I love being able to click on the record and have it zoom directly to the item in question rather than having to search for it.” Smith explained her new process. “When I’ve completed all the notifications and made all the corrections, I just change the status to complete, then reconcile and post, and the record is removed from my list of updates to do. It couldn’t be easier.” Screen Print from OMS with OMS Engineer Comments Hyperlinked to Tag 14 Esri News for Electric & Gas Utilities Winter 2012/2013
- 15. ©2012 Schneider Electric. All Rights Reserved. Schneider Electric is a trademark owned by Schneider Electric Industries SAS or its affiliated companies. All other trademarks are property of their respective owners. • www.schneider-electric.com • Tel: 1 866 537 1091 Learnmoreaboutourexcitingnewbrand. Visitwww.schneider-electric.com. Telvent is now Schneider Electric. Secure. Flexible. Efficient. By adopting the Schneider Electric brand, we are able to build upon its consistent identity and reputation as a global solutions leader. You can expect the exact same world-class solutions and industry-leading customer service that you have come to rely on each day. In addition, we will be able to deliver to you new business enhancements and stronger solution offerings made possible through the combination of our technologies, knowledge, and other unique synergies and collective strengths. While our brand has changed, our focus remains the same: to help you meet your greatest challenges, while ensuring a sustainable world for future generations. Together,weoffer… More than 22.4 billion euros in annual sales Over 130,000 dedicated employees worldwide A committed presence in more than 100 countries
- 16. Presorted Standard US Postage Paid Esri 380 New York Street Redlands, California 92373-8100 usa Esri International User Conference You are GIS. You gain knowledge, share expertise, and help us understand our world. There’s a place where GIS goes beyond coordinates, breaks free of categories, and reaches past analysis. A place where products are launched, ideas are shared, and inspiration is set loose. Join us at the Esri UC. Register today at esri.com/ucutilities. United we map! Esri International User Conference July 8–12, 2013 | San Diego Convention Center 133705 28.7M2/13tk