SlideShare a Scribd company logo
1 of 8
NORMAL CURVE
0
0.01
0.02
0.03
0.04
0.05
0.06
0.07
0.08
0.09
0.1
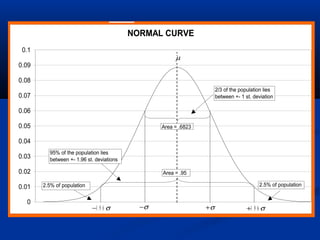
µ
+σ−σ +1 9 6. σ−1 9 6. σ
Area = .6823
2/3 of the population lies
between +- 1 st. deviation
Area = .95
2.5% of population2.5% of population
95% of the population lies
between +- 1.96 st. deviations
NORMAL CURVE
0
0.01
0.02
0.03
0.04
0.05
0.06
0.07
0.08
0.09
0.1
0 50 100 150 200 250 300
µ σ= =1 7 0 4 5,
Area = .4406
Z
x i
=
−
=
−
= −
( ) ( )
.
µ
σ
1 0 0 1 7 0
4 5
1 5 6
Area = .5 - .4406 = .0594
Area under the curve = 1
Three Distinct DistributionsThree Distinct Distributions
Mean St. Dev. Mean St. Dev.
1) Population
2) Sample
3) Sampling
Proportions Means
Distributions
N
Central Limit TheoremCentral Limit Theorem
If Repeated Random Samples of sizeIf Repeated Random Samples of size nn
are drawn from any population (ofare drawn from any population (of
whatever form) having a Meanwhatever form) having a Mean µµ andand
Standard DeviationStandard Deviation , then as, then as nn becomesbecomes
very largevery large, the Sampling Distribution of, the Sampling Distribution of
sample means approachessample means approaches NormalityNormality withwith
MeanMean µµ and Standard Deviationand Standard Deviation σ / .n
% of Population that pays $250 = .17%
0
0.01
0.02
0.03
0.04
0.05
0.06
0.07
0.08
0.09
0.1
0 50 100 150 200 250 300
Z
a r e a
=
−
= =
=
2 4 9 5 1 7 0
4 5
7 9 5
4 5
1 7 7
4 6 1 6
. .
.
.
Z
a r e a
=
−
= =
=
2 5 0 5 1 7 0
4 5
8 0 5
4 5
1 7 9
4 6 3 3
. .
.
.
. . . .4 6 3 3 4 6 1 6 0 0 1 7 1 7 %− = o r
µ σ= =1 7 0 4 5,
20% of the population pays less than $132.20.
0
0.01
0.02
0.03
0.04
0.05
0.06
0.07
0.08
0.09
0.1
0 50 100 150 200 250 300
area = .2 area = .3
Z-score of area of .2995 (~.3) = -0.84
− =
−
− = − ⋅ = −
= − + =
0 8 4
1 7 0
4 5
1 7 0 8 4 4 5 3 7 8
3 7 8 1 7 0 1 3 2 2
.
. .
. .
x
x
x
µ σ= =1 7 0 4 5,
Z
x
=
− µ
σ
$132.20
Sampling Distribution for MeansSampling Distribution for Means
““If repeatedIf repeated Random Samples of SizeRandom Samples of Size nn areare
drawn from a normal population withdrawn from a normal population with MeanMean
µµ andand Standard DeviationStandard Deviation , the Sampling, the Sampling
Distribution of sample means will be normalDistribution of sample means will be normal
with Meanwith Mean µµ and Standard Deviationand Standard Deviation
--known as the Standard Error.”--known as the Standard Error.”σ / n
Sampling Distribution for Sample Means for a
Population with
0
0.05
0.1
0.15
0.2
0.25
0.3
7000 7050 7100 7150 7200 7250 7300 7350 7400 7450 7500 7550 7600 7650 7700 7750 7800 7850 7900 7950 8000

More Related Content

Similar to Normal_Curves_z-scores

Statistik 1 6 distribusi probabilitas normal
Statistik 1 6 distribusi probabilitas normalStatistik 1 6 distribusi probabilitas normal
Statistik 1 6 distribusi probabilitas normalSelvin Hadi
 
4 2 continuous probability distributionn
4 2 continuous probability    distributionn4 2 continuous probability    distributionn
4 2 continuous probability distributionnLama K Banna
 
02 PSBE3_PPT.Ch01_2_Examining Distribution.ppt
02 PSBE3_PPT.Ch01_2_Examining Distribution.ppt02 PSBE3_PPT.Ch01_2_Examining Distribution.ppt
02 PSBE3_PPT.Ch01_2_Examining Distribution.pptBishoyRomani
 
8. normal distribution qt pgdm 1st semester
8. normal distribution qt pgdm 1st  semester8. normal distribution qt pgdm 1st  semester
8. normal distribution qt pgdm 1st semesterKaran Kukreja
 
Discrete and continuous probability distributions ppt @ bec doms
Discrete and continuous probability distributions ppt @ bec domsDiscrete and continuous probability distributions ppt @ bec doms
Discrete and continuous probability distributions ppt @ bec domsBabasab Patil
 
The standard normal curve & its application in biomedical sciences
The standard normal curve & its application in biomedical sciencesThe standard normal curve & its application in biomedical sciences
The standard normal curve & its application in biomedical sciencesAbhi Manu
 
Normal Probability Distribution
Normal Probability DistributionNormal Probability Distribution
Normal Probability Distributionmandalina landy
 
Estimating a Population Standard Deviation or Variance
Estimating a Population Standard Deviation or VarianceEstimating a Population Standard Deviation or Variance
Estimating a Population Standard Deviation or VarianceLong Beach City College
 
Estimating a Population Standard Deviation or Variance
Estimating a Population Standard Deviation or Variance Estimating a Population Standard Deviation or Variance
Estimating a Population Standard Deviation or Variance Long Beach City College
 
Normal probability distribution
Normal probability distributionNormal probability distribution
Normal probability distributionNadeem Uddin
 
Solution to the Practice Test 3A, Normal Probability Distribution
Solution to the Practice Test 3A, Normal Probability DistributionSolution to the Practice Test 3A, Normal Probability Distribution
Solution to the Practice Test 3A, Normal Probability DistributionLong Beach City College
 
Mean, median, and mode ug
Mean, median, and mode ugMean, median, and mode ug
Mean, median, and mode ugAbhishekDas15
 
continuous probability distributions.ppt
continuous probability distributions.pptcontinuous probability distributions.ppt
continuous probability distributions.pptLLOYDARENAS1
 
Normal Distribution including some examples
Normal Distribution including some examplesNormal Distribution including some examples
Normal Distribution including some exampleshearviesalibio1
 
Solution to the Practice Test 3A, Chapter 6 Normal Probability Distribution
Solution to the Practice Test 3A, Chapter 6 Normal Probability DistributionSolution to the Practice Test 3A, Chapter 6 Normal Probability Distribution
Solution to the Practice Test 3A, Chapter 6 Normal Probability DistributionLong Beach City College
 

Similar to Normal_Curves_z-scores (20)

Statistik 1 6 distribusi probabilitas normal
Statistik 1 6 distribusi probabilitas normalStatistik 1 6 distribusi probabilitas normal
Statistik 1 6 distribusi probabilitas normal
 
4 2 continuous probability distributionn
4 2 continuous probability    distributionn4 2 continuous probability    distributionn
4 2 continuous probability distributionn
 
Ch05
Ch05Ch05
Ch05
 
02 PSBE3_PPT.Ch01_2_Examining Distribution.ppt
02 PSBE3_PPT.Ch01_2_Examining Distribution.ppt02 PSBE3_PPT.Ch01_2_Examining Distribution.ppt
02 PSBE3_PPT.Ch01_2_Examining Distribution.ppt
 
Inferiential statistics .pptx
Inferiential statistics .pptxInferiential statistics .pptx
Inferiential statistics .pptx
 
8. normal distribution qt pgdm 1st semester
8. normal distribution qt pgdm 1st  semester8. normal distribution qt pgdm 1st  semester
8. normal distribution qt pgdm 1st semester
 
Discrete and continuous probability distributions ppt @ bec doms
Discrete and continuous probability distributions ppt @ bec domsDiscrete and continuous probability distributions ppt @ bec doms
Discrete and continuous probability distributions ppt @ bec doms
 
The standard normal curve & its application in biomedical sciences
The standard normal curve & its application in biomedical sciencesThe standard normal curve & its application in biomedical sciences
The standard normal curve & its application in biomedical sciences
 
Normal Probability Distribution
Normal Probability DistributionNormal Probability Distribution
Normal Probability Distribution
 
Estimating a Population Standard Deviation or Variance
Estimating a Population Standard Deviation or VarianceEstimating a Population Standard Deviation or Variance
Estimating a Population Standard Deviation or Variance
 
Estimating a Population Standard Deviation or Variance
Estimating a Population Standard Deviation or Variance Estimating a Population Standard Deviation or Variance
Estimating a Population Standard Deviation or Variance
 
Normal probability distribution
Normal probability distributionNormal probability distribution
Normal probability distribution
 
Solution to the Practice Test 3A, Normal Probability Distribution
Solution to the Practice Test 3A, Normal Probability DistributionSolution to the Practice Test 3A, Normal Probability Distribution
Solution to the Practice Test 3A, Normal Probability Distribution
 
Mean, median, and mode ug
Mean, median, and mode ugMean, median, and mode ug
Mean, median, and mode ug
 
lecture6.ppt
lecture6.pptlecture6.ppt
lecture6.ppt
 
continuous probability distributions.ppt
continuous probability distributions.pptcontinuous probability distributions.ppt
continuous probability distributions.ppt
 
Normal Distribution
Normal DistributionNormal Distribution
Normal Distribution
 
Input analysis
Input analysisInput analysis
Input analysis
 
Normal Distribution including some examples
Normal Distribution including some examplesNormal Distribution including some examples
Normal Distribution including some examples
 
Solution to the Practice Test 3A, Chapter 6 Normal Probability Distribution
Solution to the Practice Test 3A, Chapter 6 Normal Probability DistributionSolution to the Practice Test 3A, Chapter 6 Normal Probability Distribution
Solution to the Practice Test 3A, Chapter 6 Normal Probability Distribution
 

More from Omar (TUBBS 128) Ventura VII (9)

Sampling and Inference_Political_Science
Sampling and Inference_Political_ScienceSampling and Inference_Political_Science
Sampling and Inference_Political_Science
 
The New Fair Property Assessment Plan
The New Fair Property Assessment PlanThe New Fair Property Assessment Plan
The New Fair Property Assessment Plan
 
The fair assessmetn_plan_spring_2006_cory_cook_ca_pol
The fair assessmetn_plan_spring_2006_cory_cook_ca_polThe fair assessmetn_plan_spring_2006_cory_cook_ca_pol
The fair assessmetn_plan_spring_2006_cory_cook_ca_pol
 
Explanations and hypotheses ch 2
Explanations and hypotheses ch 2Explanations and hypotheses ch 2
Explanations and hypotheses ch 2
 
Hypothesis testng
Hypothesis testngHypothesis testng
Hypothesis testng
 
Examining relationships m2
Examining relationships m2Examining relationships m2
Examining relationships m2
 
Ch 7 regression_lab_outpu1
Ch 7 regression_lab_outpu1Ch 7 regression_lab_outpu1
Ch 7 regression_lab_outpu1
 
Ch 7 correlation_and_linear_regression
Ch 7 correlation_and_linear_regressionCh 7 correlation_and_linear_regression
Ch 7 correlation_and_linear_regression
 
Correlation & Regression_
Correlation & Regression_Correlation & Regression_
Correlation & Regression_
 

Recently uploaded

Full Stack Web Development Course for Beginners
Full Stack Web Development Course  for BeginnersFull Stack Web Development Course  for Beginners
Full Stack Web Development Course for BeginnersSabitha Banu
 
Like-prefer-love -hate+verb+ing & silent letters & citizenship text.pdf
Like-prefer-love -hate+verb+ing & silent letters & citizenship text.pdfLike-prefer-love -hate+verb+ing & silent letters & citizenship text.pdf
Like-prefer-love -hate+verb+ing & silent letters & citizenship text.pdfMr Bounab Samir
 
INTRODUCTION TO CATHOLIC CHRISTOLOGY.pptx
INTRODUCTION TO CATHOLIC CHRISTOLOGY.pptxINTRODUCTION TO CATHOLIC CHRISTOLOGY.pptx
INTRODUCTION TO CATHOLIC CHRISTOLOGY.pptxHumphrey A Beña
 
Karra SKD Conference Presentation Revised.pptx
Karra SKD Conference Presentation Revised.pptxKarra SKD Conference Presentation Revised.pptx
Karra SKD Conference Presentation Revised.pptxAshokKarra1
 
Q4 English4 Week3 PPT Melcnmg-based.pptx
Q4 English4 Week3 PPT Melcnmg-based.pptxQ4 English4 Week3 PPT Melcnmg-based.pptx
Q4 English4 Week3 PPT Melcnmg-based.pptxnelietumpap1
 
AMERICAN LANGUAGE HUB_Level2_Student'sBook_Answerkey.pdf
AMERICAN LANGUAGE HUB_Level2_Student'sBook_Answerkey.pdfAMERICAN LANGUAGE HUB_Level2_Student'sBook_Answerkey.pdf
AMERICAN LANGUAGE HUB_Level2_Student'sBook_Answerkey.pdfphamnguyenenglishnb
 
ENGLISH6-Q4-W3.pptxqurter our high choom
ENGLISH6-Q4-W3.pptxqurter our high choomENGLISH6-Q4-W3.pptxqurter our high choom
ENGLISH6-Q4-W3.pptxqurter our high choomnelietumpap1
 
HỌC TỐT TIẾNG ANH 11 THEO CHƯƠNG TRÌNH GLOBAL SUCCESS ĐÁP ÁN CHI TIẾT - CẢ NĂ...
HỌC TỐT TIẾNG ANH 11 THEO CHƯƠNG TRÌNH GLOBAL SUCCESS ĐÁP ÁN CHI TIẾT - CẢ NĂ...HỌC TỐT TIẾNG ANH 11 THEO CHƯƠNG TRÌNH GLOBAL SUCCESS ĐÁP ÁN CHI TIẾT - CẢ NĂ...
HỌC TỐT TIẾNG ANH 11 THEO CHƯƠNG TRÌNH GLOBAL SUCCESS ĐÁP ÁN CHI TIẾT - CẢ NĂ...Nguyen Thanh Tu Collection
 
Judging the Relevance and worth of ideas part 2.pptx
Judging the Relevance  and worth of ideas part 2.pptxJudging the Relevance  and worth of ideas part 2.pptx
Judging the Relevance and worth of ideas part 2.pptxSherlyMaeNeri
 
Gas measurement O2,Co2,& ph) 04/2024.pptx
Gas measurement O2,Co2,& ph) 04/2024.pptxGas measurement O2,Co2,& ph) 04/2024.pptx
Gas measurement O2,Co2,& ph) 04/2024.pptxDr.Ibrahim Hassaan
 
ACC 2024 Chronicles. Cardiology. Exam.pdf
ACC 2024 Chronicles. Cardiology. Exam.pdfACC 2024 Chronicles. Cardiology. Exam.pdf
ACC 2024 Chronicles. Cardiology. Exam.pdfSpandanaRallapalli
 
ANG SEKTOR NG agrikultura.pptx QUARTER 4
ANG SEKTOR NG agrikultura.pptx QUARTER 4ANG SEKTOR NG agrikultura.pptx QUARTER 4
ANG SEKTOR NG agrikultura.pptx QUARTER 4MiaBumagat1
 
Procuring digital preservation CAN be quick and painless with our new dynamic...
Procuring digital preservation CAN be quick and painless with our new dynamic...Procuring digital preservation CAN be quick and painless with our new dynamic...
Procuring digital preservation CAN be quick and painless with our new dynamic...Jisc
 
Inclusivity Essentials_ Creating Accessible Websites for Nonprofits .pdf
Inclusivity Essentials_ Creating Accessible Websites for Nonprofits .pdfInclusivity Essentials_ Creating Accessible Websites for Nonprofits .pdf
Inclusivity Essentials_ Creating Accessible Websites for Nonprofits .pdfTechSoup
 
ECONOMIC CONTEXT - PAPER 1 Q3: NEWSPAPERS.pptx
ECONOMIC CONTEXT - PAPER 1 Q3: NEWSPAPERS.pptxECONOMIC CONTEXT - PAPER 1 Q3: NEWSPAPERS.pptx
ECONOMIC CONTEXT - PAPER 1 Q3: NEWSPAPERS.pptxiammrhaywood
 
How to do quick user assign in kanban in Odoo 17 ERP
How to do quick user assign in kanban in Odoo 17 ERPHow to do quick user assign in kanban in Odoo 17 ERP
How to do quick user assign in kanban in Odoo 17 ERPCeline George
 
call girls in Kamla Market (DELHI) 🔝 >༒9953330565🔝 genuine Escort Service 🔝✔️✔️
call girls in Kamla Market (DELHI) 🔝 >༒9953330565🔝 genuine Escort Service 🔝✔️✔️call girls in Kamla Market (DELHI) 🔝 >༒9953330565🔝 genuine Escort Service 🔝✔️✔️
call girls in Kamla Market (DELHI) 🔝 >༒9953330565🔝 genuine Escort Service 🔝✔️✔️9953056974 Low Rate Call Girls In Saket, Delhi NCR
 

Recently uploaded (20)

Full Stack Web Development Course for Beginners
Full Stack Web Development Course  for BeginnersFull Stack Web Development Course  for Beginners
Full Stack Web Development Course for Beginners
 
OS-operating systems- ch04 (Threads) ...
OS-operating systems- ch04 (Threads) ...OS-operating systems- ch04 (Threads) ...
OS-operating systems- ch04 (Threads) ...
 
Like-prefer-love -hate+verb+ing & silent letters & citizenship text.pdf
Like-prefer-love -hate+verb+ing & silent letters & citizenship text.pdfLike-prefer-love -hate+verb+ing & silent letters & citizenship text.pdf
Like-prefer-love -hate+verb+ing & silent letters & citizenship text.pdf
 
INTRODUCTION TO CATHOLIC CHRISTOLOGY.pptx
INTRODUCTION TO CATHOLIC CHRISTOLOGY.pptxINTRODUCTION TO CATHOLIC CHRISTOLOGY.pptx
INTRODUCTION TO CATHOLIC CHRISTOLOGY.pptx
 
Karra SKD Conference Presentation Revised.pptx
Karra SKD Conference Presentation Revised.pptxKarra SKD Conference Presentation Revised.pptx
Karra SKD Conference Presentation Revised.pptx
 
Q4 English4 Week3 PPT Melcnmg-based.pptx
Q4 English4 Week3 PPT Melcnmg-based.pptxQ4 English4 Week3 PPT Melcnmg-based.pptx
Q4 English4 Week3 PPT Melcnmg-based.pptx
 
AMERICAN LANGUAGE HUB_Level2_Student'sBook_Answerkey.pdf
AMERICAN LANGUAGE HUB_Level2_Student'sBook_Answerkey.pdfAMERICAN LANGUAGE HUB_Level2_Student'sBook_Answerkey.pdf
AMERICAN LANGUAGE HUB_Level2_Student'sBook_Answerkey.pdf
 
ENGLISH6-Q4-W3.pptxqurter our high choom
ENGLISH6-Q4-W3.pptxqurter our high choomENGLISH6-Q4-W3.pptxqurter our high choom
ENGLISH6-Q4-W3.pptxqurter our high choom
 
HỌC TỐT TIẾNG ANH 11 THEO CHƯƠNG TRÌNH GLOBAL SUCCESS ĐÁP ÁN CHI TIẾT - CẢ NĂ...
HỌC TỐT TIẾNG ANH 11 THEO CHƯƠNG TRÌNH GLOBAL SUCCESS ĐÁP ÁN CHI TIẾT - CẢ NĂ...HỌC TỐT TIẾNG ANH 11 THEO CHƯƠNG TRÌNH GLOBAL SUCCESS ĐÁP ÁN CHI TIẾT - CẢ NĂ...
HỌC TỐT TIẾNG ANH 11 THEO CHƯƠNG TRÌNH GLOBAL SUCCESS ĐÁP ÁN CHI TIẾT - CẢ NĂ...
 
Judging the Relevance and worth of ideas part 2.pptx
Judging the Relevance  and worth of ideas part 2.pptxJudging the Relevance  and worth of ideas part 2.pptx
Judging the Relevance and worth of ideas part 2.pptx
 
Gas measurement O2,Co2,& ph) 04/2024.pptx
Gas measurement O2,Co2,& ph) 04/2024.pptxGas measurement O2,Co2,& ph) 04/2024.pptx
Gas measurement O2,Co2,& ph) 04/2024.pptx
 
ACC 2024 Chronicles. Cardiology. Exam.pdf
ACC 2024 Chronicles. Cardiology. Exam.pdfACC 2024 Chronicles. Cardiology. Exam.pdf
ACC 2024 Chronicles. Cardiology. Exam.pdf
 
ANG SEKTOR NG agrikultura.pptx QUARTER 4
ANG SEKTOR NG agrikultura.pptx QUARTER 4ANG SEKTOR NG agrikultura.pptx QUARTER 4
ANG SEKTOR NG agrikultura.pptx QUARTER 4
 
YOUVE GOT EMAIL_FINALS_EL_DORADO_2024.pptx
YOUVE GOT EMAIL_FINALS_EL_DORADO_2024.pptxYOUVE GOT EMAIL_FINALS_EL_DORADO_2024.pptx
YOUVE GOT EMAIL_FINALS_EL_DORADO_2024.pptx
 
Procuring digital preservation CAN be quick and painless with our new dynamic...
Procuring digital preservation CAN be quick and painless with our new dynamic...Procuring digital preservation CAN be quick and painless with our new dynamic...
Procuring digital preservation CAN be quick and painless with our new dynamic...
 
FINALS_OF_LEFT_ON_C'N_EL_DORADO_2024.pptx
FINALS_OF_LEFT_ON_C'N_EL_DORADO_2024.pptxFINALS_OF_LEFT_ON_C'N_EL_DORADO_2024.pptx
FINALS_OF_LEFT_ON_C'N_EL_DORADO_2024.pptx
 
Inclusivity Essentials_ Creating Accessible Websites for Nonprofits .pdf
Inclusivity Essentials_ Creating Accessible Websites for Nonprofits .pdfInclusivity Essentials_ Creating Accessible Websites for Nonprofits .pdf
Inclusivity Essentials_ Creating Accessible Websites for Nonprofits .pdf
 
ECONOMIC CONTEXT - PAPER 1 Q3: NEWSPAPERS.pptx
ECONOMIC CONTEXT - PAPER 1 Q3: NEWSPAPERS.pptxECONOMIC CONTEXT - PAPER 1 Q3: NEWSPAPERS.pptx
ECONOMIC CONTEXT - PAPER 1 Q3: NEWSPAPERS.pptx
 
How to do quick user assign in kanban in Odoo 17 ERP
How to do quick user assign in kanban in Odoo 17 ERPHow to do quick user assign in kanban in Odoo 17 ERP
How to do quick user assign in kanban in Odoo 17 ERP
 
call girls in Kamla Market (DELHI) 🔝 >༒9953330565🔝 genuine Escort Service 🔝✔️✔️
call girls in Kamla Market (DELHI) 🔝 >༒9953330565🔝 genuine Escort Service 🔝✔️✔️call girls in Kamla Market (DELHI) 🔝 >༒9953330565🔝 genuine Escort Service 🔝✔️✔️
call girls in Kamla Market (DELHI) 🔝 >༒9953330565🔝 genuine Escort Service 🔝✔️✔️
 

Normal_Curves_z-scores

  • 1. NORMAL CURVE 0 0.01 0.02 0.03 0.04 0.05 0.06 0.07 0.08 0.09 0.1 µ +σ−σ +1 9 6. σ−1 9 6. σ Area = .6823 2/3 of the population lies between +- 1 st. deviation Area = .95 2.5% of population2.5% of population 95% of the population lies between +- 1.96 st. deviations
  • 2. NORMAL CURVE 0 0.01 0.02 0.03 0.04 0.05 0.06 0.07 0.08 0.09 0.1 0 50 100 150 200 250 300 µ σ= =1 7 0 4 5, Area = .4406 Z x i = − = − = − ( ) ( ) . µ σ 1 0 0 1 7 0 4 5 1 5 6 Area = .5 - .4406 = .0594 Area under the curve = 1
  • 3. Three Distinct DistributionsThree Distinct Distributions Mean St. Dev. Mean St. Dev. 1) Population 2) Sample 3) Sampling Proportions Means Distributions N
  • 4. Central Limit TheoremCentral Limit Theorem If Repeated Random Samples of sizeIf Repeated Random Samples of size nn are drawn from any population (ofare drawn from any population (of whatever form) having a Meanwhatever form) having a Mean µµ andand Standard DeviationStandard Deviation , then as, then as nn becomesbecomes very largevery large, the Sampling Distribution of, the Sampling Distribution of sample means approachessample means approaches NormalityNormality withwith MeanMean µµ and Standard Deviationand Standard Deviation σ / .n
  • 5. % of Population that pays $250 = .17% 0 0.01 0.02 0.03 0.04 0.05 0.06 0.07 0.08 0.09 0.1 0 50 100 150 200 250 300 Z a r e a = − = = = 2 4 9 5 1 7 0 4 5 7 9 5 4 5 1 7 7 4 6 1 6 . . . . Z a r e a = − = = = 2 5 0 5 1 7 0 4 5 8 0 5 4 5 1 7 9 4 6 3 3 . . . . . . . .4 6 3 3 4 6 1 6 0 0 1 7 1 7 %− = o r µ σ= =1 7 0 4 5,
  • 6. 20% of the population pays less than $132.20. 0 0.01 0.02 0.03 0.04 0.05 0.06 0.07 0.08 0.09 0.1 0 50 100 150 200 250 300 area = .2 area = .3 Z-score of area of .2995 (~.3) = -0.84 − = − − = − ⋅ = − = − + = 0 8 4 1 7 0 4 5 1 7 0 8 4 4 5 3 7 8 3 7 8 1 7 0 1 3 2 2 . . . . . x x x µ σ= =1 7 0 4 5, Z x = − µ σ $132.20
  • 7. Sampling Distribution for MeansSampling Distribution for Means ““If repeatedIf repeated Random Samples of SizeRandom Samples of Size nn areare drawn from a normal population withdrawn from a normal population with MeanMean µµ andand Standard DeviationStandard Deviation , the Sampling, the Sampling Distribution of sample means will be normalDistribution of sample means will be normal with Meanwith Mean µµ and Standard Deviationand Standard Deviation --known as the Standard Error.”--known as the Standard Error.”σ / n
  • 8. Sampling Distribution for Sample Means for a Population with 0 0.05 0.1 0.15 0.2 0.25 0.3 7000 7050 7100 7150 7200 7250 7300 7350 7400 7450 7500 7550 7600 7650 7700 7750 7800 7850 7900 7950 8000