

Empfohlen
Weitere ähnliche Inhalte
Was ist angesagt?
Was ist angesagt? (12)
Andere mochten auch
Andere mochten auch (10)
Ähnlich wie Brinker Capital/Destinations/2013 strategy results
Ähnlich wie Brinker Capital/Destinations/2013 strategy results (20)
Mehr von Don McNeill, ChFC
Mehr von Don McNeill, ChFC (17)
Kürzlich hochgeladen
Kürzlich hochgeladen (20)
Brinker Capital/Destinations/2013 strategy results
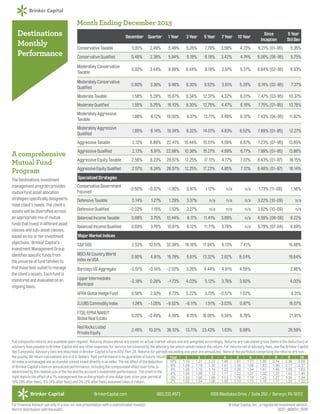
- 1. Month Ending December 2013 Destinations Monthly Performance December Quarter 1 Year 3 Year 5 Year 7 Year 10 Year Since Inception 5 Year Std Dev Conservative Taxable 0.61% 2.49% 5.49% 5.26% 7.79% 3.58% 4.73% 6.21% (01-95) 5.35% Conservative Qualified 0.46% 2.38% 5.94% 5.18% 8.18% 3.42% 4.74% 6.06% (06-95) 5.75% Moderately Conservative Taxable 0.92% 3.44% 8.99% 6.44% 9.19% 3.97% 5.27% 6.64% (02-95) 6.93% Moderately Conservative Qualified 0.80% 3.38% 9.48% 6.30% 9.52% 3.81% 5.26% 6.74% (02-95) 7.37% Moderate Taxable 1.58% 5.28% 15.67% 8.34% 12.37% 4.32% 6.01% 7.47% (03-95) 10.37% Moderate Qualified 1.55% 5.25% 16.10% 8.30% 12.75% 4.47% 6.16% 7.75% (01-95) 10.76% Moderately Aggressive Taxable 1.86% 6.12% 19.00% 9.37% 13.71% 4.49% 6.37% 7.43% (04-95) 11.92% Moderately Aggressive Qualified 1.85% 6.14% 19.24% 9.32% 14.01% 4.63% 6.52% 7.69% (01-95) 12.27% Aggressive Taxable 2.12% 6.89% 22.41% 10.44% 15.01% 4.59% 6.67% 7.23% (07-95) 13.65% A comprehensive Mutual Fund Program Aggressive Qualified 2.13% 6.91% 22.68% 10.38% 15.27% 4.69% 6.77% 7.99% (01-95) 13.86% Aggressive Equity Taxable 2.56% 8.23% 28.57% 12.25% 17.11% 4.77% 7.07% 6.43% (01-97) 16.15% Aggressive Equity Qualified 2.57% 8.24% 28.57% 12.25% 17.22% 4.85% 7.12% 6.46% (01-97) 16.14% The Destinations investment management program provides mutual fund asset allocation strategies specifically designed to meet client’s needs. The client’s assets will be diversified across an appropriate mix of mutual funds that invest in different asset classes and sub-asset classes, based on his or her investment objectives. Brinker Capital’s Investment Management Group identifies specific funds from the universe of fund families to find those best suited to manage the client’s assets. Each fund is monitored and evaluated on an ongoing basis. Specialized Strategies -0.50% -0.32% -1.30% 0.81% 1.12% n/a n/a 1.73% (11-08) 1.56% Defensive Taxable 0.14% 1.27% 1.29% 3.37% n/a n/a n/a 3.22% (10-09) n/a Defensive Qualified -0.02% 1.15% 1.53% 3.27% n/a n/a n/a 3.92% (10-09) n/a Balanced Income Taxable 0.69% 3.75% 10.44% 8.17% 11.41% 3.69% n/a 4.59% (08-06) 8.22% Balanced Income Qualified 0.69% 3.76% 10.81% 8.12% 11.71% 3.79% n/a 5.79% (07-04) 8.69% S&P 500 2.53% 10.51% 32.39% 16.18% 17.94% 6.13% 7.41% 15.68% MSCI All Country World Index ex USA 0.90% 4.81% 15.78% 5.61% 13.32% 2.62% 8.04% 19.64% Barclays US Aggregate -0.57% -0.14% -2.02% 3.26% 4.44% 4.91% 4.55% 2.86% Lipper Intermediate Municipal -0.18% 0.28% -1.73% 4.03% 5.12% 3.76% 3.50% 4.00% HFRX Global Hedge Fund 0.56% 2.33% 6.73% 0.22% 3.73% -0.57% 1.02% 4.31% DJ UBS Commodity Index 1.24% -1.05% -9.52% -8.11% 1.51% -3.03% 0.87% 16.07% FTSE/EPRA NAREIT Global Real Estate 0.20% -0.49% 4.39% 8.15% 16.06% 0.34% 8.78% 21.91% Red Rocks Listed Private Equity 2.45% 10.01% 39.10% 13.71% 23.43% 1.63% 9.99% 26.59% Conservative Government Focused Major Market Indices Full composite returns are available upon request. Returns shown above are based on actual market values and are weighted accordingly. Returns are calculated gross (before the deduction) of advisory fees payable to Brinker Capital and any other expenses for service not covered by the advisory fee which would reduce the return. For returns net of advisory fees, see the Brinker Capital Net Composite. Advisory fees are described in Brinker Capital’s Form ADV, Part 2A. Returns for periods exceeding one year are annualized. None of the portfolios comprising the returns are nonfee paying. All return calculations are in U.S. Dollars. Past performance is no guarantee of future results. Year 1 2 3 4 5 6 7 8 9 10 10% 1.10 1.21 1.33 1.46 1.61 1.77 1.95 2.14 2.36 2.59 An index is unmanaged and an investor cannot invest directly in an index. The net effect of the deduction 9% 1.09 1.19 1.30 1.41 1.54 1.68 1.83 1.99 2.17 2.37 of Brinker Capital’s fees on annualized performance, including the compounded effect over time, is 5% 1.05 1.10 1.16 1.22 1.28 1.34 1.41 1.48 1.55 1.63 determined by the relative size of the fee and the account’s investment performance. The chart to the 4% 1.04 1.08 1.12 1.17 1.22 1.27 1.32 1.37 1.42 1.48 right depicts the effect of a 1% management fee on the growth of one dollar over a ten year period at 3% 1.03 1.06 1.09 1.13 1.16 1.19 1.23 1.27 1.30 1.34 2% 1.02 1.04 1.06 1.08 1.10 1.13 1.15 1.17 1.20 1.22 10% (9% after fees), 5% (4% after fees) and 3% (2% after fees) assumed rates of return. BrinkerCapital.com For Financial Advisor use only in a one-on-one presentation with a sophisticated investor. Not for distribution with the public. 800.333.4573 1055 Westlakes Drive / Suite 250 / Berwyn, PA 19312 Brinker Capital, Inc., a registered investment advisor. DEST_MONTH_PERF