Tricumen / 'Rescuing' banks from Hedge Fund & Private Equity investments_9-Jan-14
•
0 gefällt mir•216 views

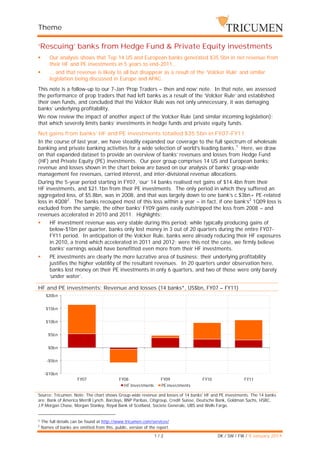
‘Rescuing’ banks from Hedge Fund & Private Equity investments Our analysis shows that Top 14 US and European banks generated $35.5bn in net revenue from their HF and PE investments in 5 years to end-2011… … and that revenue is likely to all but disappear as a result of the ‘Volcker Rule’ and similar legislation being discussed in Europe and APAC.

Empfohlen
Weitere ähnliche Inhalte
Was ist angesagt?
Was ist angesagt? (19)
Andere mochten auch
Andere mochten auch (7)
Ähnlich wie Tricumen / 'Rescuing' banks from Hedge Fund & Private Equity investments_9-Jan-14
Ähnlich wie Tricumen / 'Rescuing' banks from Hedge Fund & Private Equity investments_9-Jan-14 (20)
Mehr von Tricumen Ltd
Mehr von Tricumen Ltd (20)
Kürzlich hochgeladen
Kürzlich hochgeladen (20)
Tricumen / 'Rescuing' banks from Hedge Fund & Private Equity investments_9-Jan-14
- 1. Theme ‘Rescuing’ banks from Hedge Fund & Private Equity investments Our analysis shows that Top 14 US and European banks generated $35.5bn in net revenue from their HF and PE investments in 5 years to end-2011… … and that revenue is likely to all but disappear as a result of the ‘Volcker Rule’ and similar legislation being discussed in Europe and APAC. This note is a follow-up to our 7-Jan ‘Prop Traders – then and now’ note. In that note, we assessed the performance of prop traders that had left banks as a result of the ‘Volcker Rule’ and established their own funds, and concluded that the Volcker Rule was not only unnecessary, it was damaging banks’ underlying profitability. We now review the impact of another aspect of the Volcker Rule (and similar incoming legislation): that which severely limits banks’ investments in hedge funds and private equity funds. Net gains from banks’ HF and PE investments totalled $35.5bn in FY07-FY11 In the course of last year, we have steadily expanded our coverage to the full spectrum of wholesale banking and private banking activities for a wide selection of world’s leading banks.1 Here, we draw on that expanded dataset to provide an overview of banks’ revenues and losses from Hedge Fund (HF) and Private Equity (PE) investments. Our peer group comprises 14 US and European banks; revenue and losses shown in the chart below are based on our analysis of banks’ group-wide management fee revenues, carried interest, and inter-divisional revenue allocations. During the 5-year period starting in FY07, ‘our’ 14 banks realised net gains of $14.4bn from their HF investments, and $21.1bn from their PE investments. The only period in which they suffered an aggregated loss, of $5.8bn, was in 2008, and that was largely down to one bank’s c.$3bn+ PE-related loss in 4Q082. The banks recouped most of this loss within a year – in fact, if one bank’s2 1Q09 loss is excluded from the sample, the other banks’ FY09 gains easily outstripped the loss from 2008 – and revenues accelerated in 2010 and 2011. Highlights: HF investment revenue was very stable during this period: while typically producing gains of below-$1bn per quarter, banks only lost money in 3 out of 20 quarters during the entire FY07FY11 period. In anticipation of the Volcker Rule, banks were already reducing their HF exposures in 2010, a trend which accelerated in 2011 and 2012; were this not the case, we firmly believe banks’ earnings would have benefitted even more from their HF investments. PE investments are clearly the more lucrative area of business; their underlying profitability justifies the higher volatility of the resultant revenues. In 20 quarters under observation here, banks lost money on their PE investments in only 6 quarters, and two of those were only barely ‘under water’. HF and PE investments: Revenue and losses (14 banks*, US$bn, FY07 – FY11) $20bn $15bn $10bn $5bn $0bn -$5bn -$10bn FY07 FY08 HF Investments FY09 PE investments FY10 FY11 Source: Tricumen. Note: The chart shows Group-wide revenue and losses of 14 banks' HF and PE investments. The 14 banks are: Bank of America Merrill Lynch, Barclays, BNP Paribas, Citigroup, Credit Suisse, Deutsche Bank, Goldman Sachs, HSBC, J.P.Morgan Chase, Morgan Stanley, Royal Bank of Scotland, Societe Generale, UBS and Wells Fargo. 1 2 The full details can be found at http://www.tricumen.com/services/ Names of banks are omitted from this, public, version of the report. 1/2 DK / SW / FW / 9 January 2014
- 2. Theme About Tricumen Tricumen was founded in 2008. It quickly become a strong provider of diversified market intelligence across the capital markets and has since expanded into transaction and corporate banking coverage. Tricumen’s data has been used by many of the world’s leading investment banks as well as strategy consulting firms, investment managers and ‘blue chip’ corporations. Situated near Cambridge in the UK, Tricumen is almost exclusively staffed with senior individuals with an extensive track record of either working for or analysing banks; and boasts what we believe is the largest capital markets-focused research network of its peer group. Caveats This report and the information contained herein may not be reproduced or distributed in the whole or in part without the prior written consent of Tricumen Limited. Such consent is often given, provided that the information released is sourced to Tricumen and that it does not prejudice Tricumen Limited’s business or compromise the company’s ability to analyse the financial markets. Tricumen Limited has used all reasonable care in writing, editing and presenting the information found in this report. All reasonable effort has been made to ensure the information supplied is accurate and not misleading. For the purposes of cross- market comparison, all numerical data is normalised in accordance to Tricumen Limited’s proprietary product classification. Fully-researched dataset may contain margin of error of +/-10%; for modelled datasets, this margin may be wider. The information and commentary provided in this report has been compiled for informational purposes only. We recommend that independent advice and enquiries should be sought before acting upon it. Readers should not rely on this information for legal, accounting, investment, or similar purposes. No part of this report constitutes investment advice, any form of recommendation, or a solicitation to buy or sell any instrument or to engage in any trading or investment activity or strategy. Tricumen Limited does not provide investment advice or personal recommendation nor will it be deemed to have done so. Tricumen Limited makes no representation, guarantee or warranty as to the suitability, accuracy or completeness of the report or the information therein. Tricumen Limited assumes no responsibility for information contained in this report and disclaims all liability arising from negligence or otherwise in respect of such information. Tricumen Limited is not liable for any damages arising in contract, tort or otherwise from the use of or inability to use this report or any material contained in it, or from any action or decision taken as a result of using the report. 2/2 DK / SW / FW / 9 January 2014