2014-Use of near infrared spectroscopy to predict phytate P-Aureli et al EPC Norway
•
1 gefällt mir•1,413 views

Poster presented at the XIVth European Poultry Conference, 23-27 June 2014, Norway. Aureli et al.
Empfohlen

Empfohlen
Weitere ähnliche Inhalte
Andere mochten auch
Andere mochten auch (15)
Ähnlich wie 2014-Use of near infrared spectroscopy to predict phytate P-Aureli et al EPC Norway
Ähnlich wie 2014-Use of near infrared spectroscopy to predict phytate P-Aureli et al EPC Norway (20)
Mehr von DSM Animal Nutrition & Health
Mehr von DSM Animal Nutrition & Health (16)
Kürzlich hochgeladen
Kürzlich hochgeladen (20)
2014-Use of near infrared spectroscopy to predict phytate P-Aureli et al EPC Norway
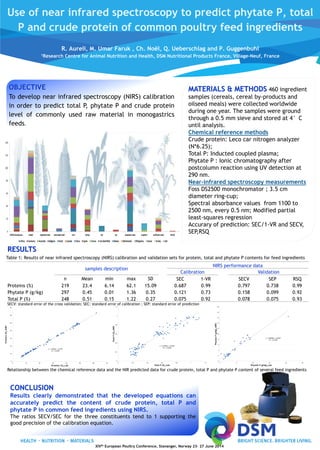
- 1. Use of near infrared spectroscopy to predict phytate P, total P and crude protein of common poultry feed ingredients R. Aureli, M. Umar Faruk , Ch. Noël, Q. Ueberschlag and P. Guggenbuhl 1Research Centre for Animal Nutrition and Health, DSM Nutritional Products France, Village-Neuf, France Table 1: Results of near infrared spectroscopy (NIRS) calibration and validation sets for protein, total and phytate P contents for feed ingredients RESULTS XIVth European Poultry Conference, Stavanger, Norway 23– 27 June 2014 samples description NIRS performance data Calibration Validation n Mean min max SD SEC 1-VR SECV SEP RSQ Proteins (%) 219 23.4 6.14 62.1 15.09 0.687 0.99 0.797 0.738 0.99 Phytate P (g/kg) 297 0.45 0.01 1.36 0.35 0.121 0.73 0.158 0.099 0.92 Total P (%) 248 0.51 0.15 1.22 0.27 0.075 0.92 0.078 0.075 0.93 SECV: standard error of the cross validation; SEC: standard error of calibration ; SEP: standard error of prediction OBJECTIVE To develop near infrared spectroscopy (NIRS) calibration in order to predict total P, phytate P and crude protein level of commonly used raw material in monogastrics feeds. CONCLUSION Results clearly demonstrated that the developed equations can accurately predict the content of crude protein, total P and phytate P in common feed ingredients using NIRS. The ratios SECV/SEC for the three constituents tend to 1 supporting the good precision of the calibration equation. MATERIALS & METHODS 460 ingredient samples (cereals, cereal by-products and oilseed meals) were collected worldwide during one year. The samples were ground through a 0.5 mm sieve and stored at 4°C until analysis. Chemical reference methods Crude protein: Leco car nitrogen analyzer (N*6.25); Total P: Inducted coupled plasma; Phytate P : Ionic chromatography after postcolumn reaction using UV detection at 290 nm. Near-infrared spectroscopy measurements Foss DS2500 monochromator ; 3.5 cm diameter ring-cup; Spectral absorbance values from 1100 to 2500 nm, every 0.5 nm; Modified partial least-squares regression Accurary of prediction: SEC/1-VR and SECV, SEP,RSQ Relationship between the chemical reference data and the NIR predicted data for crude protein, total P and phytate P content of several feed ingredients