

Empfohlen
Empfohlen
Weitere ähnliche Inhalte
Ähnlich wie World ranking list of materials handling vehicles
Ähnlich wie World ranking list of materials handling vehicles (19)
Kürzlich hochgeladen
Kürzlich hochgeladen (20)
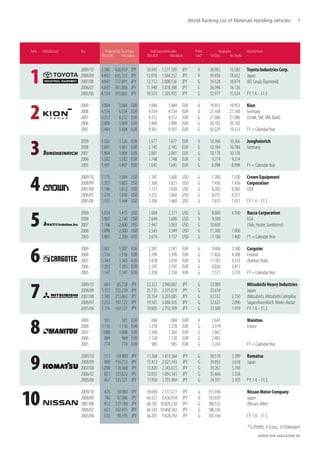
World ranking list of materials handling vehicles
- 1. World Ranking List of Materials Handling Vehicles 7 Rank Manufacturer Year Powered Ind. Truck Sales Total Corporation Sales Profit/ Employees Manufacturer Mio. EUR Mio. Valuta Mio. EUR Mio. Valuta Loss* Tot.Corp. Ind.Trucks 1 2009/10 3.390 426.919 JPY 10.941 1.377.769 JPY V 38.903 16.583 Toyota Industries Corp. 2008/09 4.842 635.123 JPY 12.078 1.584.252 JPY V 39.916 18.652 Japan 2007/08 4.942 777.691 JPY 12.712 2.000.536 JPY G 39.528 18.674 (BT, Cesab, Raymond) 2006/07 4.843 761.866 JPY 11.940 1.878.398 JPY G 36.096 16.136 2005/06 4.154 591.665 JPY 10.574 1.505.955 JPY G 32.977 15.024 FY: 1.4. - 31.3. 2 2009 3.084 3.084 EUR 3.084 3.084 EUR U 19.953 19.953 Kion 2008 4.554 4.554 EUR 4.554 4.554 EUR U 21.168 21.168 Germany 2007 4.312 4.312 EUR 4.312 4.312 EUR G 21.086 21.086 (Linde, Still, OM, Baoli) 2006 3.909 3.909 EUR 3.909 3.909 EUR G 20.102 20.102 2005 3.484 3.484 EUR 9.501 9.501 EUR G 42.229 19.323 FY = Calendar Year 3 2009 1.526 1.526 EUR 1.677 1.677 EUR V 10.266 10.266 Jungheinrich 2008 1.901 1.901 EUR 2.145 2.145 EUR G 10.784 10.784 Germany 2007 1.804 1.804 EUR 2.001 2.001 EUR G 10.178 10.178 2006 1.582 1.582 EUR 1.748 1.748 EUR G 9.274 9.274 2005 1.497 1.497 EUR 1.645 1.645 EUR G 8.998 8.998 FY = Calendar Year 4 2009/10 1.175 1.584 USD 1.187 1.600 USD G 7.200 7.200 Crown Equipment 2008/09 1.355 1.803 USD 1.368 1.821 USD G 7.436 7.436 Corporation 2007/08 1.146 1.812 USD 1.157 1.830 USD G 8.282 8.282 USA 2006/07 1.239 1.650 USD 1.252 1.668 USD G 8.251 8.251 2005/06 1.193 1.444 USD 1.206 1.460 USD G 7.631 7.631 FY: 1.4. - 31.3. 5 2009 1.024 1.475 USD 1.604 2.311 USD G 8.600 4.500 Nacco Corporation 2008 1.969 2.740 USD 2.644 3.680 USD V 9.500 USA 2007 1.766 2.600 USD 2.447 3.063 USD G 10.600 (Yale, Hyster, Sumitomo) 2006 1.898 2.500 USD 2.543 3.349 USD G 11.300 7.000 2005 1.865 2.200 USD 2.676 3.157 USD G 11.100 7.460 FY = Calendar Year 6 2009 1.007 1.007 EUR 2.581 2.581 EUR G 9.606 3.500 Cargotec 2008 1.516 1.516 EUR 3.399 3.399 EUR G 11.826 4.308 Finland 2007 1.343 1.343 EUR 3.018 3.018 EUR G 11.187 4.233 (Kalmar, Hiab) 2006 1.203 1.203 EUR 2.597 2.597 EUR G 8.026 3.451 2005 1.147 1.147 EUR 2.358 2.358 EUR G 7.571 3.210 FY = Calendar Year 7 2009/10 681 85.758 JPY 23.353 2.940.887 JPY G 33.089 Mitsubishi Heavy Industries 2008/09 1.153 151.239 JPY 25.735 3.375.674 JPY G 33.614 Japan 2007/08 1.345 211.663 JPY 20.354 3.203.085 JPY G 32.552 2.150 (Mitsubishi, Mitsubishi Caterpillar 2006/07 1.253 197.122 JPY 19.505 3.068.505 JPY G 32.627 2.090 Sagamihara Mach. Works, Rocla) 2005/06 1.176 167.527 JPY 19.605 2.792.109 JPY G 33.500 1.919 FY: 1.4. - 31.3. 8 2009 581 581 EUR 684 684 EUR V 2.643 Manitou 2008 1.110 1.110 EUR 1.278 1.278 EUR G 3.319 France 2007 1.088 1.088 EUR 1.260 1.260 EUR G 2.667 2006 984 984 EUR 1.128 1.128 EUR G 2.405 2005 774 774 EUR 985 985 EUR G 2.243 FY = Calendar Year 9 2009/10 551 69.400 JPY 11.368 1.431.564 JPY G 38.518 3.389 Komatsu 2008/09 890 116.713 JPY 15.413 2.021.743 JPY G 39.855 3.618 Japan 2007/08 1.099 178.368 JPY 13.820 2.243.023 JPY G 39.267 3.769 2006/07 851 133.822 JPY 12.035 1.893.343 JPY G 35.666 3.338 2005/06 867 123.521 JPY 11.950 1.701.969 JPY G 34.597 3.103 FY: 1.4. - 31.3. 10 2009/10 476 59.980 JPY 59.694 7.517.277 JPY G 151.698 Nissan Motor Company 2008/09 740 97.066 JPY 64.321 8.436.974 JPY V 155.659 Japan 2007/08 812 127.784 JPY 68.782 10.824.238 JPY G 180.535 (Nissan, Atlet) 2006/07 651 102.415 JPY 66.543 10.468.583 JPY G 186.336 2005/06 633 90.195 JPY 66.201 9.428.292 JPY G 183.356 FY: 1.4. - 31.3. * G (Profit), V (Loss), U (Unknown) WWW.DHf-MagaZine.De
- 2. 8 World Ranking List of Materials Handling Vehicles Rank Manufacturer Year Powered Ind. Truck Sales Total Corporation Sales Profit/ Employees Manufacturer Mio. EUR Mio. Valuta Mio. EUR Mio. Valuta Loss* Tot.Corp. Ind.Trucks 11 2009/10 441 55.520 JPY 523 65.903 JPY V 2.724 2.212 Nippon Yusoki 2008/09 397 52.051 JPY 500 65.606 JPY G 2.229 1.698 (Nichiyu), 2007/08 341 53.650 JPY 435 68.497 JPY G 2.201 1.692 Japan 2006/07 319 50.208 JPY 419 65.870 JPY G 2.092 1.618 2005/06 331 47.090 JPY 435 62.015 JPY G 2.008 1.597 FY: 1.4. - 31.3. 12 2009 319 348.397 KRW 1.598 2.663.000 KRW V 5.500 792 Doosan Infracore 2008 461 847.839 KRW 2.155 3.963.000 KRW V 5.500 750 South Korea 2007 445 613.193 KRW 2.195 3.025.000 KRW V 5.144 620 2006 415 447.521 KRW 2.680 3.282.770 KRW G 5.200 650 2005 379 400.242 KRW 2.377 2.815.256 KRW G 6.450 850 FY = Calendar Year 13 2009/10 317 39.964 JPY 626 78.788 JPY V 2.823 1.741 TCM Corporation 2008/09 646 84.785 JPY 950 124.674 JPY V 2.980 1.770 Japan 2007/08 618 97.329 JPY 858 135.013 JPY G 2.669 1.610 2006/07 526 82.687 JPY 719 113.047 JPY G 2.500 1.510 2005/06 456 65.000 JPY 649 92.373 JPY G 2.253 1.340 FY: 1.4. - 31.3. 14 2009 317 3.115 CNY 378 3.720 CNY U Anhui Heli 2008 317 3.010 CNY 378 3.594 CNY G 4.800 PR China 2007 259 2.787 CNY 312 3.358 CNY G 4.728 2006 244 2.508 CNY G 4.409 2005 184 1.747 CNY 344 3.275 CNY G 5.165 4.094 FY = Calendar Year 15 2009 306 3.005 CNY 410 4.034 CNY G 2.029 2.029 Zhejiang Hangcha 2008 346 3.286 CNY 454 4.315 CNY G 2.500 1.100 PR China 2007 239 2.566 CNY 265 2.848 CNY G 3.000 1.200 2006 180 1.845 CNY 180 1.845 CNY G 1.100 2005 134 1.276 CNY 134 1.276 CNY U FY = Calendar Year 16 2009 281 468.640 KRW 1.187 1.978.693 KRW G 10.500 1.055 Clark 2008 526 967.338 KRW 1.271 2.337.734 KRW G 11.000 706 South Korea 2007 308 425.005 KRW 1.139 1.569.609 KRW G 11.600 1.000 2006 279 341.513 KRW 1.098 1.345.356 KRW G 10.000 650 2005 256 303.212 KRW 1.040 1.231.797 KRW G 10.000 1.000 FY = Calendar Year 17 2009 223 223 EUR 280 280 EUR U 952 642 Merlo 2008 349 349 EUR 395 395 EUR U 980 680 Italy 2007 323 323 EUR 380 380 EUR U 964 657 2006 323 323 EUR 330 330 EUR G 960 2005 274 274 EUR 280 280 EUR G 900 800 FY = Calendar Year 18 2009 115 192.513 KRW 12.683 21.142.197 KRW G 24.475 155 Hyundai Heavy Industries 2008 162 297.756 KRW 10.851 19.957.100 KRW G 25.000 1.200 South Korea 2007 144 198.898 KRW 11.272 15.533.000 KRW G 25.308 2006 117 142.813 KRW 10.250 12.554.744 KRW G 25.398 871 2005 104 123.180 KRW 8.742 10.354.400 KRW G 25.175 871 FY = Calendar Year 19 2009 96 4.431 TWD 156 7.208 TWD G 1.200 Tailift Group 2008 135 6.246 TWD 180 8.328 TWD G 1.700 PR China 2007 130 6.227 TWD 172 8.238 TWD G 1.800 (Artison) 2006 81 3.477 TWD 110 4.722 TWD G 1.150 2005 60 2.340 TWD 72 2.808 TWD G 900 FY = Calendar Year 20 2009 83 83 EUR 1.671 1.671 EUR G 9.782 Konecranes 2008 114 114 EUR 2.103 2.103 EUR G 9.904 Finland 2007 95 95 EUR 1.750 1.750 EUR G 8.404 190 2006 80 80 EUR 1.483 1.483 EUR G 7.549 112 2005 65 65 EUR 971 971 EUR G 5.923 102 FY = Calendar Year * G (Profit), V (Loss), U (Unknown) 12.2010 (SpeciaL pRint)
- 3. World Ranking List of Materials Handling Vehicles 9 Rank Manufacturer Year Powered Ind. Truck Sales Total Corporation Sales Profit/ Employees Manufacturer Mio. EUR Mio. Valuta Mio. EUR Mio. Valuta Loss* Tot.Corp. Ind.Trucks 21 2008/09 74 74 EUR 74 74 EUR G 150 150 Combilift 2007/08 95 95 EUR 95 95 EUR G 190 190 Ireland 2006/07 85 85 EUR 85 85 EUR G 190 190 2005/06 67 67 EUR 67 67 EUR G 160 160 2004/05 53 53 EUR 53 53 EUR G 150 150 FY: 1.9. - 31.8. 22 2009 62 610 CNY 84 826 CNY U EP Equipment 2008 60 570 CNY 80 760 CNY G 900 630 PR China 2007 70 753 CNY 110 1.183 CNY G 850 550 2006 49 504 CNY 80 822 CNY G 670 400 2005 35 333 CNY 56 533 CNY G 520 290 FY = Calendar Year 23 2009 58 58 EUR 72 72 EUR G 447 289 Hubtex 2008 73 73 EUR 92 92 EUR G 520 370 Germany 2007 58 58 EUR 79 79 EUR G 500 370 2006 41 41 EUR 71 71 EUR G 470 230 2005 40 40 EUR 40 40 EUR G 240 240 FY = Calendar Year 24 2008/09 57 582 SEK 63 644 SEK G 247 216 Svetruck 2007/08 56 529 SEK 62 585 SEK G 233 208 Sweden 2006/07 56 525 SEK 62 581 SEK G 243 211 2005/06 53 491 SEK 60 556 SEK G 240 210 2004/05 48 451 SEK 55 515 SEK G 243 212 FY: 1.9. - 31.8. 25 2009 56 548 CNY 56 548 CNY G 1.020 1.020 Dalian Forklift 2008 74 705 CNY 74 705 CNY G 839 839 PR China 2007 72 776 CNY 72 776 CNY U 856 856 2006 74 761 CNY 74 761 CNY U 881 881 2005 65 623 CNY 65 623 CNY U 891 891 FY = Calendar Year 26 2009/10 36 2.179 INR 721 43.622 INR G 12.654 849 Godrej & Boyce 2008/09 35 2.418 INR 586 40.351 INR G 11.675 745 India 2007/08 35 2.200 INR 551 34.711 INR G 11.345 887 2006/07 33 1.921 INR 355 26.615 INR G 9.865 687 2005/06 28 1.483 INR 373 20.054 INR G 8.583 668 FY: 1.4. - 31.3. 27 2009 21 159 DKK 21 159 DKK V 125 125 DanTruck-Heden 2008 45 332 DKK 45 332 DKK U 182 182 Denmark 2007 42 313 DKK 42 313 DKK G 173 173 2006 38 284 DKK 38 284 DKK V 169 169 2005 40 300 DKK 40 300 DKK U 184 184 FY = Calendar Year 28 2009 20 20 EUR 23 23 EUR U 125 102 OMG 2008 29 29 EUR 32 32 EUR U 137 112 Italy 2007 33 33 EUR 36 36 EUR G 137 123 2006 29 29 EUR 31 31 EUR G 135 120 2005 22 22 EUR 24 24 EUR G 122 110 FY = Calendar Year 29 2009 19 28 CHF 82 122 CHF G 504 59 Stöcklin 2008 23 35 CHF 90 134 CHF G 520 63 Switzerland 2007 21 34 CHF 85 141 CHF G 511 60 2006 18 29 CHF 73 118 CHF G 520 70 2005 17 26 CHF 95 148 CHF G 520 70 FY = Calendar Year 30 2009 17 17 EUR 46 46 EUR U Ausa 2008 35 35 EUR 93 93 EUR G 276 Spain 2007 46 46 EUR 150 150 EUR G 442 2006 37 37 EUR 119 119 EUR G 460 2005 28 28 EUR 99 99 EUR G 328 FY = Calendar Year * G (Profit), V (Loss), U (Unknown) WWW.DHf-MagaZine.De
- 4. 10 World Ranking List of Materials Handling Vehicles Rank Manufacturer Year Powered Ind. Truck Sales Total Corporation Sales Profit/ Employees Manufacturer Mio. EUR Mio. Valuta Mio. EUR Mio. Valuta Loss* Tot.Corp. Ind.Trucks 31 2009 17 17 EUR 186 186 EUR V 857 100 Pramac 2008 30 30 EUR 234 234 EUR G 793 116 Italy 2007 35 35 EUR 230 230 EUR G 731 140 2006 31 31 EUR 184 184 EUR G 764 140 2005 31 31 EUR 157 157 EUR U 675 135 FY = Calendar Year 32 2009 14 14 EUR 14 14 EUR U 67 67 Sichelschmidt 2008 15 15 EUR 15 15 EUR U 67 67 Germany 2007 15 15 EUR 15 15 EUR U 67 67 2006 15 15 EUR 15 15 EUR U 65 65 2005 15 15 EUR 15 15 EUR U 50 50 FY = Calendar Year 33 2009 12 12 EUR 38 38 EUR G 155 40 Dambach 2008 14 14 EUR 38 38 EUR G 160 50 Germany 2007 13 13 EUR 35 35 EUR G 163 50 2006 13 13 EUR 31 31 EUR G 160 62 2005 12 12 EUR 131 131 EUR G 895 68 FY = Calendar Year 34 2009 10 10 EUR 13 13 EUR G 90 90 Miag 2008 13 13 EUR 13 13 EUR U 90 90 Germany 2007 14 14 EUR 14 14 EUR G 90 90 2006 13 13 EUR 13 13 EUR G 90 90 2005 13 13 EUR 13 13 EUR G 90 90 FY = Calendar Year 35 2009 10 10 EUR 10 10 EUR G 60 60 Magaziner 2008 15 15 EUR 15 15 EUR G 65 65 Germany 2007 15 15 EUR 15 15 EUR G 65 65 2006 14 14 EUR 14 14 EUR G 60 60 2005 13 13 EUR 13 13 EUR G 55 55 FY = Calendar Year 36 2009 10 10 EUR 11 11 EUR U Nuova Detas 2008 16 16 EUR 18 18 EUR U 41 36 Italy 2007 17 17 EUR 20 20 EUR U 45 39 2006 18 18 EUR 18 18 EUR G 39 39 2005 15 15 EUR 15 15 EUR G 39 39 FY = Calendar Year * G (Profit), V (Loss), U (Unknown) Conversion Table for the World Ranking List 2009/2010 Average exchange rates of the European Central Bank based on 1 EUR, to the end of each fiscal year Country Denmark India Japan Sweden Switzerland South Korea Taiwan USA PR China Year DKK INR JPY SEK CHF KRW TWD USD CNY 2009 7,442 60,514 125,930 10,219100 1,484 1666,970 46,204 1,440600 1) 9,835 1,347900 2) 2008 7,451 68,910 131,170 9,438100 1,485 1839,130 46,267 1,391700 9,496 1,330800 2007 7,458 63,042 157,370 9,366200 1,655 1377,960 47,897 1,472100 10,752 1,581200 2006 7,456 58,034 157,320 9,266700 1,607 1224,810 42,927 1,317000 10,279 9,040400 1,331800 2005 7,461 53,694 142,420 9,340100 1,555 1184,420 39,003 1,179700 9,520 9,388500 1,210400 1) 31.12.2009 2) 31.03.2010 12.2010 (SpeciaL pRint)