SlideShare a Scribd company logo
1 of 1
Library Analytics Toolkit | Harvard Library Lab
Carli Spina
The Project                     The colorful bar at
                                the top of the page
                                                                                                          This slider zooms
                                                                                                          in on data to see
                                                                                                                                       Next Steps
The original goal of this                                                                                                              Now that we have completed the initial
                                allows users to navigate                                                  deeper level trends
project was to create a                                                                                                                phase of the Explorer, we hope to continue to
                                between subject areas                                                     within subject areas.
standalone interactive          by clicking on the                                                        The search box also
                                                                                                                                       expand on this work by adding:
analytics dashboard that        corresponding color.                                                      lets users search            •	 E-resource usage data: In our
would provide detailed          This will then zoom in                                                    for specific subject         discussions we found this to be one of the
and real-time information       to offer more details                                                     headings to dive             most sought after types of library data
about library usage             about the narrow subject                                                  immediately to the
events. After researching       area selected. The Key                                                    data they need. At           •	 Expenditure information by
the types of analytics          shows the color for each                                                  each level, opacity          subject: To help collection development
needed by Harvard               subject.                                                                  of the colors shows          staff in their work with the collection, we
libraries, it was decided                                                                                 circulation levels.          hope to add a financial component to this
that the initial phase of the                                                                                                          dashboard
project would focus on           This graph provides                                                                                   •	 Other library usage metrics:
collection and circulation       an overview of how
                                                                                                                                       Once the intial collection development
statistics to facilitate         the total number of                                                      This bar graph shows
                                                                                                          total circulation for each   component is fully developed, we hope
collection development           items in a subject area
                                 has changed since                                                        year since the second        to add components to track reference,
decisions. This led to the
                                 2000. Clicking on a                                                      half of 2002, allowing       instruction, physical location, and other
Harvard Library Explorer.                                                                                 users to see changes         library metrics within a single, real-time,
                                 line zooms in on that
                                 subject.                                                                 over time at a glance.       online dashboard


               Find Out More:                                               Acknowledgments:
                                                                            This project would not have been possible without funding from the Harvard Library Lab. We would
               Try it yourself: http://librarylab.law.harvard.edu/toolkit   also like to thank Rosten W00 and Sha Hwang for their data visualization and web development work.
               or watch a demonstration: http://youtu.be/Tz1M0c4iH1I        The Library Anayltics Toolkit team also includes Kim Dulin, Jeff Goldenson and Paul Deschner.

More Related Content

Viewers also liked

Thirst
ThirstThirst
Thirstzeting
 
Cronicile scolii 27, nr 7
Cronicile scolii 27, nr 7Cronicile scolii 27, nr 7
Cronicile scolii 27, nr 7econsiliere
 
тиждень англійської мови
тиждень англійської мовитиждень англійської мови
тиждень англійської мовиkoblevoschool1
 
Тиждень зарубіжної літератури
Тиждень зарубіжної  літературиТиждень зарубіжної  літератури
Тиждень зарубіжної літературиkoblevoschool1
 

Viewers also liked (6)

Lotniska
LotniskaLotniska
Lotniska
 
Thirst
ThirstThirst
Thirst
 
Pe wiki
Pe wikiPe wiki
Pe wiki
 
Cronicile scolii 27, nr 7
Cronicile scolii 27, nr 7Cronicile scolii 27, nr 7
Cronicile scolii 27, nr 7
 
тиждень англійської мови
тиждень англійської мовитиждень англійської мови
тиждень англійської мови
 
Тиждень зарубіжної літератури
Тиждень зарубіжної  літературиТиждень зарубіжної  літератури
Тиждень зарубіжної літератури
 

Similar to Library Analytics Toolkit Poster

Web-Scale Discovery: Post Implementation
Web-Scale Discovery: Post ImplementationWeb-Scale Discovery: Post Implementation
Web-Scale Discovery: Post ImplementationRachel Vacek
 
Open Data Learning Summit: Storytelling with Data - Visual Analytics and Libr...
Open Data Learning Summit: Storytelling with Data - Visual Analytics and Libr...Open Data Learning Summit: Storytelling with Data - Visual Analytics and Libr...
Open Data Learning Summit: Storytelling with Data - Visual Analytics and Libr...dwestbrook
 
Bandits and Browsing: Effective Collection Size as Way of Quantifying Search...
Bandits and Browsing:  Effective Collection Size as Way of Quantifying Search...Bandits and Browsing:  Effective Collection Size as Way of Quantifying Search...
Bandits and Browsing: Effective Collection Size as Way of Quantifying Search...Harriett Green
 
Corrall & Dove - Web scale discovery and information literacy: competing visi...
Corrall & Dove - Web scale discovery and information literacy: competing visi...Corrall & Dove - Web scale discovery and information literacy: competing visi...
Corrall & Dove - Web scale discovery and information literacy: competing visi...IL Group (CILIP Information Literacy Group)
 
8 Information Architecture Better Practices
8 Information Architecture Better Practices8 Information Architecture Better Practices
8 Information Architecture Better PracticesLouis Rosenfeld
 
ArchivesSpace: Building a Next-Generation Archives Management Tool
ArchivesSpace: Building a Next-Generation Archives Management ToolArchivesSpace: Building a Next-Generation Archives Management Tool
ArchivesSpace: Building a Next-Generation Archives Management ToolMark Matienzo
 
Outcomes Visual Navigation Project
Outcomes Visual Navigation ProjectOutcomes Visual Navigation Project
Outcomes Visual Navigation ProjectTimelessFuture
 
Maia report
Maia report Maia report
Maia report shekchuen
 
Challenges and opportunities in library discovery services gen
Challenges and opportunities in library discovery services genChallenges and opportunities in library discovery services gen
Challenges and opportunities in library discovery services genrobin fay
 
UX Information Architecture Design, Sharon Public Library
UX Information Architecture Design, Sharon Public LibraryUX Information Architecture Design, Sharon Public Library
UX Information Architecture Design, Sharon Public LibrarySeth Sparks
 
Introducing the Open Discovery Initiative
Introducing the Open Discovery InitiativeIntroducing the Open Discovery Initiative
Introducing the Open Discovery InitiativeNASIG
 
Sakai 3, Architectural Choices and Community Impact
Sakai 3, Architectural Choices and Community ImpactSakai 3, Architectural Choices and Community Impact
Sakai 3, Architectural Choices and Community ImpactAuSakai
 
Gephi icwsm-tutorial
Gephi icwsm-tutorialGephi icwsm-tutorial
Gephi icwsm-tutorialcsedays
 
AMIA 2013 - Open Research Networking Gadgets (ORNG)
AMIA 2013 - Open Research Networking Gadgets (ORNG)AMIA 2013 - Open Research Networking Gadgets (ORNG)
AMIA 2013 - Open Research Networking Gadgets (ORNG)CTSI at UCSF
 
ORNG Presentation, AMIA 2013
ORNG Presentation, AMIA 2013ORNG Presentation, AMIA 2013
ORNG Presentation, AMIA 2013ericmeeks
 
Generating domain specific sentiment lexicons using the Web Directory
Generating domain specific sentiment lexicons using the Web Directory Generating domain specific sentiment lexicons using the Web Directory
Generating domain specific sentiment lexicons using the Web Directory acijjournal
 

Similar to Library Analytics Toolkit Poster (20)

Web-Scale Discovery: Post Implementation
Web-Scale Discovery: Post ImplementationWeb-Scale Discovery: Post Implementation
Web-Scale Discovery: Post Implementation
 
Open Data Learning Summit: Storytelling with Data - Visual Analytics and Libr...
Open Data Learning Summit: Storytelling with Data - Visual Analytics and Libr...Open Data Learning Summit: Storytelling with Data - Visual Analytics and Libr...
Open Data Learning Summit: Storytelling with Data - Visual Analytics and Libr...
 
Bandits and Browsing: Effective Collection Size as Way of Quantifying Search...
Bandits and Browsing:  Effective Collection Size as Way of Quantifying Search...Bandits and Browsing:  Effective Collection Size as Way of Quantifying Search...
Bandits and Browsing: Effective Collection Size as Way of Quantifying Search...
 
Corrall & Dove - Web scale discovery and information literacy: competing visi...
Corrall & Dove - Web scale discovery and information literacy: competing visi...Corrall & Dove - Web scale discovery and information literacy: competing visi...
Corrall & Dove - Web scale discovery and information literacy: competing visi...
 
8 Information Architecture Better Practices
8 Information Architecture Better Practices8 Information Architecture Better Practices
8 Information Architecture Better Practices
 
ArchivesSpace: Building a Next-Generation Archives Management Tool
ArchivesSpace: Building a Next-Generation Archives Management ToolArchivesSpace: Building a Next-Generation Archives Management Tool
ArchivesSpace: Building a Next-Generation Archives Management Tool
 
EDS for JIBS
EDS for JIBSEDS for JIBS
EDS for JIBS
 
Outcomes Visual Navigation Project
Outcomes Visual Navigation ProjectOutcomes Visual Navigation Project
Outcomes Visual Navigation Project
 
Maia report
Maia report Maia report
Maia report
 
Challenges and opportunities in library discovery services gen
Challenges and opportunities in library discovery services genChallenges and opportunities in library discovery services gen
Challenges and opportunities in library discovery services gen
 
UX Information Architecture Design, Sharon Public Library
UX Information Architecture Design, Sharon Public LibraryUX Information Architecture Design, Sharon Public Library
UX Information Architecture Design, Sharon Public Library
 
Introducing the Open Discovery Initiative
Introducing the Open Discovery InitiativeIntroducing the Open Discovery Initiative
Introducing the Open Discovery Initiative
 
Benoit Visual Only Retrieval
Benoit Visual Only RetrievalBenoit Visual Only Retrieval
Benoit Visual Only Retrieval
 
Sakai 3, Architectural Choices and Community Impact
Sakai 3, Architectural Choices and Community ImpactSakai 3, Architectural Choices and Community Impact
Sakai 3, Architectural Choices and Community Impact
 
Osrepository
OsrepositoryOsrepository
Osrepository
 
Gephi icwsm-tutorial
Gephi icwsm-tutorialGephi icwsm-tutorial
Gephi icwsm-tutorial
 
AMIA 2013 - Open Research Networking Gadgets (ORNG)
AMIA 2013 - Open Research Networking Gadgets (ORNG)AMIA 2013 - Open Research Networking Gadgets (ORNG)
AMIA 2013 - Open Research Networking Gadgets (ORNG)
 
ORNG Presentation, AMIA 2013
ORNG Presentation, AMIA 2013ORNG Presentation, AMIA 2013
ORNG Presentation, AMIA 2013
 
Generating domain specific sentiment lexicons using the Web Directory
Generating domain specific sentiment lexicons using the Web Directory Generating domain specific sentiment lexicons using the Web Directory
Generating domain specific sentiment lexicons using the Web Directory
 
3 - Discovery-systems
3  - Discovery-systems3  - Discovery-systems
3 - Discovery-systems
 

More from Carli Spina

Best Practices for Web Accessibility
Best Practices for Web AccessibilityBest Practices for Web Accessibility
Best Practices for Web AccessibilityCarli Spina
 
Creative Commons Crash Course
Creative Commons Crash CourseCreative Commons Crash Course
Creative Commons Crash CourseCarli Spina
 
What You Need To Know Before Gamifying Your Library
What You Need To Know Before Gamifying Your Library What You Need To Know Before Gamifying Your Library
What You Need To Know Before Gamifying Your Library Carli Spina
 
Library Analytics Toolkit
Library Analytics ToolkitLibrary Analytics Toolkit
Library Analytics ToolkitCarli Spina
 
Tools For Mobile Web Design and App Creation
Tools For Mobile Web Design and App CreationTools For Mobile Web Design and App Creation
Tools For Mobile Web Design and App CreationCarli Spina
 
Scanning the Future: QR Codes in Law Libraries
Scanning the Future: QR Codes in Law LibrariesScanning the Future: QR Codes in Law Libraries
Scanning the Future: QR Codes in Law LibrariesCarli Spina
 
Getting Started with Mobile Websites if You Don't Know Code
Getting Started with Mobile Websites if You Don't Know CodeGetting Started with Mobile Websites if You Don't Know Code
Getting Started with Mobile Websites if You Don't Know CodeCarli Spina
 
NEASIS&T Going Mobile Slides
NEASIS&T Going Mobile SlidesNEASIS&T Going Mobile Slides
NEASIS&T Going Mobile SlidesCarli Spina
 
Library Analytics Toolkit
Library Analytics ToolkitLibrary Analytics Toolkit
Library Analytics ToolkitCarli Spina
 

More from Carli Spina (9)

Best Practices for Web Accessibility
Best Practices for Web AccessibilityBest Practices for Web Accessibility
Best Practices for Web Accessibility
 
Creative Commons Crash Course
Creative Commons Crash CourseCreative Commons Crash Course
Creative Commons Crash Course
 
What You Need To Know Before Gamifying Your Library
What You Need To Know Before Gamifying Your Library What You Need To Know Before Gamifying Your Library
What You Need To Know Before Gamifying Your Library
 
Library Analytics Toolkit
Library Analytics ToolkitLibrary Analytics Toolkit
Library Analytics Toolkit
 
Tools For Mobile Web Design and App Creation
Tools For Mobile Web Design and App CreationTools For Mobile Web Design and App Creation
Tools For Mobile Web Design and App Creation
 
Scanning the Future: QR Codes in Law Libraries
Scanning the Future: QR Codes in Law LibrariesScanning the Future: QR Codes in Law Libraries
Scanning the Future: QR Codes in Law Libraries
 
Getting Started with Mobile Websites if You Don't Know Code
Getting Started with Mobile Websites if You Don't Know CodeGetting Started with Mobile Websites if You Don't Know Code
Getting Started with Mobile Websites if You Don't Know Code
 
NEASIS&T Going Mobile Slides
NEASIS&T Going Mobile SlidesNEASIS&T Going Mobile Slides
NEASIS&T Going Mobile Slides
 
Library Analytics Toolkit
Library Analytics ToolkitLibrary Analytics Toolkit
Library Analytics Toolkit
 

Library Analytics Toolkit Poster

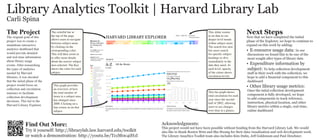
  • 1. Library Analytics Toolkit | Harvard Library Lab Carli Spina The Project The colorful bar at the top of the page This slider zooms in on data to see Next Steps The original goal of this Now that we have completed the initial allows users to navigate deeper level trends project was to create a phase of the Explorer, we hope to continue to between subject areas within subject areas. standalone interactive by clicking on the The search box also expand on this work by adding: analytics dashboard that corresponding color. lets users search • E-resource usage data: In our would provide detailed This will then zoom in for specific subject discussions we found this to be one of the and real-time information to offer more details headings to dive most sought after types of library data about library usage about the narrow subject immediately to the events. After researching area selected. The Key data they need. At • Expenditure information by the types of analytics shows the color for each each level, opacity subject: To help collection development needed by Harvard subject. of the colors shows staff in their work with the collection, we libraries, it was decided circulation levels. hope to add a financial component to this that the initial phase of the dashboard project would focus on This graph provides • Other library usage metrics: collection and circulation an overview of how Once the intial collection development statistics to facilitate the total number of This bar graph shows total circulation for each component is fully developed, we hope collection development items in a subject area has changed since year since the second to add components to track reference, decisions. This led to the 2000. Clicking on a half of 2002, allowing instruction, physical location, and other Harvard Library Explorer. users to see changes library metrics within a single, real-time, line zooms in on that subject. over time at a glance. online dashboard Find Out More: Acknowledgments: This project would not have been possible without funding from the Harvard Library Lab. We would Try it yourself: http://librarylab.law.harvard.edu/toolkit also like to thank Rosten W00 and Sha Hwang for their data visualization and web development work. or watch a demonstration: http://youtu.be/Tz1M0c4iH1I The Library Anayltics Toolkit team also includes Kim Dulin, Jeff Goldenson and Paul Deschner.