SlideShare ist ein Scribd-Unternehmen logo
1 von 3
Downloaden Sie, um offline zu lesen
Population: 10 million
                        HAITI                                                                                                  Area: 27,750 sq km (10,714 sq miles)


                                                                   MAIN ECONOMIC INDICATORS
                                                            2000         2001        2002                   2003     2004    2005     2006         2007      2008     2009    2010
              GDP ($US, billions)                            23.7        24.6        22.3                   20.2     21.6    33.6     35.3         41.0       45.6    46.7    50.1

               GDP (% change)                                5.7          1.8         5.8                   -0.3      1.3     9.3     10.7          8.5       5.3      3.5     3.5

           GDP per capita ($US)                             2,982        3,053      2,728                   2,437    2,568   3,934    4,081        4,668     5,117    5,176   5,464

Current account balance ($US, billions)                     -1.01        -0.74       -0.71                  1.03     1.04    -0.47    -1.28        -2.17     -4.51    -2.34   -3.06

    Current account balance (% of GDP)                       -4.3        -3.0        -3.2                    5.1      4.8     -1.4    -3.6         -5.3       -9.9    -5.0    -6.1

            Inflation (% change)                             7.7          8.9         5.2                   27.5     51.5     4.2      7.6          6.1       10.6     1.5     6.5

           Unemployment+ (%)                                   -           -           -                      -        -       -        -            -         -        -       -

                       GDP (% change)            Inflation (% change)                                                         GDP           Current account balance

                                                                                                             7.00
      26                                                                                                     6.00
      21                                                                                                     5.00
      16                                                                                                     4.00

                                                                                             $US Billions
%     11                                                                                                     3.00
       6                                                                                                     2.00

       1                                                                                                     1.00

      -4   2000 2001 2002 2003 2004 2005 2006 2007 2008 2009 2010                                            0.00
                                                                                                                    2000 2001 2002 2003 2004 2005 2006 2007 2008 2009 2010
      -9                                                                                                    -1.00
                                                                    Source: IMF World Economic Outlook April 2010
+
 Source: The World Bank - http://databank.worldbank.org
*Numbers in italics represent estimates
Population: 10 million
                       HAITI                                                                                               Area: 27,750 sq km (10,714 sq miles)


                                                       MAIN TRADE INDICATORS – GOODS
                                                                                       2005                        2006                  2007                       2008
             Trade Balance ($US thousands)                                        -701,318                    -1,261,525               -1,215,666                 -1,664,673
          Total Exported Value ($US thousands)                                      525,069                     641,639                 672,730                    657,304
          Total Imported Value ($US thousands)                                   1,226,387                     1,903,164               1,888,396                  2,321,977

             Top 10 Markets by % of Total Exported Value (2009)                                           Top 10 Markets by % of Total Imported Value (2009)

 United States of America                                                     87%             United States of America                                                  38%
                   Canada        3%                                                                Dominican Republic                                       31%
                   Mexico        2%                                                                               China           7%
      Dominican Republic         2%                                                                          Colombia        3%
                    France      1%                                                                                Japan      2%
         United Kingdom         1%                                                                            Malaysia      2%
                  Belgium       1%                                                                               France     2%
                 Germany        1%                                                                              Canada      2%
           Chinese Taipei       1%                                                                                Brazil   2%
                     China      0.4%                                                                            Mexico     1%

  Edible fruit, Top 5 Exports by % of Total Exported Value (2008) Essential oils,                          Top 5 Imports by % of Total Imported Value (2008)               Vehicles
 nuts, peel of                                                      perfumes,                                                                                            other than
citrus, melons,                                                     cosmetics,                                                                                             railway,
      2%                                                          toileteries, 3%                                                                                       tramway, 6%

                                                                           Iron and                                                                 Animal,vegetabl
                                                                           steel, 7%                                        Cereals,                 e fats and oils,
                                                          Articles of                                                                                      6%
                                                                                                                             13%
                                                         apparel (not
                                                       knit or crochet),
                                                             18%
                Articles of                                                                                                               Cotton,
             apparel (knit or                                                                                                              10%
              crochet), 60%                                                                        Commodities
                                                                                                  not elsewhere
                                                                                                  specified, 11%

                                                          Source: International Trade Centre – www.trademap.org
Population: 10 million
                      HAITI                                                                                       Area: 27,750 sq km (10,714 sq miles)


                                                   MAIN TRADE INDICATORS – SERVICES
                                                    2004                    2005                       2006                     2007                      2008
   Trade Balance ($US thousands)                   -209,950               -398,910                   -399,430                 -416,650                   -326,739
Total Exported Value ($US thousands)               141,600                 145,460                    193,930                  257,110                   204,318
Total Imported Value ($US thousands)               351,550                 544,370                    593,360                  673,760                   531,057

                                                                                                  Top Imports by % of Total Imported Value (2007)
               Top Exports by % of Total Exported Value (2007)

                                                                                               Transportation                                            59%

                   Travel                                                75%           Other business services                     27%


                                                                                                        Travel           8%


     Government services                21%                                              Government services        3%


                                                                                     Communications services       2%


                                                                                             Financial services    1%
  Communications services    4%

                                                                                     Royalties and license fees   0.1%


                                                       Source: International Trade Centre – www.trademap.org

Weitere ähnliche Inhalte

Was ist angesagt?

045 Presentacion%20 Colombia%20 December%202009%20(Ingles)
045 Presentacion%20 Colombia%20 December%202009%20(Ingles)045 Presentacion%20 Colombia%20 December%202009%20(Ingles)
045 Presentacion%20 Colombia%20 December%202009%20(Ingles)amigueldiaz
 
Presentation jbs fixed income
Presentation jbs fixed incomePresentation jbs fixed income
Presentation jbs fixed incomeJBS RI
 
Roberto Coronado, Outlook for the El Paso-Juarez Region, Federal Reserve Bank...
Roberto Coronado, Outlook for the El Paso-Juarez Region, Federal Reserve Bank...Roberto Coronado, Outlook for the El Paso-Juarez Region, Federal Reserve Bank...
Roberto Coronado, Outlook for the El Paso-Juarez Region, Federal Reserve Bank...The Paso del Norte Group
 
Moz public invst-agriculture
Moz public invst-agricultureMoz public invst-agriculture
Moz public invst-agricultureIFPRI-Maputo
 
Lesson 8 presentation
Lesson 8 presentationLesson 8 presentation
Lesson 8 presentationrhernande128
 
Google student survey p4
Google student survey p4Google student survey p4
Google student survey p4liana1995
 
terex Jefferies081308
terex Jefferies081308terex Jefferies081308
terex Jefferies081308finance42
 
Statistical profile
Statistical profileStatistical profile
Statistical profilecarrieriddle
 
terex KeyBanc060508
terex KeyBanc060508terex KeyBanc060508
terex KeyBanc060508finance42
 
09 11 10 Web 2.0 Weekly
09 11 10 Web 2.0 Weekly09 11 10 Web 2.0 Weekly
09 11 10 Web 2.0 WeeklyDavid Shore
 
Tses Plass Presentation
Tses Plass PresentationTses Plass Presentation
Tses Plass PresentationSimon Kapenda
 

Was ist angesagt? (17)

Trinidad & Tobago - Trade Profile [UWI's Shridath Ramphal Centre]
Trinidad & Tobago - Trade Profile [UWI's Shridath Ramphal Centre]Trinidad & Tobago - Trade Profile [UWI's Shridath Ramphal Centre]
Trinidad & Tobago - Trade Profile [UWI's Shridath Ramphal Centre]
 
St. Kitts & Nevis - Trade Profile [UWI's Shridath Ramphal Centre]
St. Kitts & Nevis -  Trade Profile [UWI's Shridath Ramphal Centre]St. Kitts & Nevis -  Trade Profile [UWI's Shridath Ramphal Centre]
St. Kitts & Nevis - Trade Profile [UWI's Shridath Ramphal Centre]
 
St. Lucia - Trade Profile [UWI's Shridath Ramphal Centre]
St. Lucia - Trade Profile [UWI's Shridath Ramphal Centre]St. Lucia - Trade Profile [UWI's Shridath Ramphal Centre]
St. Lucia - Trade Profile [UWI's Shridath Ramphal Centre]
 
Jamaica - Trade Profile [UWI's Shridath Ramphal Centre]
Jamaica -  Trade Profile [UWI's Shridath Ramphal Centre]Jamaica -  Trade Profile [UWI's Shridath Ramphal Centre]
Jamaica - Trade Profile [UWI's Shridath Ramphal Centre]
 
Suriname - Trade Profile [UWI's Shridath Ramphal Centre]
Suriname -  Trade Profile [UWI's Shridath Ramphal Centre]Suriname -  Trade Profile [UWI's Shridath Ramphal Centre]
Suriname - Trade Profile [UWI's Shridath Ramphal Centre]
 
045 Presentacion%20 Colombia%20 December%202009%20(Ingles)
045 Presentacion%20 Colombia%20 December%202009%20(Ingles)045 Presentacion%20 Colombia%20 December%202009%20(Ingles)
045 Presentacion%20 Colombia%20 December%202009%20(Ingles)
 
Presentation jbs fixed income
Presentation jbs fixed incomePresentation jbs fixed income
Presentation jbs fixed income
 
Roberto Coronado, Outlook for the El Paso-Juarez Region, Federal Reserve Bank...
Roberto Coronado, Outlook for the El Paso-Juarez Region, Federal Reserve Bank...Roberto Coronado, Outlook for the El Paso-Juarez Region, Federal Reserve Bank...
Roberto Coronado, Outlook for the El Paso-Juarez Region, Federal Reserve Bank...
 
Moz public invst-agriculture
Moz public invst-agricultureMoz public invst-agriculture
Moz public invst-agriculture
 
Lesson 8 presentation
Lesson 8 presentationLesson 8 presentation
Lesson 8 presentation
 
Cliff Brewis Outlook 2012
Cliff Brewis Outlook 2012Cliff Brewis Outlook 2012
Cliff Brewis Outlook 2012
 
Google student survey p4
Google student survey p4Google student survey p4
Google student survey p4
 
terex Jefferies081308
terex Jefferies081308terex Jefferies081308
terex Jefferies081308
 
Statistical profile
Statistical profileStatistical profile
Statistical profile
 
terex KeyBanc060508
terex KeyBanc060508terex KeyBanc060508
terex KeyBanc060508
 
09 11 10 Web 2.0 Weekly
09 11 10 Web 2.0 Weekly09 11 10 Web 2.0 Weekly
09 11 10 Web 2.0 Weekly
 
Tses Plass Presentation
Tses Plass PresentationTses Plass Presentation
Tses Plass Presentation
 

Andere mochten auch

Andere mochten auch (9)

推广工作介绍
推广工作介绍推广工作介绍
推广工作介绍
 
Fashion
FashionFashion
Fashion
 
Catalogo2 junio
Catalogo2 junioCatalogo2 junio
Catalogo2 junio
 
Jamaica's Country Economic Memorandum - Unlocking Growth [World Bank]
Jamaica's Country Economic Memorandum - Unlocking Growth [World Bank]Jamaica's Country Economic Memorandum - Unlocking Growth [World Bank]
Jamaica's Country Economic Memorandum - Unlocking Growth [World Bank]
 
Jtc200 worm gear screw lifter,20000kg rotating screw jack,20ton travelling nu...
Jtc200 worm gear screw lifter,20000kg rotating screw jack,20ton travelling nu...Jtc200 worm gear screw lifter,20000kg rotating screw jack,20ton travelling nu...
Jtc200 worm gear screw lifter,20000kg rotating screw jack,20ton travelling nu...
 
Jtc10 worm gear screw lifter,1t self locking worm gear jack,1 ton worm drive ...
Jtc10 worm gear screw lifter,1t self locking worm gear jack,1 ton worm drive ...Jtc10 worm gear screw lifter,1t self locking worm gear jack,1 ton worm drive ...
Jtc10 worm gear screw lifter,1t self locking worm gear jack,1 ton worm drive ...
 
Caribbean Export - CARICOM-Canada Trade Development Forum
Caribbean Export - CARICOM-Canada Trade Development ForumCaribbean Export - CARICOM-Canada Trade Development Forum
Caribbean Export - CARICOM-Canada Trade Development Forum
 
Catalogo3 junio
Catalogo3 junioCatalogo3 junio
Catalogo3 junio
 
Percentage of Imports From the EU Liberalized by Each CARIFORUM Member State ...
Percentage of Imports From the EU Liberalized by Each CARIFORUM Member State ...Percentage of Imports From the EU Liberalized by Each CARIFORUM Member State ...
Percentage of Imports From the EU Liberalized by Each CARIFORUM Member State ...
 

Ähnlich wie Haiti - Trade Profile [UWI's Shridath Ramphal Centre]

Economy of USA- An Current overview
Economy of USA- An Current overviewEconomy of USA- An Current overview
Economy of USA- An Current overviewRaj Kumar Singh
 
arnings Release 2Q07 Presentation
arnings Release 2Q07 Presentationarnings Release 2Q07 Presentation
arnings Release 2Q07 PresentationProfarma
 
Earnings Release 2 Q07
Earnings Release 2 Q07Earnings Release 2 Q07
Earnings Release 2 Q07Profarma
 
Profarma 4 q11
Profarma 4 q11Profarma 4 q11
Profarma 4 q11Profarma
 
Sectoral Economic Development Strategy
Sectoral Economic Development StrategySectoral Economic Development Strategy
Sectoral Economic Development Strategyedunetwork
 
100804 apresentação de resultados 2 t10-inglês_sem script [modo de compatib...
100804   apresentação de resultados 2 t10-inglês_sem script [modo de compatib...100804   apresentação de resultados 2 t10-inglês_sem script [modo de compatib...
100804 apresentação de resultados 2 t10-inglês_sem script [modo de compatib...Multiplus
 
2005 - 5th Us Analyst And Investor Meeting Financials
2005 - 5th Us Analyst And Investor Meeting   Financials2005 - 5th Us Analyst And Investor Meeting   Financials
2005 - 5th Us Analyst And Investor Meeting FinancialsEmbraer RI
 
Boyuan Construction Investor Presentation
Boyuan Construction Investor PresentationBoyuan Construction Investor Presentation
Boyuan Construction Investor PresentationTMX Equicom
 
[Gleap] Agribank Report
[Gleap] Agribank Report[Gleap] Agribank Report
[Gleap] Agribank ReportKhiem Duong
 
2010 City Of Bethlehem Finance And Budget Presentation
2010 City Of Bethlehem Finance And Budget Presentation2010 City Of Bethlehem Finance And Budget Presentation
2010 City Of Bethlehem Finance And Budget PresentationNachman Shelef
 
oe E. Harlan Executive Vice President, Electro and Communications Business
oe E. Harlan Executive Vice President, Electro and Communications Businessoe E. Harlan Executive Vice President, Electro and Communications Business
oe E. Harlan Executive Vice President, Electro and Communications Businessfinance10
 
Profarma 4Q10
Profarma 4Q10Profarma 4Q10
Profarma 4Q10Profarma
 
Profarma 4Q10
Profarma 4Q10Profarma 4Q10
Profarma 4Q10Profarma
 
brunswick annual reports 2006
brunswick annual reports 2006brunswick annual reports 2006
brunswick annual reports 2006finance36
 
Us economic outlook micky levy, chief economist - bank of america 25 januar...
Us economic outlook   micky levy, chief economist - bank of america 25 januar...Us economic outlook   micky levy, chief economist - bank of america 25 januar...
Us economic outlook micky levy, chief economist - bank of america 25 januar...Jessica Roch
 
1ª conferência - James S Henry
1ª conferência - James S Henry 1ª conferência - James S Henry
1ª conferência - James S Henry CIEF2012
 
Perú ProinversióN
Perú ProinversióNPerú ProinversióN
Perú ProinversióNLuis
 
Profarma apresentação 2 q11
Profarma apresentação 2 q11Profarma apresentação 2 q11
Profarma apresentação 2 q11Profarma
 

Ähnlich wie Haiti - Trade Profile [UWI's Shridath Ramphal Centre] (20)

Economy of USA- An Current overview
Economy of USA- An Current overviewEconomy of USA- An Current overview
Economy of USA- An Current overview
 
Israel Economy
Israel EconomyIsrael Economy
Israel Economy
 
arnings Release 2Q07 Presentation
arnings Release 2Q07 Presentationarnings Release 2Q07 Presentation
arnings Release 2Q07 Presentation
 
Earnings Release 2 Q07
Earnings Release 2 Q07Earnings Release 2 Q07
Earnings Release 2 Q07
 
Profarma 4 q11
Profarma 4 q11Profarma 4 q11
Profarma 4 q11
 
Sectoral Economic Development Strategy
Sectoral Economic Development StrategySectoral Economic Development Strategy
Sectoral Economic Development Strategy
 
100804 apresentação de resultados 2 t10-inglês_sem script [modo de compatib...
100804   apresentação de resultados 2 t10-inglês_sem script [modo de compatib...100804   apresentação de resultados 2 t10-inglês_sem script [modo de compatib...
100804 apresentação de resultados 2 t10-inglês_sem script [modo de compatib...
 
2005 - 5th Us Analyst And Investor Meeting Financials
2005 - 5th Us Analyst And Investor Meeting   Financials2005 - 5th Us Analyst And Investor Meeting   Financials
2005 - 5th Us Analyst And Investor Meeting Financials
 
Boyuan Construction Investor Presentation
Boyuan Construction Investor PresentationBoyuan Construction Investor Presentation
Boyuan Construction Investor Presentation
 
[Gleap] Agribank Report
[Gleap] Agribank Report[Gleap] Agribank Report
[Gleap] Agribank Report
 
2010 City Of Bethlehem Finance And Budget Presentation
2010 City Of Bethlehem Finance And Budget Presentation2010 City Of Bethlehem Finance And Budget Presentation
2010 City Of Bethlehem Finance And Budget Presentation
 
oe E. Harlan Executive Vice President, Electro and Communications Business
oe E. Harlan Executive Vice President, Electro and Communications Businessoe E. Harlan Executive Vice President, Electro and Communications Business
oe E. Harlan Executive Vice President, Electro and Communications Business
 
Profarma 4Q10
Profarma 4Q10Profarma 4Q10
Profarma 4Q10
 
Profarma 4Q10
Profarma 4Q10Profarma 4Q10
Profarma 4Q10
 
brunswick annual reports 2006
brunswick annual reports 2006brunswick annual reports 2006
brunswick annual reports 2006
 
Us economic outlook micky levy, chief economist - bank of america 25 januar...
Us economic outlook   micky levy, chief economist - bank of america 25 januar...Us economic outlook   micky levy, chief economist - bank of america 25 januar...
Us economic outlook micky levy, chief economist - bank of america 25 januar...
 
1ª conferência - James S Henry
1ª conferência - James S Henry 1ª conferência - James S Henry
1ª conferência - James S Henry
 
Perú ProinversióN
Perú ProinversióNPerú ProinversióN
Perú ProinversióN
 
Profarma apresentação 2 q11
Profarma apresentação 2 q11Profarma apresentação 2 q11
Profarma apresentação 2 q11
 
Federal
Federal Federal
Federal
 

Mehr von Office of Trade Negotiations (OTN), CARICOM Secretariat

Mehr von Office of Trade Negotiations (OTN), CARICOM Secretariat (20)

WEF Global Competitiveness Report 2014-15
WEF Global Competitiveness Report 2014-15WEF Global Competitiveness Report 2014-15
WEF Global Competitiveness Report 2014-15
 
2014 Annual Report - World Trade Organization (WTO)
2014 Annual Report - World Trade Organization (WTO)2014 Annual Report - World Trade Organization (WTO)
2014 Annual Report - World Trade Organization (WTO)
 
the Association of Caribbean States (ACS): 1994-2014 - 20 Years Promoting Coo...
the Association of Caribbean States (ACS): 1994-2014 - 20 Years Promoting Coo...the Association of Caribbean States (ACS): 1994-2014 - 20 Years Promoting Coo...
the Association of Caribbean States (ACS): 1994-2014 - 20 Years Promoting Coo...
 
TTIP: The Economic Analysis Explained
TTIP: The Economic Analysis ExplainedTTIP: The Economic Analysis Explained
TTIP: The Economic Analysis Explained
 
2014 National Trade Estimate Report on Foreign Trade Barriers
2014 National Trade Estimate Report on Foreign Trade Barriers2014 National Trade Estimate Report on Foreign Trade Barriers
2014 National Trade Estimate Report on Foreign Trade Barriers
 
OTN - Private Sector Trade Note - Vol 2 2014 - CARICOM-Ghana Trade
OTN - Private Sector Trade Note - Vol 2 2014 - CARICOM-Ghana TradeOTN - Private Sector Trade Note - Vol 2 2014 - CARICOM-Ghana Trade
OTN - Private Sector Trade Note - Vol 2 2014 - CARICOM-Ghana Trade
 
2014-03-03 OTN Special Update (The Focus of the WTO MC9)
2014-03-03 OTN Special Update (The Focus of the WTO MC9)2014-03-03 OTN Special Update (The Focus of the WTO MC9)
2014-03-03 OTN Special Update (The Focus of the WTO MC9)
 
OTN Special Update - Economic and Trade Policies Related to Diet and Obesity ...
OTN Special Update - Economic and Trade Policies Related to Diet and Obesity ...OTN Special Update - Economic and Trade Policies Related to Diet and Obesity ...
OTN Special Update - Economic and Trade Policies Related to Diet and Obesity ...
 
WTO Trade Facilitation Agreement - A Business Guide for Developing Countries ...
WTO Trade Facilitation Agreement - A Business Guide for Developing Countries ...WTO Trade Facilitation Agreement - A Business Guide for Developing Countries ...
WTO Trade Facilitation Agreement - A Business Guide for Developing Countries ...
 
OTN - Private Sector Trade Note - vol 4 2013
OTN - Private Sector Trade Note - vol 4 2013OTN - Private Sector Trade Note - vol 4 2013
OTN - Private Sector Trade Note - vol 4 2013
 
The CARICOM Common External Tariff (CET) – The Tariff Structure
The CARICOM Common External Tariff (CET) – The Tariff StructureThe CARICOM Common External Tariff (CET) – The Tariff Structure
The CARICOM Common External Tariff (CET) – The Tariff Structure
 
Innovation for Economic Performance the Case of Latin American Firms
Innovation for Economic Performance the Case of Latin American FirmsInnovation for Economic Performance the Case of Latin American Firms
Innovation for Economic Performance the Case of Latin American Firms
 
Caribbean Community Regional Aid for Trade Strategy 2013–2015 Caribbean Commu...
Caribbean Community Regional Aid for Trade Strategy 2013–2015 Caribbean Commu...Caribbean Community Regional Aid for Trade Strategy 2013–2015 Caribbean Commu...
Caribbean Community Regional Aid for Trade Strategy 2013–2015 Caribbean Commu...
 
CARIFESTA XI -Travel Guide
CARIFESTA XI -Travel GuideCARIFESTA XI -Travel Guide
CARIFESTA XI -Travel Guide
 
Details of the Post Technical Advisor Investment and Private Sector Office of...
Details of the Post Technical Advisor Investment and Private Sector Office of...Details of the Post Technical Advisor Investment and Private Sector Office of...
Details of the Post Technical Advisor Investment and Private Sector Office of...
 
CARICOM View: 40 years of integration, come celebrate with us
CARICOM View:     40 years of integration, come celebrate with usCARICOM View:     40 years of integration, come celebrate with us
CARICOM View: 40 years of integration, come celebrate with us
 
OTN - Private Sector Trade Note - Vol 3 2013
OTN - Private Sector Trade Note - Vol 3 2013OTN - Private Sector Trade Note - Vol 3 2013
OTN - Private Sector Trade Note - Vol 3 2013
 
Aid for Trade: Case Study - Caribbean Aid for Trade (AfT) and Regional Integr...
Aid for Trade: Case Study - Caribbean Aid for Trade (AfT) and Regional Integr...Aid for Trade: Case Study - Caribbean Aid for Trade (AfT) and Regional Integr...
Aid for Trade: Case Study - Caribbean Aid for Trade (AfT) and Regional Integr...
 
OTN Special Update - Innovation - A New Frontier in Trade Multilateralism [20...
OTN Special Update - Innovation - A New Frontier in Trade Multilateralism [20...OTN Special Update - Innovation - A New Frontier in Trade Multilateralism [20...
OTN Special Update - Innovation - A New Frontier in Trade Multilateralism [20...
 
WTO Report - The Future of Trade: The Challenges of Convergence
WTO Report - The Future of Trade: The Challenges of ConvergenceWTO Report - The Future of Trade: The Challenges of Convergence
WTO Report - The Future of Trade: The Challenges of Convergence
 

Haiti - Trade Profile [UWI's Shridath Ramphal Centre]

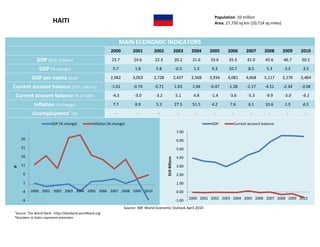
  • 1. Population: 10 million HAITI Area: 27,750 sq km (10,714 sq miles) MAIN ECONOMIC INDICATORS 2000 2001 2002 2003 2004 2005 2006 2007 2008 2009 2010 GDP ($US, billions) 23.7 24.6 22.3 20.2 21.6 33.6 35.3 41.0 45.6 46.7 50.1 GDP (% change) 5.7 1.8 5.8 -0.3 1.3 9.3 10.7 8.5 5.3 3.5 3.5 GDP per capita ($US) 2,982 3,053 2,728 2,437 2,568 3,934 4,081 4,668 5,117 5,176 5,464 Current account balance ($US, billions) -1.01 -0.74 -0.71 1.03 1.04 -0.47 -1.28 -2.17 -4.51 -2.34 -3.06 Current account balance (% of GDP) -4.3 -3.0 -3.2 5.1 4.8 -1.4 -3.6 -5.3 -9.9 -5.0 -6.1 Inflation (% change) 7.7 8.9 5.2 27.5 51.5 4.2 7.6 6.1 10.6 1.5 6.5 Unemployment+ (%) - - - - - - - - - - - GDP (% change) Inflation (% change) GDP Current account balance 7.00 26 6.00 21 5.00 16 4.00 $US Billions % 11 3.00 6 2.00 1 1.00 -4 2000 2001 2002 2003 2004 2005 2006 2007 2008 2009 2010 0.00 2000 2001 2002 2003 2004 2005 2006 2007 2008 2009 2010 -9 -1.00 Source: IMF World Economic Outlook April 2010 + Source: The World Bank - http://databank.worldbank.org *Numbers in italics represent estimates
  • 2. Population: 10 million HAITI Area: 27,750 sq km (10,714 sq miles) MAIN TRADE INDICATORS – GOODS 2005 2006 2007 2008 Trade Balance ($US thousands) -701,318 -1,261,525 -1,215,666 -1,664,673 Total Exported Value ($US thousands) 525,069 641,639 672,730 657,304 Total Imported Value ($US thousands) 1,226,387 1,903,164 1,888,396 2,321,977 Top 10 Markets by % of Total Exported Value (2009) Top 10 Markets by % of Total Imported Value (2009) United States of America 87% United States of America 38% Canada 3% Dominican Republic 31% Mexico 2% China 7% Dominican Republic 2% Colombia 3% France 1% Japan 2% United Kingdom 1% Malaysia 2% Belgium 1% France 2% Germany 1% Canada 2% Chinese Taipei 1% Brazil 2% China 0.4% Mexico 1% Edible fruit, Top 5 Exports by % of Total Exported Value (2008) Essential oils, Top 5 Imports by % of Total Imported Value (2008) Vehicles nuts, peel of perfumes, other than citrus, melons, cosmetics, railway, 2% toileteries, 3% tramway, 6% Iron and Animal,vegetabl steel, 7% Cereals, e fats and oils, Articles of 6% 13% apparel (not knit or crochet), 18% Articles of Cotton, apparel (knit or 10% crochet), 60% Commodities not elsewhere specified, 11% Source: International Trade Centre – www.trademap.org
  • 3. Population: 10 million HAITI Area: 27,750 sq km (10,714 sq miles) MAIN TRADE INDICATORS – SERVICES 2004 2005 2006 2007 2008 Trade Balance ($US thousands) -209,950 -398,910 -399,430 -416,650 -326,739 Total Exported Value ($US thousands) 141,600 145,460 193,930 257,110 204,318 Total Imported Value ($US thousands) 351,550 544,370 593,360 673,760 531,057 Top Imports by % of Total Imported Value (2007) Top Exports by % of Total Exported Value (2007) Transportation 59% Travel 75% Other business services 27% Travel 8% Government services 21% Government services 3% Communications services 2% Financial services 1% Communications services 4% Royalties and license fees 0.1% Source: International Trade Centre – www.trademap.org