SlideShare ist ein Scribd-Unternehmen logo
1 von 2
Downloaden Sie, um offline zu lesen
NEO Total Employment
        Quarterly economic indicators                                                                                          2.10
                                                                                                                                                                                                                                                                                                                                                                                                       “Green” is a hot topic.
                                                                                                                               2.05
        NEO Quarterly Unemployment Rate                                                                                                                                                                                                                                                                                                                                                                Everyone seems to be discussing it, and every
12.6%                                                                                                                                                                                                                                                                                                                                                                                                  country, state and community is competing
                                                                                                                               2.00                                                                                                                                                                                                                                                                    to win the industry. But what does “green” really
                                                                                                                                                                                                                                                                                                                                                                                                       mean to the future of the Cleveland Plus region?
                                                                                                                               1.95
10.5%                                                                                                                                                                                                                                                                                                                                                                                                  As states rapidly develop policies for renewable
                                                                                                                               1.90                                                                                                                                                                                                          Cleveland Plus Economic Review
                                                                                                                                                                                                                                                                                                                                                               ®
                                                                                                                                                                                                                                                                                                                                                                                                       energy use, products such as wind turbines
                                                                                                                                                                                                                                                                                                                                             May 2010 Volume 4, Issue 1                                and solar are in increasingly higher demand.
8.3%
                                                                                                                                                                                                                                                                                                                                                                                                       These products require the same materials
                                                                                                                               1.85                                                                                                                                                                                                                                                                    that propelled Northeast Ohio to its prominence
                                                                                                                                                                                                                                                                                                                                             Our partners include: Greater Cleveland Partnership,
                                                                                                                                                                                                                                                                                                                                                                                                       throughout the 20th Century, such as steel,
                                                                                                                               1.80                                                                                                                                                                                                          Greater Akron Chamber, Stark Development Board,           composites, coatings and bearings.
                                                                                                                                                                                                                                                                                                                                             Team Lorain County, Youngstown-Warren Regional Chamber,


                                                                                                                                                                 2005
                                                                                                                                                                        2006
                                                                                                                                                                        2007
                                                                                                                                                                               2008
                                                                                                                                                                                      2009
                                                                                                                                                                                             2010


                                                                                                                                                                                                           2005
                                                                                                                                                                                                                  2006
                                                                                                                                                                                                                  2007
                                                                                                                                                                                                                            2008
                                                                                                                                                                                                                                   2009


                                                                                                                                                                                                                                                       2005
                                                                                                                                                                                                                                                              2006
                                                                                                                                                                                                                                                              2007
                                                                                                                                                                                                                                                                        2008
                                                                                                                                                                                                                                                                               2009


                                                                                                                                                                                                                                                                                                2005
                                                                                                                                                                                                                                                                                                       2006
                                                                                                                                                                                                                                                                                                       2007
                                                                                                                                                                                                                                                                                                                2008
                                                                                                                                                                                                                                                                                                                       2009
                                                                                                                                                          2004


                                                                                                                                                                                                    2004


                                                                                                                                                                                                                                                2004


                                                                                                                                                                                                                                                                                         2004
6.2%


                                                                                                                                         (Millions)
                                                                                                                                                                                                                                                                                                                                                                                                       In fact, many wind turbine components
                                                                                                                                                                          Q1                                           Q2                                          Q3                                    Q4                                  Medina County Economic Development Corporation,           are already made in Northeast Ohio.
                                                                                                                                                                                                                                    Source: Ohio Labor Market Information (LAUS Data)                                                        Growth Partnership of Ashtabula County                    Coatings from Sherwin-Williams help protect
4.0%                                                                                                                                                      NEO EMPLOYMENT SEES DECLINE IN Q1 This chart shows                                                                                                                                                                                           materials from nature’s elements, while
                                                                                                                                                          total employment year over year for comparison of seasonal                                                                                                                                                                                   Timken bearings help propel the blades.
        Q1
        Q2
        Q3
        Q4
        Q1
        Q2
        Q3
        Q4
        Q1
        Q2
        Q3
        Q4
        Q1
        Q2
        Q3
        Q4
        Q1
        Q2
        Q3
        Q4
        Q1
        Q2
        Q3
        Q4
        Q1
        Q2
        Q3
        Q4
        Q1                                                                                                                                                patterns. Total employment declined to 1.87 million in the
          2003          2004           2005        2006       2007       2008         2009        2010
                                                                                                                                                          1st quarter. Year over year, total employment has declined                                                                                                                                                                                   This report looks at how Cleveland Plus industries
                      Ohio                             NEO 16                                US                                                           approximately 2%, and is down 6.6% compared to Q1 2008.                                                                                                                                                                                      and expertise are fueling the next generation of
                                              Source: Ohio Labor Market Information (LAUS Data)                                                                                                                                                                                                                                                                                                        energy products, known as “Cleantech,” making
        NEO UNEMPLOYMENT RATE INCREASES IN Q1 The Northeast                                                                                               NEO Occupied Industrial Space                                                                                                                                                                                                                us well-positioned for the future global economy.
        Ohio unadjusted unemployment rate increased to 11.6% in the
        1st quarter of 2010. The State of Ohio (11.7%) and the U.S (10.4%)
                                                                                                                                                    406
                                                                                                                                                          & Vacancy Rate
                                                                                                                                                                                                                                                                                                                9.5%
                                                                                                                                                                                                                                                                                                                                              Cleveland Plus
                                                                                                                                                                                                                                                                                                                                              well-positioned for
        also saw increases.
                                                                                                                                                    404
                                                                                                                                                                                                                                                                                                                9.0%
                                                                                                                  Occupied Square Feet (Millions)


                                                                                                                                                                                                                                                                                                                                             “green” Cleantech
                                                                                                                                                    402
                                                                                                                                                                                                                                                                                                                8.5%
        NEO Real GRP in billions                                                                                                                    400
 $190


                                                                                                                                                                                                                                                                                                                              Vacancy Rate
                                                                                                                                                                                                                                                                                                                                              economy.
                                                                                                                                                    398                                                                                                                                                         8.0%
                                                                             0.6%
 $180                                                                 2.4%       (-.7%)
                                                              1.8%                           (-1.8%)                                                396
                                    2.6% 1.2%
                                              0.3%       1.2%                                                                                                                                                                                                                                                   7.5%
 $170                                             (-1.9)%
                                                                                                   (-6.4%)
                             4.8%
                                                                                                                                                    394
 $160                 3.0%                                                                                                                                                                                                                                                                                      7.0%
               3.8%                                                                                                                                 392
 $150   5.1%                                                                                                                                                                                                                                                                                                    6.5%
                                                                                                                                                    390
 $140
                                                                                                                                                    388                                                                                                                                                         6.0%
                                                                                                                                                                          Q3
                                                                                                                                                          Q1

                                                                                                                                                                    Q2


                                                                                                                                                                                 Q4

                                                                                                                                                                                             Q1

                                                                                                                                                                                                     Q2

                                                                                                                                                                                                                  Q3

                                                                                                                                                                                                                       Q4

                                                                                                                                                                                                                                   Q1

                                                                                                                                                                                                                                           Q2

                                                                                                                                                                                                                                                   Q3

                                                                                                                                                                                                                                                              Q4

                                                                                                                                                                                                                                                                    Q1

                                                                                                                                                                                                                                                                               Q2

                                                                                                                                                                                                                                                                                       Q3

                                                                                                                                                                                                                                                                                                Q4

                                                                                                                                                                                                                                                                                                       Q1
 $130
                                                                                                                                                                         2006                         2007                                 2008                                2009                    2010
 $120
        1994 1995 1996 1997 1998 1999 2000 2001 2002 2003 2004 2005 2006 2007 2008 2009 2010
                                                                                                                                                                                                    Occupied Space                                                               Vacancy Rate
                              Real GRP                Average Annual Growth = 1.5%                                                                                                                                                                            Source: CoStar Industrial Data
                                                                               Source: Moody’s Economy.com
                                                                                                                                                          INDUSTRIAL SPACE RELATIVELY STABLE This graph shows
        GRP ESTIMATES PROJECTED TO INCREASE The most recent                                                                                               quarterly occupied space and vacancy rates for industrial
        estimates from economy.com show Northeast Ohio’s GRP                                                                                              space between the first quarter of 2006 and the first quarter
        increasing in 2010 by 3.1%. This is the first increase since the                                                                                  of 2010. In Q1 of 2010, the vacancy rate increased slightly to
        recession began in December 2007.                                                                                                                 8.5%, while occupied space remained relatively stable.


        About Team NEO : Team NEO advances                                            Moody’s Economy.com county level output,                                                                 These counties include Ashtabula,
        Northeast Ohio’s economy by attracting                                        employment and payroll historical data are                                                               Cuyahoga, Geauga, Lake, Lorain,
        businesses worldwide to the 16-county                                         estimated from several publicly available                                                                Medina, Portage, Richland,
        Cleveland Plus region. The organization                                       sources and are summarized into the Team NEO                                                             Stark and Summit.
                                                                                                                                                                                                                                                                                                 Ashtabula
        is a joint venture of the region’s largest metro                              regional footprint. It is important to understand                                                                                                                                        Lake
        chambers of commerce. Since 2007, the                                         data provided by Economy.com are estimates
        organization has attracted 33 new company                                     of economic activity.
        expansions or relocations, 3,200 new jobs and                                                                                                                                                                                                 Cleveland Geauga
        $100M in annual payroll to Northeast Ohio,                                    Team NEO also uses data from federal and state                                                                                                            Cuyahoga
        leading to a total annual regional payroll                                    sources as part of the report. We rely heavily                                                                                    Lorain                                                                       Trumbull
        benefit of $260M. For more information,                                       on data from the U.S. Bureau of Labor Statistics
        visit www.clevelandplusbusiness.com.                                          (www.bls.gov) and Ohio’s Labor Market                                                                                                                                   Summit Portage
                                                                                      Information (www.lmi.state.oh.us) for information                                                                                                   Medina                  Akron      Youngstown
        Data Sources: Team Northeast Ohio uses a                                      on wages, unemployment and both general                                                                                                                                                    Mahoning
        number of data sources for the Regional                                       and industry-specific employment.
        Economic Review. One of the primary sources is                                                                                                                                                             Ashland
                                                                                      Industrial real estate data for this edition was                                                                                                    Wayne                                Canton           Columbiana
        the Moody’s Economy.com (www.economy.com)                                                                                                                                                   Richland                                                     Stark
        Northeast Ohio modeling system.                                               derived from the CoStar Group. Due to market
                                                                                      limits within the CoStar database, historic trend
                                                                                      data for the Team NEO region is defined as 10 of                                                                                                                                                Carroll
                                                                                      the 16 counties forming the regional footprint.
                                                                                                                                                                                              Cleveland Plus 16-County Region


                                                             This report made possible through                                                                          737 Bolivar Road, Suite 2000, Cleveland, Ohio 44115                                                                                        FPO
                                                             the generous support of Dominion.                                                                          888.NEO.1411 • www.clevelandplusbusiness.com
                                                                                                                                                                                                                                                                                                                                               www.clevelandplusbusiness.com                           www.clevelandplusbusiness.com
Cleveland Plus Manufacturing Expertise Offers                                                                                               Defining the “Cleantech”                                 Cleveland Plus Cleantech Supply Chain
  Strong Base for Cleantech Supply Chain                                                                                                      Industry                                                 Stronger than U.S. Average
                                                                                                                                                                                                       Key Cleantech supply chain industries are much stronger in Northeast Ohio than the national average. Location
  Many of the products in the Cleantech supply chain are the same materials and components used in automotive,                                Cleantech is a fairly new term, and new industry.
                                                                                                                                                                                                       Quotients (LQ) show how prominent a certain industry is compared to the U.S. as a whole. As indicated in this LQ chart,
  aerospace and other more traditional manufacturing industries. Northeast Ohio is home to hundreds of companies                              According to Wikipedia, “Cleantech” is a term used
                                                                                                                                                                                                       Northeast Ohio LQ values are significantly higher in many Cleantech supply sectors. For instance, Fabricated Metal has
  that are leaders in their fields, producing components for the Cleantech economy. The industries that the California                        to describe knowledge-based products or services
                                                                                                                                                                                                       an LQ value of almost 6 in Northeast Ohio, meaning that the Cleveland Plus region is producing 600% more fabricated
  Green Digest defines as part of the Cleantech supply chain collectively represent $12.5 billion (7.5%) of Northeast                         that improve operational performance, productivity,
                                                                                                                                                                                                       metal than the national average. With so much capacity, Northeast Ohio is poised to export goods to wind turbine
  Ohio’s economy today and are projected to grow more than 20% between 2010 and 2015. This sector represents                                  or efficiency while reducing costs, inputs, energy
                                                                                                                                                                                                       manufacturers globally.
  36% of all manufacturing in Cleveland Plus.                                                                                                 consumption, waste, or pollution.

                                                                                                                                              As part of an ongoing effort to analyze the emergence
                                                                                                                                                                                                                                                                           Concentration of Cleantech
                                            Northeast Ohio GRP for Top 10                                                                     of a “green” economy, the California Labor Market
                                                                                                                                              Information has put together a California Green Digest                                                                       Supply Chain in Cleveland Plus
                                            Cleantech Related Manufacturing Sectors                                                           that defines manufacturing inputs to the “Cleantech”
                                                                                                                                              supply chain. The Digest aggregates national studies                                  Other Nonmetallic Mineral Products
                                                                                                                                              to define the inputs required to manufacture Cleantech                                                  Plastics Products
          Paint, Coating and Adhesives                                                                                                        devices, such as wind turbines. Materials, components                                        Clay Product and Refractory
                                                                                                                                              and products required for these devices include steel,                              Bolier, Tank, and Shipping Containers
                               Foundries                                                                                                      plastics and coatings, much of which is already made
                                                                                                                                                                                                                                      Other General Purpose Machinery
                        Rubber Products                                                                                                       in Northeast Ohio, or holds opportunity based on the
                                                                                                                                                                                                                                           Paint, Coating and Adhesive
                                                                                                                                              region’s assets.
      Architectural and Structural Metals                                                                                                                                                                                                              Rubber Products

  Printing and Related Support Activities                                                                                                                                                                                                                     Foundries
                                                                                                                                                                                                                                       Other Fabricated Metal Products
                        Basic Chemicals
                                                                                                                                                                                                                                     Iron and Steel Mills and Ferroalloy
      Iron and Steel Mills and Ferroalloy
      Other General Purpose Machinery                                                                                                                                                                                                                                 0.00     1.00        2.00       3.00       4.00          5.00      6.00        7.00       8.00
                                                                                                                                              Northeast Ohio                                                                                                                 LQ National
                       Plastics Products
                                                                                                                                              manufactures                                                                                                                     Average                           LQ Value      Source: Economy.com and California LMI

        Other Fabricated Metal Products                                                                                                       many turbine
                                                                                                                                              components.
                                            $0    $200     $400       $600   $800   $1,000 $1,200         $1,400       $1,600       $1,800
                                                                                                                                                                                                       Cleantech Industries
                                                                              Millions 2009          Source: Economy.com and California LMI                                                            Propelled by Strong Workforce
                                                                                                                                                                                                       The Cleveland Plus workforce is well positioned to meet the demand to build Cleantech products. The organization
                                                                                                                                                                                                       O-NET, a branch of the U.S. Department of Labor, has identified green related occupations expected to see a significant
                                                                                                                                                                                                       increase in demand due to the emergence of Cleantech related industries. In many of these occupations, Cleveland
                                                                                                                                                                                                       Plus has an above average share of workers. Of the 27 increased demand occupations identified, Cleveland Plus has
                                                                                                                                                                                                       more than 130,000 workers, and 20 of these occupations have an LQ at 1 or above. This means that Cleveland Plus is not
                                 a sampling                                   Windmill Blades
                                                                              + Cardinal Fastener & Specialty Co., Inc.                                                                                only producing Cleantech products, but the workforce needed is already in place.
                             of companies
                               .                                              + Dyson Corporation
                                                                              + ITW Anchor Fasteners
                                                                                                                                                                                                                                                                           Top 10 Occupations for
                           that are making                                    + Summit Machine, Ltd.
                                                                                                                                                                                                                                                                           Cleantech Related Supply Chain
                         wind components                                      Gearbox
                                                                              + Federal Gear

                                     today                                    + American Friction Technologies                                                                                                        Total of All Green Increased Demand Occupations
                                                                              + Kaydon Corporation                                                                                                                                        Laborers and Material Movers
                                                                                                                                                                                                                                    First-Line Supervisors of Production
                                                                              Hub & Structure
“The Sherwin-Williams Company has developed industry                                                                                                                                                                              Mixing & Blending Machine Operators
                                                                              + The Timken Company
   leading coatings technologies at its Cleveland-based                       + Elyria Foundry Company                                                                                                                        Chemical Equipment Operators & Tenders
  research & development center to support our nation’s
         growing investment in alternative energy assets.                     Tower                                                                                                                                                     Industrial Production Managers
            With regional manufacturing strength in steel,                    + NSK Industries Incorporated                                                                                                                                          Materials Scientist
             fiberglass, resins, electronic control systems,                  + Stahl Gear and Machine Co.                                                                                                                        Drilling & Boring Machine Tool Setters
       and storage capabilities, Northeastern Ohio offers                     + Jacobson Mfg., LLC
      significant opportunities for partnerships in this fast                                                                                                                                                Plastics Product Cutting, Punching & Press Machine Setters
                                          growing market.”                    Coatings                                                                                                                                     Computer-Controlled Machine Tool Operators
                                                                              + Sherwin-Williams
                                             Christopher M. Connor,
                  Chairman & CEO, The Sherwin-Williams Company                                                                                                                                                                                                        0.00       0.50         1.00        1.50          2.00          2.50         3.00         3.50
                                                                                                                                                                                                                                                                                            LQ National          LQ Value Source: O-NET and Bureau of Labor Statistics
                                                                                                                                                 Source: Great Lakes Wind Network                                                                                                             Average

Weitere ähnliche Inhalte

Ähnlich wie May cleantechreport

City of San Antonio Design Districts & Form Based Zoning
City of San Antonio Design Districts & Form Based ZoningCity of San Antonio Design Districts & Form Based Zoning
City of San Antonio Design Districts & Form Based ZoningBecentro Bedowntown
 
Business And It Value
Business And It ValueBusiness And It Value
Business And It Valuealliej
 
symc_annual1999
symc_annual1999symc_annual1999
symc_annual1999finance40
 
Trahan stuart
Trahan stuartTrahan stuart
Trahan stuartNASAPMC
 
Converting Existing Port Terminals —How we make it work
Converting Existing Port Terminals —How we make it workConverting Existing Port Terminals —How we make it work
Converting Existing Port Terminals —How we make it workPortek International Pte Ltd
 
Occ Page
Occ PageOcc Page
Occ PageJason M
 
RR Donnelley 2000AR
RR Donnelley  2000ARRR Donnelley  2000AR
RR Donnelley 2000ARfinance23
 
Agencyfamilytrees2010
Agencyfamilytrees2010Agencyfamilytrees2010
Agencyfamilytrees2010yardleyluk
 
Agency Family Tree 2010
Agency Family Tree 2010Agency Family Tree 2010
Agency Family Tree 2010Prakash Ranjan
 
Agency Family trees 2010
Agency Family trees 2010Agency Family trees 2010
Agency Family trees 2010Jan Bultinck
 
Agency Family Trees 2010
Agency Family Trees 2010Agency Family Trees 2010
Agency Family Trees 2010Plínio Okamoto
 
Poster EWEA "Damping Estimation of an Offshore Wind Turbine on a Monopile Fou...
Poster EWEA "Damping Estimation of an Offshore Wind Turbine on a Monopile Fou...Poster EWEA "Damping Estimation of an Offshore Wind Turbine on a Monopile Fou...
Poster EWEA "Damping Estimation of an Offshore Wind Turbine on a Monopile Fou...Pieter Jan Jordaens
 
Ethier Associates Calgary CIO Forum June 509
Ethier Associates Calgary CIO Forum June 509Ethier Associates Calgary CIO Forum June 509
Ethier Associates Calgary CIO Forum June 509MicheleTaylor
 
Präsentation session 5
Präsentation session 5Präsentation session 5
Präsentation session 5bfnd
 
Viedome Presentation Eu
Viedome Presentation EuViedome Presentation Eu
Viedome Presentation Eumwdgielen
 

Ähnlich wie May cleantechreport (20)

City of San Antonio Design Districts & Form Based Zoning
City of San Antonio Design Districts & Form Based ZoningCity of San Antonio Design Districts & Form Based Zoning
City of San Antonio Design Districts & Form Based Zoning
 
Absolute green energy overview
Absolute green energy overviewAbsolute green energy overview
Absolute green energy overview
 
Business And It Value
Business And It ValueBusiness And It Value
Business And It Value
 
symc_annual1999
symc_annual1999symc_annual1999
symc_annual1999
 
Trahan stuart
Trahan stuartTrahan stuart
Trahan stuart
 
Socialmediabrittany
SocialmediabrittanySocialmediabrittany
Socialmediabrittany
 
Converting Existing Port Terminals —How we make it work
Converting Existing Port Terminals —How we make it workConverting Existing Port Terminals —How we make it work
Converting Existing Port Terminals —How we make it work
 
Occ Page
Occ PageOcc Page
Occ Page
 
RR Donnelley 2000AR
RR Donnelley  2000ARRR Donnelley  2000AR
RR Donnelley 2000AR
 
Agencyfamilytrees2010
Agencyfamilytrees2010Agencyfamilytrees2010
Agencyfamilytrees2010
 
Agency Family Tree 2010
Agency Family Tree 2010Agency Family Tree 2010
Agency Family Tree 2010
 
Agency Family trees 2010
Agency Family trees 2010Agency Family trees 2010
Agency Family trees 2010
 
Agency Family Trees 2010
Agency Family Trees 2010Agency Family Trees 2010
Agency Family Trees 2010
 
Agencyfamilytrees2010
Agencyfamilytrees2010Agencyfamilytrees2010
Agencyfamilytrees2010
 
Absolute green energy overview
Absolute green energy overviewAbsolute green energy overview
Absolute green energy overview
 
Poster EWEA "Damping Estimation of an Offshore Wind Turbine on a Monopile Fou...
Poster EWEA "Damping Estimation of an Offshore Wind Turbine on a Monopile Fou...Poster EWEA "Damping Estimation of an Offshore Wind Turbine on a Monopile Fou...
Poster EWEA "Damping Estimation of an Offshore Wind Turbine on a Monopile Fou...
 
Ethier Associates Calgary CIO Forum June 509
Ethier Associates Calgary CIO Forum June 509Ethier Associates Calgary CIO Forum June 509
Ethier Associates Calgary CIO Forum June 509
 
Data quality practical guide
Data quality practical guideData quality practical guide
Data quality practical guide
 
Präsentation session 5
Präsentation session 5Präsentation session 5
Präsentation session 5
 
Viedome Presentation Eu
Viedome Presentation EuViedome Presentation Eu
Viedome Presentation Eu
 

Mehr von Team NEO

2011 8.30 JobsOhio Presentation
2011 8.30 JobsOhio Presentation2011 8.30 JobsOhio Presentation
2011 8.30 JobsOhio PresentationTeam NEO
 
Q410 qer singlepages
Q410 qer singlepagesQ410 qer singlepages
Q410 qer singlepagesTeam NEO
 
Q410 qer singlepages
Q410 qer singlepagesQ410 qer singlepages
Q410 qer singlepagesTeam NEO
 
Plus Review 3Q 2010
Plus Review 3Q 2010Plus Review 3Q 2010
Plus Review 3Q 2010Team NEO
 
Ohio Tax Refrom Year 2 In Review
Ohio Tax Refrom   Year 2 In ReviewOhio Tax Refrom   Year 2 In Review
Ohio Tax Refrom Year 2 In ReviewTeam NEO
 
Cleveland Plus International Destination
Cleveland Plus International DestinationCleveland Plus International Destination
Cleveland Plus International DestinationTeam NEO
 
Cleveland Plus Healthcare
Cleveland Plus HealthcareCleveland Plus Healthcare
Cleveland Plus HealthcareTeam NEO
 
Cleveland Plus Food Processing
Cleveland Plus Food ProcessingCleveland Plus Food Processing
Cleveland Plus Food ProcessingTeam NEO
 
Cleveland Plus Advanced Energy
Cleveland Plus Advanced EnergyCleveland Plus Advanced Energy
Cleveland Plus Advanced EnergyTeam NEO
 
Projected Occupational Change
Projected Occupational ChangeProjected Occupational Change
Projected Occupational ChangeTeam NEO
 
Diverse Economy
Diverse EconomyDiverse Economy
Diverse EconomyTeam NEO
 
Team NEO Advancing Northeast Ohio's Economy Through Business Attraction
Team NEO Advancing Northeast Ohio's Economy Through Business AttractionTeam NEO Advancing Northeast Ohio's Economy Through Business Attraction
Team NEO Advancing Northeast Ohio's Economy Through Business AttractionTeam NEO
 
September 2009 Cleveland Plus Quarter Economic Review
September 2009 Cleveland Plus Quarter Economic ReviewSeptember 2009 Cleveland Plus Quarter Economic Review
September 2009 Cleveland Plus Quarter Economic ReviewTeam NEO
 
Making an Impact : Assessing the Benefits of Ohio's Investment in Technology-...
Making an Impact : Assessing the Benefits of Ohio's Investment in Technology-...Making an Impact : Assessing the Benefits of Ohio's Investment in Technology-...
Making an Impact : Assessing the Benefits of Ohio's Investment in Technology-...Team NEO
 
2009 Team NEO State of the Region Event
2009 Team NEO State of the Region Event2009 Team NEO State of the Region Event
2009 Team NEO State of the Region EventTeam NEO
 
International Business Attraction Summit
International Business Attraction SummitInternational Business Attraction Summit
International Business Attraction SummitTeam NEO
 
Regional Economic Development System Diagram
Regional Economic Development System DiagramRegional Economic Development System Diagram
Regional Economic Development System DiagramTeam NEO
 
Commuter Migration
Commuter MigrationCommuter Migration
Commuter MigrationTeam NEO
 
Commuter Migration
Commuter MigrationCommuter Migration
Commuter MigrationTeam NEO
 
Team NEO Presentation to Cleveland Plus FAM Tour
Team NEO Presentation to Cleveland Plus FAM TourTeam NEO Presentation to Cleveland Plus FAM Tour
Team NEO Presentation to Cleveland Plus FAM TourTeam NEO
 

Mehr von Team NEO (20)

2011 8.30 JobsOhio Presentation
2011 8.30 JobsOhio Presentation2011 8.30 JobsOhio Presentation
2011 8.30 JobsOhio Presentation
 
Q410 qer singlepages
Q410 qer singlepagesQ410 qer singlepages
Q410 qer singlepages
 
Q410 qer singlepages
Q410 qer singlepagesQ410 qer singlepages
Q410 qer singlepages
 
Plus Review 3Q 2010
Plus Review 3Q 2010Plus Review 3Q 2010
Plus Review 3Q 2010
 
Ohio Tax Refrom Year 2 In Review
Ohio Tax Refrom   Year 2 In ReviewOhio Tax Refrom   Year 2 In Review
Ohio Tax Refrom Year 2 In Review
 
Cleveland Plus International Destination
Cleveland Plus International DestinationCleveland Plus International Destination
Cleveland Plus International Destination
 
Cleveland Plus Healthcare
Cleveland Plus HealthcareCleveland Plus Healthcare
Cleveland Plus Healthcare
 
Cleveland Plus Food Processing
Cleveland Plus Food ProcessingCleveland Plus Food Processing
Cleveland Plus Food Processing
 
Cleveland Plus Advanced Energy
Cleveland Plus Advanced EnergyCleveland Plus Advanced Energy
Cleveland Plus Advanced Energy
 
Projected Occupational Change
Projected Occupational ChangeProjected Occupational Change
Projected Occupational Change
 
Diverse Economy
Diverse EconomyDiverse Economy
Diverse Economy
 
Team NEO Advancing Northeast Ohio's Economy Through Business Attraction
Team NEO Advancing Northeast Ohio's Economy Through Business AttractionTeam NEO Advancing Northeast Ohio's Economy Through Business Attraction
Team NEO Advancing Northeast Ohio's Economy Through Business Attraction
 
September 2009 Cleveland Plus Quarter Economic Review
September 2009 Cleveland Plus Quarter Economic ReviewSeptember 2009 Cleveland Plus Quarter Economic Review
September 2009 Cleveland Plus Quarter Economic Review
 
Making an Impact : Assessing the Benefits of Ohio's Investment in Technology-...
Making an Impact : Assessing the Benefits of Ohio's Investment in Technology-...Making an Impact : Assessing the Benefits of Ohio's Investment in Technology-...
Making an Impact : Assessing the Benefits of Ohio's Investment in Technology-...
 
2009 Team NEO State of the Region Event
2009 Team NEO State of the Region Event2009 Team NEO State of the Region Event
2009 Team NEO State of the Region Event
 
International Business Attraction Summit
International Business Attraction SummitInternational Business Attraction Summit
International Business Attraction Summit
 
Regional Economic Development System Diagram
Regional Economic Development System DiagramRegional Economic Development System Diagram
Regional Economic Development System Diagram
 
Commuter Migration
Commuter MigrationCommuter Migration
Commuter Migration
 
Commuter Migration
Commuter MigrationCommuter Migration
Commuter Migration
 
Team NEO Presentation to Cleveland Plus FAM Tour
Team NEO Presentation to Cleveland Plus FAM TourTeam NEO Presentation to Cleveland Plus FAM Tour
Team NEO Presentation to Cleveland Plus FAM Tour
 

Kürzlich hochgeladen

Search Engine Optimization SEO PDF for 2024.pdf
Search Engine Optimization SEO PDF for 2024.pdfSearch Engine Optimization SEO PDF for 2024.pdf
Search Engine Optimization SEO PDF for 2024.pdfRankYa
 
DevoxxFR 2024 Reproducible Builds with Apache Maven
DevoxxFR 2024 Reproducible Builds with Apache MavenDevoxxFR 2024 Reproducible Builds with Apache Maven
DevoxxFR 2024 Reproducible Builds with Apache MavenHervé Boutemy
 
From Family Reminiscence to Scholarly Archive .
From Family Reminiscence to Scholarly Archive .From Family Reminiscence to Scholarly Archive .
From Family Reminiscence to Scholarly Archive .Alan Dix
 
"Debugging python applications inside k8s environment", Andrii Soldatenko
"Debugging python applications inside k8s environment", Andrii Soldatenko"Debugging python applications inside k8s environment", Andrii Soldatenko
"Debugging python applications inside k8s environment", Andrii SoldatenkoFwdays
 
H2O.ai CEO/Founder: Sri Ambati Keynote at Wells Fargo Day
H2O.ai CEO/Founder: Sri Ambati Keynote at Wells Fargo DayH2O.ai CEO/Founder: Sri Ambati Keynote at Wells Fargo Day
H2O.ai CEO/Founder: Sri Ambati Keynote at Wells Fargo DaySri Ambati
 
Advanced Computer Architecture – An Introduction
Advanced Computer Architecture – An IntroductionAdvanced Computer Architecture – An Introduction
Advanced Computer Architecture – An IntroductionDilum Bandara
 
Powerpoint exploring the locations used in television show Time Clash
Powerpoint exploring the locations used in television show Time ClashPowerpoint exploring the locations used in television show Time Clash
Powerpoint exploring the locations used in television show Time Clashcharlottematthew16
 
Artificial intelligence in cctv survelliance.pptx
Artificial intelligence in cctv survelliance.pptxArtificial intelligence in cctv survelliance.pptx
Artificial intelligence in cctv survelliance.pptxhariprasad279825
 
New from BookNet Canada for 2024: BNC CataList - Tech Forum 2024
New from BookNet Canada for 2024: BNC CataList - Tech Forum 2024New from BookNet Canada for 2024: BNC CataList - Tech Forum 2024
New from BookNet Canada for 2024: BNC CataList - Tech Forum 2024BookNet Canada
 
Unraveling Multimodality with Large Language Models.pdf
Unraveling Multimodality with Large Language Models.pdfUnraveling Multimodality with Large Language Models.pdf
Unraveling Multimodality with Large Language Models.pdfAlex Barbosa Coqueiro
 
Transcript: New from BookNet Canada for 2024: BNC CataList - Tech Forum 2024
Transcript: New from BookNet Canada for 2024: BNC CataList - Tech Forum 2024Transcript: New from BookNet Canada for 2024: BNC CataList - Tech Forum 2024
Transcript: New from BookNet Canada for 2024: BNC CataList - Tech Forum 2024BookNet Canada
 
Tampa BSides - Chef's Tour of Microsoft Security Adoption Framework (SAF)
Tampa BSides - Chef's Tour of Microsoft Security Adoption Framework (SAF)Tampa BSides - Chef's Tour of Microsoft Security Adoption Framework (SAF)
Tampa BSides - Chef's Tour of Microsoft Security Adoption Framework (SAF)Mark Simos
 
Advanced Test Driven-Development @ php[tek] 2024
Advanced Test Driven-Development @ php[tek] 2024Advanced Test Driven-Development @ php[tek] 2024
Advanced Test Driven-Development @ php[tek] 2024Scott Keck-Warren
 
DevEX - reference for building teams, processes, and platforms
DevEX - reference for building teams, processes, and platformsDevEX - reference for building teams, processes, and platforms
DevEX - reference for building teams, processes, and platformsSergiu Bodiu
 
SIP trunking in Janus @ Kamailio World 2024
SIP trunking in Janus @ Kamailio World 2024SIP trunking in Janus @ Kamailio World 2024
SIP trunking in Janus @ Kamailio World 2024Lorenzo Miniero
 
"ML in Production",Oleksandr Bagan
"ML in Production",Oleksandr Bagan"ML in Production",Oleksandr Bagan
"ML in Production",Oleksandr BaganFwdays
 
Hyperautomation and AI/ML: A Strategy for Digital Transformation Success.pdf
Hyperautomation and AI/ML: A Strategy for Digital Transformation Success.pdfHyperautomation and AI/ML: A Strategy for Digital Transformation Success.pdf
Hyperautomation and AI/ML: A Strategy for Digital Transformation Success.pdfPrecisely
 
Scanning the Internet for External Cloud Exposures via SSL Certs
Scanning the Internet for External Cloud Exposures via SSL CertsScanning the Internet for External Cloud Exposures via SSL Certs
Scanning the Internet for External Cloud Exposures via SSL CertsRizwan Syed
 
CloudStudio User manual (basic edition):
CloudStudio User manual (basic edition):CloudStudio User manual (basic edition):
CloudStudio User manual (basic edition):comworks
 

Kürzlich hochgeladen (20)

Search Engine Optimization SEO PDF for 2024.pdf
Search Engine Optimization SEO PDF for 2024.pdfSearch Engine Optimization SEO PDF for 2024.pdf
Search Engine Optimization SEO PDF for 2024.pdf
 
DevoxxFR 2024 Reproducible Builds with Apache Maven
DevoxxFR 2024 Reproducible Builds with Apache MavenDevoxxFR 2024 Reproducible Builds with Apache Maven
DevoxxFR 2024 Reproducible Builds with Apache Maven
 
From Family Reminiscence to Scholarly Archive .
From Family Reminiscence to Scholarly Archive .From Family Reminiscence to Scholarly Archive .
From Family Reminiscence to Scholarly Archive .
 
"Debugging python applications inside k8s environment", Andrii Soldatenko
"Debugging python applications inside k8s environment", Andrii Soldatenko"Debugging python applications inside k8s environment", Andrii Soldatenko
"Debugging python applications inside k8s environment", Andrii Soldatenko
 
H2O.ai CEO/Founder: Sri Ambati Keynote at Wells Fargo Day
H2O.ai CEO/Founder: Sri Ambati Keynote at Wells Fargo DayH2O.ai CEO/Founder: Sri Ambati Keynote at Wells Fargo Day
H2O.ai CEO/Founder: Sri Ambati Keynote at Wells Fargo Day
 
Advanced Computer Architecture – An Introduction
Advanced Computer Architecture – An IntroductionAdvanced Computer Architecture – An Introduction
Advanced Computer Architecture – An Introduction
 
Powerpoint exploring the locations used in television show Time Clash
Powerpoint exploring the locations used in television show Time ClashPowerpoint exploring the locations used in television show Time Clash
Powerpoint exploring the locations used in television show Time Clash
 
Artificial intelligence in cctv survelliance.pptx
Artificial intelligence in cctv survelliance.pptxArtificial intelligence in cctv survelliance.pptx
Artificial intelligence in cctv survelliance.pptx
 
New from BookNet Canada for 2024: BNC CataList - Tech Forum 2024
New from BookNet Canada for 2024: BNC CataList - Tech Forum 2024New from BookNet Canada for 2024: BNC CataList - Tech Forum 2024
New from BookNet Canada for 2024: BNC CataList - Tech Forum 2024
 
Unraveling Multimodality with Large Language Models.pdf
Unraveling Multimodality with Large Language Models.pdfUnraveling Multimodality with Large Language Models.pdf
Unraveling Multimodality with Large Language Models.pdf
 
Transcript: New from BookNet Canada for 2024: BNC CataList - Tech Forum 2024
Transcript: New from BookNet Canada for 2024: BNC CataList - Tech Forum 2024Transcript: New from BookNet Canada for 2024: BNC CataList - Tech Forum 2024
Transcript: New from BookNet Canada for 2024: BNC CataList - Tech Forum 2024
 
Tampa BSides - Chef's Tour of Microsoft Security Adoption Framework (SAF)
Tampa BSides - Chef's Tour of Microsoft Security Adoption Framework (SAF)Tampa BSides - Chef's Tour of Microsoft Security Adoption Framework (SAF)
Tampa BSides - Chef's Tour of Microsoft Security Adoption Framework (SAF)
 
Advanced Test Driven-Development @ php[tek] 2024
Advanced Test Driven-Development @ php[tek] 2024Advanced Test Driven-Development @ php[tek] 2024
Advanced Test Driven-Development @ php[tek] 2024
 
E-Vehicle_Hacking_by_Parul Sharma_null_owasp.pptx
E-Vehicle_Hacking_by_Parul Sharma_null_owasp.pptxE-Vehicle_Hacking_by_Parul Sharma_null_owasp.pptx
E-Vehicle_Hacking_by_Parul Sharma_null_owasp.pptx
 
DevEX - reference for building teams, processes, and platforms
DevEX - reference for building teams, processes, and platformsDevEX - reference for building teams, processes, and platforms
DevEX - reference for building teams, processes, and platforms
 
SIP trunking in Janus @ Kamailio World 2024
SIP trunking in Janus @ Kamailio World 2024SIP trunking in Janus @ Kamailio World 2024
SIP trunking in Janus @ Kamailio World 2024
 
"ML in Production",Oleksandr Bagan
"ML in Production",Oleksandr Bagan"ML in Production",Oleksandr Bagan
"ML in Production",Oleksandr Bagan
 
Hyperautomation and AI/ML: A Strategy for Digital Transformation Success.pdf
Hyperautomation and AI/ML: A Strategy for Digital Transformation Success.pdfHyperautomation and AI/ML: A Strategy for Digital Transformation Success.pdf
Hyperautomation and AI/ML: A Strategy for Digital Transformation Success.pdf
 
Scanning the Internet for External Cloud Exposures via SSL Certs
Scanning the Internet for External Cloud Exposures via SSL CertsScanning the Internet for External Cloud Exposures via SSL Certs
Scanning the Internet for External Cloud Exposures via SSL Certs
 
CloudStudio User manual (basic edition):
CloudStudio User manual (basic edition):CloudStudio User manual (basic edition):
CloudStudio User manual (basic edition):
 

May cleantechreport

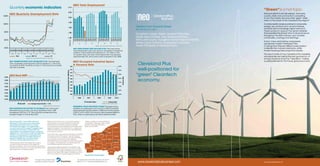
  • 1. NEO Total Employment Quarterly economic indicators 2.10 “Green” is a hot topic. 2.05 NEO Quarterly Unemployment Rate Everyone seems to be discussing it, and every 12.6% country, state and community is competing 2.00 to win the industry. But what does “green” really mean to the future of the Cleveland Plus region? 1.95 10.5% As states rapidly develop policies for renewable 1.90 Cleveland Plus Economic Review ® energy use, products such as wind turbines May 2010 Volume 4, Issue 1 and solar are in increasingly higher demand. 8.3% These products require the same materials 1.85 that propelled Northeast Ohio to its prominence Our partners include: Greater Cleveland Partnership, throughout the 20th Century, such as steel, 1.80 Greater Akron Chamber, Stark Development Board, composites, coatings and bearings. Team Lorain County, Youngstown-Warren Regional Chamber, 2005 2006 2007 2008 2009 2010 2005 2006 2007 2008 2009 2005 2006 2007 2008 2009 2005 2006 2007 2008 2009 2004 2004 2004 2004 6.2% (Millions) In fact, many wind turbine components Q1 Q2 Q3 Q4 Medina County Economic Development Corporation, are already made in Northeast Ohio. Source: Ohio Labor Market Information (LAUS Data) Growth Partnership of Ashtabula County Coatings from Sherwin-Williams help protect 4.0% NEO EMPLOYMENT SEES DECLINE IN Q1 This chart shows materials from nature’s elements, while total employment year over year for comparison of seasonal Timken bearings help propel the blades. Q1 Q2 Q3 Q4 Q1 Q2 Q3 Q4 Q1 Q2 Q3 Q4 Q1 Q2 Q3 Q4 Q1 Q2 Q3 Q4 Q1 Q2 Q3 Q4 Q1 Q2 Q3 Q4 Q1 patterns. Total employment declined to 1.87 million in the 2003 2004 2005 2006 2007 2008 2009 2010 1st quarter. Year over year, total employment has declined This report looks at how Cleveland Plus industries Ohio NEO 16 US approximately 2%, and is down 6.6% compared to Q1 2008. and expertise are fueling the next generation of Source: Ohio Labor Market Information (LAUS Data) energy products, known as “Cleantech,” making NEO UNEMPLOYMENT RATE INCREASES IN Q1 The Northeast NEO Occupied Industrial Space us well-positioned for the future global economy. Ohio unadjusted unemployment rate increased to 11.6% in the 1st quarter of 2010. The State of Ohio (11.7%) and the U.S (10.4%) 406 & Vacancy Rate 9.5% Cleveland Plus well-positioned for also saw increases. 404 9.0% Occupied Square Feet (Millions) “green” Cleantech 402 8.5% NEO Real GRP in billions 400 $190 Vacancy Rate economy. 398 8.0% 0.6% $180 2.4% (-.7%) 1.8% (-1.8%) 396 2.6% 1.2% 0.3% 1.2% 7.5% $170 (-1.9)% (-6.4%) 4.8% 394 $160 3.0% 7.0% 3.8% 392 $150 5.1% 6.5% 390 $140 388 6.0% Q3 Q1 Q2 Q4 Q1 Q2 Q3 Q4 Q1 Q2 Q3 Q4 Q1 Q2 Q3 Q4 Q1 $130 2006 2007 2008 2009 2010 $120 1994 1995 1996 1997 1998 1999 2000 2001 2002 2003 2004 2005 2006 2007 2008 2009 2010 Occupied Space Vacancy Rate Real GRP Average Annual Growth = 1.5% Source: CoStar Industrial Data Source: Moody’s Economy.com INDUSTRIAL SPACE RELATIVELY STABLE This graph shows GRP ESTIMATES PROJECTED TO INCREASE The most recent quarterly occupied space and vacancy rates for industrial estimates from economy.com show Northeast Ohio’s GRP space between the first quarter of 2006 and the first quarter increasing in 2010 by 3.1%. This is the first increase since the of 2010. In Q1 of 2010, the vacancy rate increased slightly to recession began in December 2007. 8.5%, while occupied space remained relatively stable. About Team NEO : Team NEO advances Moody’s Economy.com county level output, These counties include Ashtabula, Northeast Ohio’s economy by attracting employment and payroll historical data are Cuyahoga, Geauga, Lake, Lorain, businesses worldwide to the 16-county estimated from several publicly available Medina, Portage, Richland, Cleveland Plus region. The organization sources and are summarized into the Team NEO Stark and Summit. Ashtabula is a joint venture of the region’s largest metro regional footprint. It is important to understand Lake chambers of commerce. Since 2007, the data provided by Economy.com are estimates organization has attracted 33 new company of economic activity. expansions or relocations, 3,200 new jobs and Cleveland Geauga $100M in annual payroll to Northeast Ohio, Team NEO also uses data from federal and state Cuyahoga leading to a total annual regional payroll sources as part of the report. We rely heavily Lorain Trumbull benefit of $260M. For more information, on data from the U.S. Bureau of Labor Statistics visit www.clevelandplusbusiness.com. (www.bls.gov) and Ohio’s Labor Market Summit Portage Information (www.lmi.state.oh.us) for information Medina Akron Youngstown Data Sources: Team Northeast Ohio uses a on wages, unemployment and both general Mahoning number of data sources for the Regional and industry-specific employment. Economic Review. One of the primary sources is Ashland Industrial real estate data for this edition was Wayne Canton Columbiana the Moody’s Economy.com (www.economy.com) Richland Stark Northeast Ohio modeling system. derived from the CoStar Group. Due to market limits within the CoStar database, historic trend data for the Team NEO region is defined as 10 of Carroll the 16 counties forming the regional footprint. Cleveland Plus 16-County Region This report made possible through 737 Bolivar Road, Suite 2000, Cleveland, Ohio 44115 FPO the generous support of Dominion. 888.NEO.1411 • www.clevelandplusbusiness.com www.clevelandplusbusiness.com www.clevelandplusbusiness.com
  • 2. Cleveland Plus Manufacturing Expertise Offers Defining the “Cleantech” Cleveland Plus Cleantech Supply Chain Strong Base for Cleantech Supply Chain Industry Stronger than U.S. Average Key Cleantech supply chain industries are much stronger in Northeast Ohio than the national average. Location Many of the products in the Cleantech supply chain are the same materials and components used in automotive, Cleantech is a fairly new term, and new industry. Quotients (LQ) show how prominent a certain industry is compared to the U.S. as a whole. As indicated in this LQ chart, aerospace and other more traditional manufacturing industries. Northeast Ohio is home to hundreds of companies According to Wikipedia, “Cleantech” is a term used Northeast Ohio LQ values are significantly higher in many Cleantech supply sectors. For instance, Fabricated Metal has that are leaders in their fields, producing components for the Cleantech economy. The industries that the California to describe knowledge-based products or services an LQ value of almost 6 in Northeast Ohio, meaning that the Cleveland Plus region is producing 600% more fabricated Green Digest defines as part of the Cleantech supply chain collectively represent $12.5 billion (7.5%) of Northeast that improve operational performance, productivity, metal than the national average. With so much capacity, Northeast Ohio is poised to export goods to wind turbine Ohio’s economy today and are projected to grow more than 20% between 2010 and 2015. This sector represents or efficiency while reducing costs, inputs, energy manufacturers globally. 36% of all manufacturing in Cleveland Plus. consumption, waste, or pollution. As part of an ongoing effort to analyze the emergence Concentration of Cleantech Northeast Ohio GRP for Top 10 of a “green” economy, the California Labor Market Information has put together a California Green Digest Supply Chain in Cleveland Plus Cleantech Related Manufacturing Sectors that defines manufacturing inputs to the “Cleantech” supply chain. The Digest aggregates national studies Other Nonmetallic Mineral Products to define the inputs required to manufacture Cleantech Plastics Products Paint, Coating and Adhesives devices, such as wind turbines. Materials, components Clay Product and Refractory and products required for these devices include steel, Bolier, Tank, and Shipping Containers Foundries plastics and coatings, much of which is already made Other General Purpose Machinery Rubber Products in Northeast Ohio, or holds opportunity based on the Paint, Coating and Adhesive region’s assets. Architectural and Structural Metals Rubber Products Printing and Related Support Activities Foundries Other Fabricated Metal Products Basic Chemicals Iron and Steel Mills and Ferroalloy Iron and Steel Mills and Ferroalloy Other General Purpose Machinery 0.00 1.00 2.00 3.00 4.00 5.00 6.00 7.00 8.00 Northeast Ohio LQ National Plastics Products manufactures Average LQ Value Source: Economy.com and California LMI Other Fabricated Metal Products many turbine components. $0 $200 $400 $600 $800 $1,000 $1,200 $1,400 $1,600 $1,800 Cleantech Industries Millions 2009 Source: Economy.com and California LMI Propelled by Strong Workforce The Cleveland Plus workforce is well positioned to meet the demand to build Cleantech products. The organization O-NET, a branch of the U.S. Department of Labor, has identified green related occupations expected to see a significant increase in demand due to the emergence of Cleantech related industries. In many of these occupations, Cleveland Plus has an above average share of workers. Of the 27 increased demand occupations identified, Cleveland Plus has more than 130,000 workers, and 20 of these occupations have an LQ at 1 or above. This means that Cleveland Plus is not a sampling Windmill Blades + Cardinal Fastener & Specialty Co., Inc. only producing Cleantech products, but the workforce needed is already in place. of companies . + Dyson Corporation + ITW Anchor Fasteners Top 10 Occupations for that are making + Summit Machine, Ltd. Cleantech Related Supply Chain wind components Gearbox + Federal Gear today + American Friction Technologies Total of All Green Increased Demand Occupations + Kaydon Corporation Laborers and Material Movers First-Line Supervisors of Production Hub & Structure “The Sherwin-Williams Company has developed industry Mixing & Blending Machine Operators + The Timken Company leading coatings technologies at its Cleveland-based + Elyria Foundry Company Chemical Equipment Operators & Tenders research & development center to support our nation’s growing investment in alternative energy assets. Tower Industrial Production Managers With regional manufacturing strength in steel, + NSK Industries Incorporated Materials Scientist fiberglass, resins, electronic control systems, + Stahl Gear and Machine Co. Drilling & Boring Machine Tool Setters and storage capabilities, Northeastern Ohio offers + Jacobson Mfg., LLC significant opportunities for partnerships in this fast Plastics Product Cutting, Punching & Press Machine Setters growing market.” Coatings Computer-Controlled Machine Tool Operators + Sherwin-Williams Christopher M. Connor, Chairman & CEO, The Sherwin-Williams Company 0.00 0.50 1.00 1.50 2.00 2.50 3.00 3.50 LQ National LQ Value Source: O-NET and Bureau of Labor Statistics Source: Great Lakes Wind Network Average