Poster64: QTL mapping of resitance to Thips palmi Karny in common bean (Phaseolus vulgaris L.)
•
0 likes•614 views

Poster for CIAT 2009 Knowledge Sharing Week
Recommended

Recommended
More Related Content
What's hot
What's hot (20)
Viewers also liked
Viewers also liked (7)
Similar to Poster64: QTL mapping of resitance to Thips palmi Karny in common bean (Phaseolus vulgaris L.)
Similar to Poster64: QTL mapping of resitance to Thips palmi Karny in common bean (Phaseolus vulgaris L.) (20)
More from CIAT
More from CIAT (20)
Recently uploaded
Recently uploaded (20)
Poster64: QTL mapping of resitance to Thips palmi Karny in common bean (Phaseolus vulgaris L.)
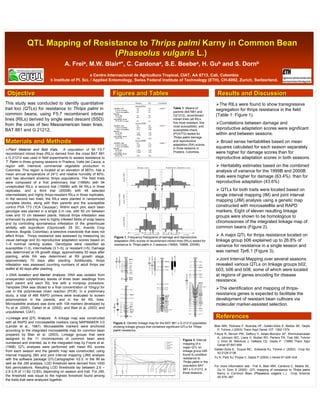
- 1. QTL Mapping of Resistance to Thrips palmi Karny in Common Bean (Phaseolus vulgaris L.) A. Freia, M.W. Blaira*, C. Cardonaa, S.E. Beebea, H. Gub and S. Dornb a Centro Internacional de Agricultura Tropical, CIAT, AA 6713, Cali, Colombia b Institute of Pl. Sci. / Applied Entomology, Swiss Federal Institute of Technology (ETH), CH-8092, Zurich, Switzerland. Objective Figures and Tables Results and Discussion This study was conducted to identify quantitative The RILs were found to show transgressive trait loci (QTLs) for resistance to Thrips palmi in Table 1. Means of segregation for thrips resistance in the field parents (BAT881 and common beans, using F5:7 recombinant inbred G21212), recombinant (Table 1: Figure 1). lines (RILs) derived by single seed descent (SSD) inbred lines (all RILs, from the cross of two Mesoamerican bean lines, five most resistant, five Correlations between damage and most susceptible), and BAT 881 and G 21212, susceptible check reproductive adaptation scores were significant (PVA773) tested for within and between seasons. Thrips palmi damage Materials and Methods and reproductive adaptation (RA) scores Broad sense heritabilities based on mean in three seasons in squares calculated for each season separately Plant Material and field trials. A population of 94 F5:7 recombinant inbred lines (RILs) derived from the cross BAT 881 Pradera, Colombia. were higher for damage scores than for x G 21212 was used in field experiments to assess resistance to reproductive adaptation scores in both seasons. T. Palmi in three growing seasons in Pradera, Valle del Cauca, a region with intensive commercial vegetable production in Heritability estimates based on the combined Colombia. This region is located at an elevation of 987m, has a analysis of variance for the 1999B and 2000B mean annual temperature of 24°C and relative humidity of 80%, and has abundant endemic thrips populations. The field trials trials were higher for damage (63.4%) than for were composed of a first preliminary trial (1999A) with 94 reproductive adaptation (43.6%) unreplicated RILs, a second trial (1999B) with 94 RILs in three replicates, and a third trial (2000B) with 48 selected QTLs for both traits were located based on intermediately and highly thrips-resistant RILs in three replicates. single interval mapping (IM) and joint interval In the second two trials, the RILs were planted in randomized mapping (JIM) analysis using a genetic map complete blocks, along with their parents and the susceptible control PVA 773 (‘ICA Caucaya’). Within each plot, each bean constructed with microsatellite and RAPD genotype was planted in a single 2-m row, with 50 cm between markers. Eight of eleven resulting linkage rows and 10 cm between plants. Natural thrips infestation was groups were shown to be homologous to enhanced by planting next to highly infested fields of snap beans and by controlling spontaneous infestation of the greenhouse chromosomes of the integrated linkage map of whitefly with buprofezin (Oportune®, 25 SC, Aventis Crop common beans (Figure 2). Science, Bogotà, Colombia), a selective insecticide that does not affect thrips. Thrips resistance was assessed by measuring (a) Figure 1. Frequency histograms of damage and reproductive A major QTL for thrips resistance located on visual damage and (b) reproductive adaptation scores based on adaptation (RA) scores of recombinant inbred lines (RILs) tested for linkage group b06 explained up to 26.8% of 1–9 nominal ranking scales. Genotypes were classified as resistance to Thrips palmi in 3 seasons (1999A, 1999B, 2000B). variance for resistance in a single season and susceptible (1-3), intermediate (3.1–5), or resistant (>5). Damage was determined at V6 growth stage, approximately 50 days after was named Tpr6.1 (Figure 3). planting, while RA was determined at R9 growth stage, approximately 70 days after planting. Additionally, thrips Joint Interval Mapping over several seasons infestation was assessed counting numbers of adult thrips per revealed various QTLs on linkage groups b02, leaflet at 40 days after planting. b03, b06 and b08, some of which were located DNA Isolation and Marker Analysis: DNA was isolated from at regions of genes encoding for disease unexpanded cotyledonary leaves of three bean seedlings from resistance. each parent and each RIL line with a miniprep procedure. Template DNA was diluted to a final concentration of 10ng/µl for The identification and mapping of thrips- use in the polymerase chain reaction (PCR). In a preliminary study, a total of 466 RAPD primers were evaluated to screen resistance genes is expected to facilitate the polymorphism in the parents, and in the 94 RIL lines. development of resistant bean cultivars via Microsatellite analysis was done with 108 markers developed by molecular marker-assisted selection. Yu et al. (2000), Gaitan et al. (2002), and Blair et al. (2003; and unpublished, CIAT). Linkage and QTL Analysis: A linkage map was constructed References with all RAPD and microsatellite markers using MAPMAKER 3.0 Figure 2. Genetic linkage map for the BAT 881 x G 21212 population (Lander et al., 1987). Microsatellite markers were anchored showing linkage groups that contained significant QTLs for Thrips Blair MW, Pedraza F, Buendia HF, Gaitán-Solís E, Beebe SE, Gepts according to the integrated microsatellite map for common bean palmi resistance. P, Tohme J (2003) Theor Appl Genet 107: 1362-1374. prepared by Blair et al. (2003). Linkage groups that were Freyre R, Skroch PW, Geffory V, Adam-Blondon AF, Shirmohamadali assigned to the 11 chromosomes of common bean were A, Johnson WC, Llaca V, Nodari RO, Periera PA, Tsai SM, Tohme Figure 3. Interval J, Dron M, Nienhuis J, Vallejos CE, Gepts P (1998) Theor Appl numbered and oriented, as in the integrated map by Freyre et al. mapping of a Genet 97:847-856 (1998). QTL analyses were performed with mean RIL scores major QTL on Gaitán-Solís E, Duque MC, Edwards KJ, Tohme J (2002). Crop Sci from each season and the genetic map was constructed, using linkage group b06 42:2128-2136 interval mapping (IM) and joint interval mapping (JIM) analysis found to condition resistance to Yu K, Park SJ, Poysa V, Gepts P (2000) J Hered 91:429–434 with the software package QTLCartographer V2.0. In the IM as Thrips palmi in the well as the JIM analysis, LOD threshold were derived from 1000 population BAT For more information see: Frei A, Blair MW, Cardona C, Beebe SE, fold permutations. Resulting LOD thresholds lay between 2.6 – 881 x G 21212, in Gu H, Dorn S (2005) QTL mapping of resistance to Thrips palmi 2.8 (LR of 11.82-12.83), depending on season and trait. For JIM, three seasons. Karny in Common Bean (Phaseolus vulgaris L.). Crop Science the threshold was equal to the highest threshold found among 45:379–387. the traits that were analyzed together.