SlideShare ist ein Scribd-Unternehmen logo
1 von 62
Downloaden Sie, um offline zu lesen
14
Assessing the Effect of Policy
Interventions on Small Arms
Demand in Bogotá, Colombia
Katherine Aguirre, Óscar Becerra, Simón Mesa y Jorge A. Restrepo
Diciembre, 2009
ISSN: 1909 – 1397
CERAC – Centro de Recursos para el Análisis de Conflictos
Calle 55 No. 5 – 22
Tel: 2170200
Bogotá, Colombia
www.cerac.org.co
El Centro de Recursos para el Análisis de Conflictos (CERAC) es un centro
de investigación privado e independiente, especializado en la generación
de recursos para la investigación sobre violencia, el análisis de conflictos
armados y el estudio de sus impactos sobre el desarrollo socioeconómico
y el bienestar de las personas. CERAC no tiene filiación partidista o
gubernamental alguna. CERAC busca contribuir a la reducción de la
violencia y su impacto sobre las personas, las comunidades y la
sociedad, mediante la investigación en ciencias sociales basada en
evidencia, el desarrollo de tecnologías e innovación, además de participar
en el diseño, implementación y evaluación de políticas públicas e
intervenciones dirigidas a reducir la violencia armada. (Para mayor
información visítese: http://www.cerac.org.co/acercade.htm)
La Serie Documentos de CERAC son publicaciones ocasionales de los
resultados preliminares y avances de investigación de los miembros de
CERAC, sus investigadores asociados, o de investigadores que han hecho
uso de los recursos del Centro. Estos documentos son trabajo en curso, y
como tal, están sujetos a modificaciones. Sus autores agradecen la
retroalimentación y comentarios de los lectores. El contenido de los
documentos de la Serie no representa la posición oficial de CERAC, los
miembros de sus organismos de dirección o las entidades que proveen
apoyo al centro.
Sobre los autores
Katherine Aguirre es economista de la Universidad del Valle. Ha sido
investigadora de CERAC desde 2005 donde trabaja en temas relacionados
con violencia armada y desarrollo.
Oscar Becerra es economista de la Universidad Nacional de Colombia y
tiene una maestría en Matemáticas Aplicadas de la misma universidad.
Actualmente es asistente de investigación del Banco Interamericano de
Desarrollo.
Simón Mesa es economista de la Universidad de los Andes. Actualmente
es Economista de la Dirección Técnica de la Empresa de Renovación
Urbana en Bogotá.
Jorge Restrepo es Profesor Asociado del Departamento de Economía de la
Pontificia Universidad Javeriana. Economista de esta misma universidad,
con estudios de postgrado en economía en la Universidad de Cambridge y
el Royal Holloway College-Universidad de Londres, donde obtuvo grados
de MSc y PhD en economía. Es Director y fundador de CERAC.
The Conflict Analysis Resource Center (CERAC) is a private an
independent think tank, focused in the generation of resources to study
violence, armed conflicts and their impact on social and economic
development and people’s welfare. CERAC does not have any partisan or
governmental affiliation. The Center aims to contribute to the reduction of
violence and its impact on individuals and communities, through social
science research based on verifiable information; the development of
technologies and innovation, and the involvement in the design,
implementation and evaluation of public policies and interventions. (For
more information, visit: www.cerac.org.co/aboutus.htm)
The Working Papers Series of CERAC are occasional publications of
preliminary research outputs and results of its staff members, its
associated researchers, or from researchers that have used the resources
of the Center. These documents are work in progress, and thus, are
subject to changes. Their authors welcome feedback and comments of
readers. The content of the Working Papers Series does not represent
CERAC´s points of view, the members of their direction organisms or the
entities that provide support to the Center.
About the authors
Katherine Aguirre holds a B.S. in economics from the Universidad del
Valle. She has been a researcher at CERAC since 2005 where she studied
topics related with armed violence and development.
Oscar Becerra holds a M.Sc. in applied mathematics and a B.S. in
economics from the Universidad Nacional de Colombia. Currently Oscar is
working as Research Assistant at the Research Department of the Inter
American Development Bank.
Simón Mesa holds a B.S. in economics from the Universidad de los Andes.
Currently is economist of the Empresa de Renovación Urbana in Bogota.
Jorge Restrepo is Associate Professor of the Department of Economics of
the Pontificia Universidad Javeriana. He holds a B.S. in economics from
this university. Also studied at the Cambridge University and the Royal
Holloway College-University of London, where he obtained MSc and PhD
degrees in economics. He is director and founder of CERAC.
Este es un documento de trabajo que
ha sido posible gracias al apoyo de:
Documentos de trabajo cerac – número 14 – diciembre 2009 1
documentos de trabajo cerac
número 14
diciembre de 2009
Assessing the Effect of Policy Interventions on
Small Arms Demand in Bogotá, Colombia
Katherine Aguirre, Óscar Becerra, Simón Mesa and Jorge A. Restrepo
* **
Resumen: In this document, we assess the market associated with the criminal use of
firearms. This assessment will distinguish demand for firearms along two main axes: the
markets in which they can be obtained (legal and illegal markets) and how individuals use
them (criminally and non-criminally).
Specifically, we will explore the impact that active anti-gun policies and other security
interventions, established in the mid-1990s, had on reducing firearm-related homicides in
Bogotá. After reviewing the general context, we will introduce the policies that have
been implemented by local administrations during the period in which the homicide rate
fell drastically. We then use a variety a statistical methods to assess the impact of gun-
carrying and violence reduction interventions on homicide in Bogotá. The last section
concludes.
*
Katherine Aguirre is researcher at CERAC. Óscar Becerra is working as Research Assistant at the Research Department of the Inter American
Development Bank. Simón Mesa is economist of the Empresa de Renovación Urbana in Bogotá. Jorge A. Restrepo is Associate Professor of the
Department of Economics of the Pontificia Universidad Javeriana and Director of CERAC. Corresponding author katherine.aguirre@cerac.org.co
**
Brodie Ferguson contributed significantly to improve the quality of this report. CERAC also wants to acknowledge the help from the several
institutions that contributed in making data available for this study, including the Centro de Estudios y Análisis en Convivencia y Seguridad Ciudadana
from the Mayorship of Bogotá, the Centro Nacional de Referencia sobre Violencia from the Instituto Nacional de Medicina Legal y Ciencias Forenses,
the Centro de Investigaciones Criminológicas-CIC from the National Police of Colombia, the Military Industry of Colombia (Indumil) and the
Departamento de Control y Comercio de Armas, Municiones y Explosivos (DCCAE)
Documentos de trabajo cerac – número 14 – diciembre 2009 2
TABLE OF CONTENTS
1. Study objectives ............................................................................................................................................................................ 3
2. Context........................................................................................................................................................................................... 4
2.1 The Small Arms Demand Model...................................................................................................................................... 4
2.2 Preferences and Small Arms Demand Realization......................................................................................................... 4
2.3 Firearms and Prices............................................................................................................................................................. 7
2.4 Resources.............................................................................................................................................................................. 8
3. Firearms Demand in Bogotá..................................................................................................................................................... 10
3.1 Legal Demand.................................................................................................................................................................... 10
3.2 Illegal Demand and compliance with firearms regulations......................................................................................... 15
3.3 Demand for Use: Firearms Deaths in Bogotá.............................................................................................................. 24
4. Interventions ............................................................................................................................................................................... 41
4.1 Mayoral Administrations.................................................................................................................................................. 41
4.2 Police Enforcement .......................................................................................................................................................... 42
4.3 Arms and Alcohol Interventions .................................................................................................................................... 42
5. Intervention Effects................................................................................................................................................................... 45
5.1 Perception Surveys: Subjective Indicators..................................................................................................................... 45
5.2 Impact of Firearm control on the Homicide Level in Bogotá................................................................................... 47
6. Conclusions ................................................................................................................................................................................. 52
7. References.................................................................................................................................................................................... 53
8. Annex 1........................................................................................................................................................................................ 55
9. Annex 2........................................................................................................................................................................................ 59
Documentos de trabajo cerac – número 14 – diciembre 2009 3
1. STUDY OBJECTIVES
In Bogotá, some 50,000 people died in firearm-related
events between 1979 and 2009. This constitutes roughly 8% of
the total number of deaths, by natural or external causes,
registered in the Colombian capital. While the impact of
firearms in Bogotá is smaller than in Colombia as a whole,
where approximately 11% of deaths have been attributed to
firearms, Bogotá contributed 10% of all firearms deaths in
Colombia over the period 1979 to 2009. In Bogotá as in the
rest of Colombia, homicides are the primary event through
which firearms deaths occur (more than 90% of cases).
In 2009, there were over 15,000 homicides registered in
Colombia. Despite an impressive reduction since 2002 (26.8%),
and this figure being the lowest in more than 20 years, the
homicide rate in Colombia continues to rank as one of the
highest in the world, if not the highest. Improvements in the
city of Bogotá have contributed substantially to the overall
reduction in homicides. The city has experienced an impressive
reduction of homicide violence since its peak in 1993, when the
number of homicides rose from 3,000 in 1992 to almost 4,500,
a 33% increase. According to the National Police, the figure of
2009 of Bogotá was 1,327 a reduction of around 70% with
respect to the 1993 level. The current homicide rate of 18 per
100,000 inhabitants is still quite high, but contrasts with the rate
of 1993 of 80 per 100.000. The contribution of Bogotá to the
total number of homicides of the country has not declined at
the same speed as the level of homicides. For the 2007, the
Ministry of Defence says that the capital contribute with 32.7
per cent in the decrease of the homicides in the whole country
(Bogotá.gov.co, 2006).
Violence in Colombia is a result of two interconnected
complex social phenomena. The first is the prevalence of
entrenched criminal organisations, mainly involved in the
production and transport of illegal narcotics. The second is the
three-sided armed conflict between the government, guerrilla
groups and paramilitary groups (Aguirre et, al., 2006; p2). The
situation in Bogotá is influenced more by common urban
delinquency by conflict dynamics.
In this document, we assess the market associated with
the criminal use of firearms. Recent academic studies
highlighted demand for firearms for violent use (Brauer and
Muggah, 2005). This assessment will distinguish demand for
firearms along two main axes: the markets in which they can be
obtained (legal and illegal markets) and how individuals use
them (criminally and non-criminally).
Specifically, we will explore the impact that active anti-
gun policies and other security interventions, established in the
mid-1990s, had on reducing firearm-related homicides in
Bogotá. After reviewing the general context, we will introduce
the policies that have been implemented by local
administrations during the period in which the homicide rate
fell drastically. We then use a variety a statistical methods to
assess the impact of gun-carrying and violence reduction
interventions on homicide in Bogotá. The last section
concludes.
Documentos de trabajo cerac – número 14 – diciembre 2009 4
2. CONTEXT
2.1 The Small Arms Demand Model
The subject of demand for small arms has been relatively
neglected in the academic literature. Brauer and Muggah (2005)
note that policy emphasis has been on the “supply-side of the
small arms market,” such as export-control regimes, weapon
registries, and arms and ammunition marking and tracing.
Nonetheless, many acknowledge supply-side policies have
limited effectiveness due to the nature of small arms and the
political economy of production and distribution. Brauer
(2004) argues that small arms are “harder to reign in from the
supply-side since, by definition, they are relatively easy to
produce, transport, hide and smuggle, they are durable and
long-lasting, and, moreover, control regimes require a
sophistication of internal and global coordination beyond the
capacity of many states to implement” (Brauer, 2004).
Recently, however, the demand for small arms has
received increasing attention in both research and policy arenas.
The demand model of the Small Arms Survey (hereafter, SAS)
posits that demand can be explained by the confluence of
individual’s preferences, their resources, and small arms prices.
Brauer and Muggah (2005) elegantly articulate the concept
thusly:
“The ultimate expression of demand for small arms
acquisition is governed by the interplay of motivations
and means. In the extreme, a surfeit of means will
not result in arms acquisition if accompanied by an
utter lack of motive; conversely, the highest degree of
motivation will not result in acquisition if the means –
as broadly defined as we propose – are lacking. Both
aspects must join for a choice to be made, for demand
to be expressed, and for acquisition to take place.”
According to the proposed model, resources may be
monetary or non-monetary. Non-monetary resources include
innate talent, education, strength, convictions, personal
attributes, and personal or institutional resources as connections
with other individuals. Prices are not only firearm prices, but
relative prices of substitute and complementary goods. Brauer
asserts that substitute goods are often expensive relative to
complementary goods. For example, the cost of moving into a
safer neighbourhood may be substantially greater than that of
purchasing a firearm, since this includes not only time and
money spent moving, but also the likelihood that property in
the safer neighbourhood is more costly.
Brauer and Muggah (2005) note that complementary
goods prices, such as bullets and explosives, tend to be less
expensive than substitute goods, and prove to be as effective as
firearms. Brauer argues that analysis of small arms demand must
consider an individual’s preferences in conjunction with his or
her resources and the prices of alternate goods.
Albeit consistent with economic theory, it is necessary
to recognise that this model will need to take into account the
differential circumstances of the demand of firearms with
criminal intent. For a common criminal or a member of a
criminal organisation, the firearm is a capital good required in
order to engage in predatory activities. In an environment of
high crime such as that in Colombia, common criminals seek
guns with the intent of defending themselves from authorities
and generating the sufficient threat in order to commit crimes.
In a criminal organisation, guns appear as the tool for violence
generation and for gaining control over areas of operations. In
both cases, preferences are clearly biased towards demanding a
gun to use it, much more in the case of organised crime. In the
case of organised crime, resources are not a hampering
influence for crime acquisition.
As we will argue in the following sections, the fact that
most of the violence in Colombia is generated by organised
criminal groups and groups in conflict with the state requires
the demand model to account for these particularities in order
to fully understand the limited impact that gun control might
have in the use of firearms.
2.2 Preferences and Small Arms Demand
Realization
While the demand model espoused by the SAS is consistent
with economic theory, its measurement poses certain
challenges. In our analysis of firearms demand in Bogotá, we
make a distinction between legal and illegal markets as well as
between criminal and non-criminal use.
In Colombia, two markets for small arms demand can
be recognized. The first market, legal and narrowly-regulated, is
completely controlled by the state through a commercial
organization known as the Military Industry (Indumil). At the
same time, an illegal market of unknown size thrives,
characterised by the availability of cheap firearms which are
unavailable through legal channels and stimulated by criminal
organisations and armed groups that have been operating for
more than four decades in the country.
Additionally, we propose that firearms can be used with two
types of intentions: non-criminal and criminal. All firearms
sought with non-criminal intention are considered legal, while
Documentos de trabajo cerac – número 14 – diciembre 2009 5
those sought with criminal intention may be legal or illegal1. In
Colombia, the legal use of firearms is subject to the holding or
carrying permit with which they are issued (Chart 1).
In the case of non-criminal demand, it is plausible to
argue that the initial motivation for demand could be
protection, status or even fetishism. In each of these cases, the
SAS demand model would be an appropriate explanatory model
of demand.
In the case of criminal use, however, firearms demand
follows a different choice procedure. In this case, the
alternatives that preferences must order, viability must finance
and prices will determine are different from the simple decision
of whether or not to buy a gun for its eventual use or for the
feeling of safety that it might convey. In the case of criminal
demand for use, the decision process and the application of
rational analysis does not appear to be so challenging, as in this
case there is a much smaller distance between the demand for
possession and the demand for use. Criminal behaviour, in
fact, requires the use of violence, and in this case, small arms
can be closely interpreted like a capital investment in the
production of criminal control. Furthermore, the substitutes
for firearms for criminal purposes are rather different than the
substitutes for firearms for “legitimate” or legal ownership.
In order to assess legal demand for firearms, we
examine acquisition statistics from the Office for Firearm
Control and Trade of the Ministry of Defence (OCCA) since
1994 and until 2005 (August). Data on illegal demand,
however, is considerably difficult to obtain as it cannot be
directly measured. In order to assess illegal demand, we analyze
Police data on firearms confiscation, and legality of firearms
involved in criminal events, and the types of crime which
involve them. General firearms demand may be gauged
through assessing demand for homicidal use of the weapon.
Since more than 90% of the total deaths by firearms in Bogotá
are homicides, demand for homicidal use of a firearm is a good
proxy for criminal use of firearms and thus for the robustness
of the illegal market. For this purpose, we make use of data
from the National Institute of Legal Medicine and Forensic
Sciences (IMLCF) on homicides in Bogotá, and from the
National Department of Statistics (DANE) and Police (CIC)
(Chart 2). This is based on the strong assumption that most
homicide weapons are illegal. Still, as we do not have complete
time series for the type of weapons used in homicides according
to their legality, we use this as the best proxy available.
1
The acquisition of an illegal firearm is in itself a crime punished by
law, hence, there are no illegal arms for non-criminal use.
Documentos de trabajo cerac – número 14 – diciembre 2009 6
Chart 1. Small arms demand: the legal and illegal market, and criminal and non-criminal demand.
Source: CERAC
Chart 2. Datasets used to assess the Small Arms Demand in Bogotá
Firearms
Demand
Criminal
(Source: Medicina Legal,
Police)
Non criminal
Illegal
(Source: Police)
Legal
(Source: Police)
Legal
(Source: OCCA)
Carrying Holding
Illegal
Non
Criminal
Source: Medicina
Legal and Police
Criminal
Source:
DCCA
Legal
Source: CERAC
Documentos de trabajo cerac – número 14 – diciembre 2009 7
2.3 Firearms and Prices2
As mentioned above, we distinguish between two main markets
for small arms: legal and illegal. Price formation in either of
these markets depends on the specific features of each one. In
this section, we briefly describe the prices that characterize each
of these markets.
Moreover, in Colombia, “legal costs” play an important role in
the demand for firearms. These are the costs incurred in order
to legally hold a registered firearm, or, inversely, the cost that
agents may be subject to pay if captured with an unregistered
firearm. The costs of obtaining a firearm in the legal market
vary depending on the type of weapon and the type of permit
sought. To start, there is a monetary cost for the weapon
acquired and the legal restrictions associated with certain
firearms. For example, Colombian firearms regulations (see
Box 1) stipulate that civilians may not receive authorization for
pistols and revolvers with a calibre greater than 0.38 inches
(Ministerio de Defensa, nd)3. Hence for assault rifles and all
other automatic weapons, the calibre is not relevant to the
present analysis as these types of weapons are outside the legal
reach of civilians. Table 1 shows the prices in 2006 which the
military industry sells to civilians and to companies.
According to Indumil the price of a “legal firearm”
(handguns, carbines and shotguns) ranges between (USD) $143
and $65,0004, while the price to obtain a permit is $51.74 (Table
2). The relevant price to consider in terms of the SAS demand
model, and for inter-country comparative purposes, is the one
for weapons for which the access to civilians is permitted: the
price ranges from $136 to $1,447 as shown in Table 1. Notice
that a civilian earning the minimum wage will need to devote
more than one months of work income in order to be able to
afford a revolver and its permit. In addition, the procedure for
obtaining a holding or carrying permit may take considerable
time and is subject to certain prerequisites. The individual must
pass a medical test, a battery of psychological tests, and a
training course in order to obtain the permit.
There is some circumstantial evidence that on the
illegal market, weapon prices are lower, however additional risks
are usually entailed. Although enforcement is not tight, under
the current regulation, the penalty for criminal use of a firearm
2 For a more detailed exposition, see the Small Arms Survey Colombia
study (Aguirre et. Al, 2006).
3 All of them are reserved to the Colombian Military Forces.
4 To put this in context, Colombian per capita GDP was USD$3,019 in
2005.
may include a prison term of up to 15 years5. In some cases, this
includes possessing the firearm without a license (a cost that the
person acquiring it legally must consider).
The illegal market offers buyers the possibility of
obtaining forbidden firearms (unavailable through the legal
market) at low cost. While a machine gun such as the M-60
(cal. 7.62) costs some $19,757 legally, the price is around
$10,000 on the illegal market. Pistols and revolvers can be
found since US$260. A new strategy of criminal users to avoid
prosecution and enforcement of gun restrictions is the renting
of firearms: there are several media reports sourced on the
police that point to the existence of places where criminal
organisations rent (and thus control property and use) of pistols
for US$86 a day (El Tiempo, 2006a). In certain cases, the price
of a weapon may be as little as 10% of the legal price6.
Finally, the prices of substitute and complementary
goods vary. In the legal market, the price of a cartridge
oscillates between $0.10 (for a Seller & Bellot 22L) and $5.00
(for a cartridge calibre 0.5), while the price of a grenade (IM-26)
is around $30 (Indumil, 2006). Explosives have a special
peculiarity in that firms can buy them legally for industrial use,
after review and permit approval from the military industry and
the military regulatory offices.7
Knifes and machetes, which appear frequently as
weapons both in criminal and conflict actions, are cheap and
widely available.
5 The penal code established that human rights violations with firearms
shall be punished with a prison sentence of up to 15 years. Production,
distribution, and use can be punished with prison sentences ranging
from 1 to 4 years. Prison sentences for carrying a weapon without a
permit range from 3 to 10 years, and for using it in a homicide, from 2
to 6 years.
6 In Colombia, the price of an Ingram machine gun made in illegal
workshops (popular arms workshops) is around USD$140, while the
price of an original Ingram is around USD$1,400 (Graduate Institute
of International Studies, 2004; 24). According to SEMANA Magazine
(Edition N° 887) the price difference between Indumil and Black
market prices is 56%, being the Indumil guns much higher than even
the quoted black market. (OXFAM, 2003)
7 The relation between firearms and explosives is complex -- they may
act as complementary or supplementary goods depending on the
situation. In a terrorist attack, for example, the ratio of firearms to
explosives used is different than in other types of attacks.
Documentos de trabajo cerac – número 14 – diciembre 2009 8
Table 1. Firearms Prices by Type, 2006
Table 2. Prices of gun permits, 2006
2.4 Resources
Colombia is a middle-income economy where most
members of the population can afford to purchase a
weapon if they so choose. This is evidenced by the
sizeable number of weapons in the hands of civilians
(currently more than 700.000 according to the
information provided by the OCCA) despite the
relatively large costs involved. Thus, while legal
weapons are not cheap and the paperwork required for
their acquisition is cumbersome (see Table 1), people
have nonetheless endeavoured to legally obtain
hundreds of thousands of firearms. Unfortunately, the
available data did not allow us to see how demand has
evolved over time making it impossible to see if there
is some income or price effect on demand for
weapons. Nor is there any means of correlating the
level of income or wealth of people with the number
of arms legally obtained.
As mentioned above, resources do not
constitute an impediment for firearms demand for
criminal or conflict use in the case of Colombia. There
have been several documented cases of massive illegal
arms deals in which criminal organisations, guerrilla
and paramilitary groups have been involved. The main
barriers to firearm acquisition are the complex logistics
involved in illegal deals and enforcement.
Category of Firearm Firearm Make COL$ USD$
Relative
Price to
Revólver
Relative to price
to daily
minimum wage
(USD$ 5,9)*
Handguns Pistol Llama Cal. 22 315,000 136.96 0.29 23.21
Pistol Jericho 9T Mod Cal 9mm 2,667,000 1,159.57 2.48 196.54
Revolver Llama Cal .38mm 1,205,000 523.91 1.12 88.80
Revolver Llama Scorpio Cal 32 1,075,000 467.39 1.00 79.22
Carabines and Shotguns Remington Cal .22 Mod 572 1,943,000 844.78 1.81 143.18
Sig/Sauer Carabine Cal 308 I5T 3,329,000 1,447.39 3.10 245.32
Remington Cal .12 Mod 87 266,700 115.96 0.25 19.65
Mossberg Cal .12 2,100,000 913.04 1.95 154.75
Source: Industria Militar. Processed: CERAC
* The montlhy minumun wage to 2006 is USD$178
Type of Permit COL$ USD$
Holding or Carrying Permit 119,000 51.74
Permit Renewal or copy 30,000 13.04
Permit for Second Firearm 30,000 13.04
Permit Renewal following suspension 593,000 257.83
Explosives and ammunition Permit 890,000 386.96
Social Tax 40,800 17.74
Source: Industria Militar
Documentos de trabajo cerac – número 14 – diciembre 2009
9
Box 1. Firearms Regulation in Colombia
Despite having a dismal human security record directly linked to firearms, the regulatory framework for firearms in Colombia is
well-designed and rather restrictive. This owes in part to the rise in criminal use of firearms during the eighties and early nineties,
which sparked the development and implementation of a whole new regime of firearm control.
Arms control legislation has a long history in Colombia. Regulation was implemented as early as 1947. Much later, in 1991, the new
political Constitution created the institutional space to design, issue and implement a new regulatory framework. The new
Constitution brought an avalanche of new regulations in all realms of the policy agenda, which overwhelmed the lobbying
capabilities of interest groups and allowed the implementation of ambitious reformist initiatives. Among these, National
Government Decree Number 2535 of 1993 regulated the production and trade of arms, munitions and explosives, as well as
carrying and holding permits for a small group of firearms.
The main pillar of the current regulatory framework is state ownership of all firearms and limited civilian access, in order
to effectively ration and control demand for possession. Only the State is authorized to produce, import, and sell firearms.
Decree 2535 established arms carrying to be a license given by the State rather than a right. It identified three types of
firearms: those limited to use by the armed forces (uso privativo), restricted-use guns (uso restringido) and civilian guns
(self-defense, sports or collection). The Ministry of Defense went even further, asserting that “the license of holding or
carrying a firearm can be given, suspended or removed whenever the competent authority deems necessary” (Pardo,
1995). Consequently, civilians and firms may request the issuance of a permit, but must also demonstrate the need for the
license. The Ministry of Defense Office for Control and Trade of Arms (OCCA) grants licenses subject to the justification
provided in the request.
Previous firearms legislation was similar in that the state provided a safe-conduct for the possession and carrying; however, the
system of registry and tracking was very poor. Decree 2535 improved the control of civilian possession and control of arms, and
encouraged civilian registration through a special amnesty whereby people were unconditionally granted a temporary holding
permit regardless of their current legal status. The Ministry of Defense reports that around 190,000 holding permits were issued
(see Table 3). The amnesty allowed people to relinquish their firearms to the State and even receive a monetary compensation for
doing so. All safe-conducts issued before 1994 had to be changed to the updated holding and carrying licenses (Bulla, 1995).
Decree 2535 stipulates that a holding permit authorizes its owner to hold a weapon in a declared building that may be his or her
residence, place of work, or any other place of possible danger. Only two holding licenses can be authorized for a civilian, and their
validity expires after ten years. The permit for carrying a firearm has some distinct characteristics. For example, the individual must
justify his or her particular security reasons for carrying a gun, and no more than two carrying permits are authorized per person. A
restricted-use gun license can be given if the individual justifies a risk of death. Article 4 specifically states that, although the state is
the sole owner of the firearm, the licensee is fully responsible for its use.
The regulatory framework also enables the political-administrative authorities, under an agreement with the military and police
authorities, to temporarily restrict or even ban the carrying of firearms in order to control urban crime (Bulla, 1995; Pardo, 1995).
This has been one of the main forms of arms control in the city of Bogotá.
The Colombian Congress, with the support of the National Government in 2006 passed legislation that, although it has some
provisions that strengthen the control and modernizes the Department of Arms Control and Trade, will lead to a greater supply of
guns on the streets. The law also increases the permissiveness in behavior and goes against local security initiatives, popular and
even led to greater state control and regulation of firearms (Comunidad Segura, 2009).
Documentos de trabajo cerac – número 14 – diciembre 2009 10
3. FIREARMS DEMAND IN BOGOTÁ
The assessment of small arms demand in Bogotá is somewhat
imperfect in that we cannot take into account certain factors
which affect individuals’ preferences for the demand for the use
of small arms, such as psychological behaviour. As shown in
section 2, we assess firearms demand by separately taking into
consideration two markets: legal (Section 3.1) and illegal
(Section 3.2).
We assess legal demand using official information
from the Ministry of Defence Office for Control and Trade of
Arms (OCCA) on the sale of arms in Colombia and Bogotá for
the period before and after 1994. Criminal demand is calculated
indirectly through analysis of vital statistics data from DANE
and National Police Centre for Criminological Research (CIC),
which contains information on the legal status of weapons used
in common crimes. To improve our understanding of the
criminal market, we incorporate data on firearms use (IMLCF)
which helps to clarify the demand for use in homicides of
firearms in Bogotá and highlights patterns in the criminal use of
such weapons since we consider that all illegal firearms are used
in criminal activities.
3.1 Legal Demand
In this section, we investigate patterns of firearms permit
acquisition in Bogotá relative to Colombia as a whole. Permit
acquisition is indicative of the preferences of those agents that
choose to purchase weapons directly from the State. Data from
OCCA allows us to identify who is seeking arms, the type of
permit they are seeking, and the type of firearm they wish to
acquire. The dataset contains information on 38 arms selling
depots, of which 35 are different from those of Bogotá and are
distributed around the country. The degree of demand for legal
firearms in Bogotá will be assessed using data on the types of
arms sought, the people seeking them, and the type of permit
issued for each weapon. In each of these cases, we will examine
any similarities in the contribution of demand in Bogotá to the
national total. The comparison becomes even more interesting
when we review differences in the acquisition of different
firearm brands in relation to the permit acquired in Bogotá and
in Colombia.
Unfortunately, the dataset does not include
information regarding the date on which the permit was
requested. The only temporal information has to do with the
information about weapons already in the hands of civilians
before and after 1994 and is only available at the national level.8
The OCCAE had issued a total of 706,210 firearm
permits to civilians by mid-2005. This figure includes the
235,696 registered firearms issued in the 1994 firearm amnesty,
when the new regulation entered into force. The 2005 figure
indicates a ratio of 1.53 legal arms per 100 civilians. But while
the number of legally registered firearms is lower than those of
its neighbours, it appears that Colombian civilians are arming
themselves in greater numbers (Aguirre, et. Al, 2006; p. 5)
The rate of legal firearms per 100 inhabitants in
Bogotá is 2.61, one point over the rate of Colombia. This could
be related with the big proportion of firearms bought by the
security companies and the people that do not lived in the city
but buy in the capital.
At the national level, both before and after 1994, the
firearm with the highest license participation was the revolver
(55% before 1994 and 62% after), however pistols gained in
popularity after 1994, increasing from 14% to 19% to become
the second most prevalent firearm (Table 3). Shotguns were
displaced from second place by pistols. This could be due to the
fact that the amnesty might have been more effective in urban
than rural areas, leading to a higher number of pistols to be
registered for the first time and less shotguns legalised
(Shotguns are less ‘movable’ weapons and are usually stored in
the houses and hamlets of rural areas, and are thus less prone to
be checked by authorities).
8 The fact that this is the cut-off year is explained for the new
regulation of firearms holdings that took place in that year and
included an amnesty.
Documentos de trabajo cerac – número 14 – diciembre 2009 11
Table 3. Arms acquisition by type before and after 1994
As Table 4 shows, more than 80% of the total permits
given in the period of amnesty were holding permits, pointing
to the fact that the amnesty allowed a proper regulation of
demand for private protection of property (the arm needs to be
stored at the property) rather than demand for private
protection of the person (which requires carrying it in particular
at urban centres).
Table 4. Permits issued before amnesty
Regarding the legal demand for firearms in Bogotá,
Table 3 shows arms acquisition behaviour since the 1994
amnesty through the beginning of 2005. Demand patterns by
type of firearm are very similar between Bogotá and the rest of
the nation. Around 60% of the demand is for revolvers while
15-20% is for pistols and shotguns. While the shotgun is the
second firearm demanded in the whole country, in Bogotá is
the pistol, with an important participation of 20 per cent.
One quarter of the legal Colombian demand for
firearms originates in Bogotá. This proportion varies little
among different types of weapons, such as revolvers, shotguns,
pistols and carbines, except for machine guns, submachine
guns, and assault rifles, where the proportion of this guns is
higher in Bogotá (see Table 4), although most of these permits
are given for carrying which allow for the arm to be moved
along the whole of the Colombian territory.
Table 3. Type of firearms demanded, Colombia and Bogotá
Table 4. Distribution of firearms registered in Bogotá in the
total since 1994
Category of Firearm
Quantity
Before 1994
Participation
(%)
Before 1994
Quantity
1994-2005
Participation
(%)
1994-2005
Monthy
Average
1994-2005
Total
Licensed
Revolver 130,736 55.5% 293,674 62.4% 2,144 424,410
Shotgun 54,578 23.2% 68,454 14.5% 500 123,032
Pistol 32,168 13.6% 90,482 19.2% 660 122,650
Carabine 11,298 4.8% 9,755 2.1% 71 21,053
Undetermined 2,902 1.2% 419 0.1% 3 3,321
Assault rifle 2,531 1.1% 3,315 0.7% 24 5,846
Submachine Gun 1,452 0.6% 4,379 0.9% 32 5,831
Machine Gun 31 0.0% 36 0.0% 0 67
Total 235,696 100.0% 470,514 100.0% 3,434 706,210
Source: OCCA
Processed by CERAC
Type of permit
Existent firearms
before 1994
%
Carrying 45,719 19%
Holding 189,977 81%
Total 235,696
Source: OCCA
Processed: CERAC
Colombia
Type of firearm Quantity Participation (total)
Revolver 424,410 60.1%
Shotgun 123,032 17.4%
Pistol 122,650 17.4%
Carbine 21,053 3.0%
Assault rifle 5,846 0.8%
Submachine gun 5,831 0.8%
Undetermined 3,321 0.5%
Machine Gun 67 0.0%
Total 706,210 100.0%
Bogotá
Type of firearm Quantity Participation (total)
Revolver 106,538 58.2%
Pistol 37,909 20.7%
Shotgun 26,857 14.7%
Carbine 4,718 2.6%
Submachine gun 3,575 2.0%
Assault rifle 3,218 1.8%
Undetermined 308 0.2%
Machine Gun 34 0.0%
Total 183,157 100.0%
Source: OCCA
Processed by CERAC
Type of firearm Colombia Bogotá Participation
Submachine gun 5,831 3,575 61.3%
Rifle 5,846 3,218 55.0%
Machine Gun 67 34 50.7%
Pistol 122,650 37,909 30.9%
Revolver 424,410 106,538 25.1%
Carbine 21,053 4,718 22.4%
Shotgun 123,032 26,857 21.8%
Undetermined 3,321 308 9.3%
Total 706,210 183,157 25.9%
Source: OCCA
Processed: CERAC
Documentos de trabajo cerac – número 14 – diciembre 2009 12
In terms of the acquirers and types of permits
registered, however, we observe a more divergent pattern
between Bogotá and Colombia as a whole (Table 5). While in
the capital city roughly 65% of the permits are for carrying a
firearm, in Colombia as a whole the figure is 57%. This
suggests that in Bogotá, people and firms demand an arm
overwhelmingly to carry it, while in the rest of the country
(including the countryside) guns are sought to be “stored” at
home or on the farm. This phenomenon can be related with
the security of politicians, diplomatic, merchants and people
with a high profile, who are concentrated in the capital.
Furthermore, this pattern prevails across all consumer profiles
and types of arms. For example, ordinary citizens in Bogotá
have a carrying permit for 75% of firearms, while the national
figure is 61%. Firms in Bogotá hold carrying permits for 45%
of their weapons, while this figure is 39% for the country as a
whole. This is consistent with the experience revealed to us by
the National Police: there are proportionally very few
households that hold guns in the city, which have lead to very
few cases in which, for example, an armed robbery of a
household leads to a two-way shooting or indeed the stealing of
guns. Taking into account that the latest estimated number of
households in the city is 1’934,828 according to the Quality of
Life Survey (2003), we estimate that there is approximately a
stock of 10 legal guns per 100 households in Bogotá, of which
only 3 are licensed to be kept at a fixed site. In total, more than
470,000 permits were issued in Colombia after the amnesty
enacted by the arms legislation of 1994. This is an average of
39,210 permits issued every year.
Table 5. Demand for firearms by holder and type of permit,
Colombia and Bogotá.
On the other hand, it seems to be a high degree of
demand for arms for protection “on the move” which is
consistent with a response to a pattern of criminality in which
kidnappings and armed attacks against vulnerable targets are
frequent. Table 6 shows that more than a half of the total
number of carrying permits for firms and foreigners are issued
in Bogotá. This is likely due to a higher prevalence of firms that
demand firearms (e.g., in order to protect property rights) as
well as a larger presence of foreigners (including multinational
executives in sectors at a higher risk of kidnapping) that require
security. The pattern is also seen in citizens, but with a lower
effect.
Table 6. Distribution of type of permit holders of Bogotá in
Colombia.
The demand for all types of firearms in Bogotá by type
of acquirer (Table 9) confirms this. Consumers in Bogotá,
particularly ordinary citizens, show a stronger preference for
revolvers over pistols and shotguns than the rest of the country.
Foreigners in Bogotá, on the other hand, show patterns of
demand which are consistently different than in the rest of the
country, seeking more sophisticated guns, like pistols. Also, it is
worth mentioning that outside Bogotá firms show a stronger
preference for shotguns, while pistols are more preferred in
Bogotá than in the rest of the country. This might be a result
of the different nature of the responsibilities which private
security companies in Bogotá have in comparison with those
operating in rural areas of the country.
Unfortunately, we are not able to differentiate demand
for the type of organisation –like some state agencies that are
subject of the requirement of registration (the DAS or
Departamento Administrativo de Seguridad, for example) or even the
demand for guns by specific sectors of the population (by age
group or occupation, like members of the armed forces). The
strong presence in Bogotá of these agencies or companies that
have national reach and coverage, means that some of these
guns, even if “based” in the city, can and do travel all over the
country.
Colombia
Type of ID Carrying % Holding % Total
Colombian citizen 348.885 61,1% 222.476 38,9% 571.361
Firms 51.861 38,7% 82.062 61,3% 133.923
Foreigner 365 39,4% 561 60,6% 926
Firearm Total 401.111 56,8% 305.099 43,2% 706.210
Bogotá
Colombian citizen 90.582 75,0% 30.134 25,0% 120.716
Firms 27.870 44,9% 34.139 55,1% 62.009
Foreigner 186 43,1% 246 56,9% 432
Firearm total 118.638 64,8% 64.519 35,2% 183.157
Source: OCCA
Processed by CERAC
Type of ID Carrying Holding
Colombian citizen 25.96% 13.54%
Firms 53.74% 41.60%
Foreigner 50.96% 43.85%
Firearm Total 29.58% 21.15%
Source: OCCA
Processed by CERAC
Documentos de trabajo cerac – número 14 – diciembre 2009 13
Table 7. Firearms demand, type and holder. Colombia and Bogotá
Table 8 compares the acquisition patterns of the ten
most popular weapons in the country. With the exception of
the Indumil and Remington brands, more than half of firearm
permits issued in Bogotá are for carrying. Llama9 (made by
Indumil) is the most acquired firearm brand in the country, and
26% of those acquired are registered in Bogotá (see Table 9).
Some 73% of the Llama firearms bought in the country are
registered with a carrying permit, while in Bogotá this rate falls
to 66%. The opposite pattern occurs with Smith & Wesson
firearms where in Bogotá, 72% of these are registered with
carrying permits while only 55% are in Colombia. Roughly one
quarter of Smith & Wesson permits were issued in Bogotá,
representing 31% of firearm sales in the city (Table 10).
9 A weapon of either Spanish or Colombian origin, as Indumil has
recently starting producing it.
Colombia
Type of firearm
Colombian
citizen
% of total
weapons
Foreigner
% of total
weapons
Firm
% of total
weapons
Total
% of total
weapons
Revolver 346,787 60.7% 326 35.2% 77,297 57.7% 424,410 60.1%
Shotgun 86,130 15.1% 212 22.9% 36,690 27.4% 123,032 17.4%
Pistol 111,390 19.5% 281 30.3% 10,979 8.2% 122,650 17.4%
Carbine 20,030 3.5% 89 9.6% 934 0.7% 21,053 3.0%
Assault rifle 1,709 0.3% 11 1.2% 4,126 3.1% 5,846 0.8%
Submachine gun 2,244 0.4% 6 0.6% 3,581 2.7% 5,831 0.8%
Undetermined 3,004 0.5% 1 0.1% 316 0.2% 3,321 0.5%
Machine gun 67 0.0% 0.0% 0.0% 67 0.0%
Total 571,361 926 133,923 706,210
Bogotá
Type of firearm
Colombian
citizen
% of total
weapons
Foreigner
% of total
weapons
Firm
% of total
weapons
Total
% of total
weapons
Revolver 69,201 57.3% 119 27.5% 37,218 60.0% 106,538 58.2%
Pistol 30,540 25.3% 155 35.9% 7,214 11.6% 37,909 20.7%
Shotgun 14,378 11.9% 82 19.0% 12,397 20.0% 26,857 14.7%
Carbine 4,414 3.7% 63 14.6% 241 0.4% 4,718 2.6%
Submachine gun 1,143 0.9% 4 0.9% 2,428 3.9% 3,575 2.0%
Assault rifle 727 0.6% 9 2.1% 2,482 4.0% 3,218 1.8%
Undetermined 279 0.2% 0.0% 29 0.0% 308 0.2%
Machine gun 34 0.0% 0.0% 0.0% 34 0.0%
Total 120,716 432 62,009 183,157
Source: OCCA
Processed by CERAC
Documentos de trabajo cerac – número 14 – diciembre 2009 14
Table 8. Most acquired firearms brands and type of permit, Colombia and Bogotá
Table 9. Contribution of Bogotá’s firearms to the national total, by type,
since 2004.
Colombia
Firearm Carrying % Total Holding % Total Total
Overall
participation
Llama 142,626 73.2% 52,106 26.8% 194,732 34.0%
Smith & Wesson 99,946 55.0% 81,912 45.0% 181,858 31.7%
Indumil 4,353 11.7% 32,800 88.3% 37,153 6.5%
Colt 12,898 52.0% 11,910 48.0% 24,808 4.3%
Beretta 16,282 69.2% 7,231 30.8% 23,513 4.1%
Carl Walter 16,473 75.8% 5,249 24.2% 21,722 3.8%
Ceska Zbrojovka A.S. 16,830 96.6% 592 3.4% 17,422 3.0%
Browning 13,304 55.4% 10,698 44.6% 24,002 4.2%
Remington 7,285 28.2% 18,535 71.8% 25,820 4.5%
Ruger 16,103 71.9% 6,285 28.1% 22,388 3.9%
Total 346,100 60.4% 227,318 39.6% 573,418 100.0%
Bogotá
Firearm Carrying % Total Holding % Total Total
Overall
participation
Llama 33,629 66.2% 17,147 33.8% 50,776 34.2%
Smith & Wesson 32,780 71.6% 12,978 28.4% 45,755 30.8%
Indumil 452 5.3% 8,047 94.7% 8,499 5.7%
Colt 4,902 66.1% 2,515 33.9% 7,417 5.0%
Beretta 5,768 80.6% 1,386 19.4% 7,154 4.8%
Carl Walter 5,944 88.9% 742 11.1% 6,686 4.5%
Ceska Zbrojovka A.S. 6,234 98.3% 111 1.7% 6,345 4.3%
Browning 4,340 70.2% 1,843 29.8% 6,183 4.2%
Remington 1,832 34.8% 3,428 65.2% 5,260 3.5%
Ruger 3,673 83.9% 705 16.1% 4,378 2.9%
Total 99,554 67.1% 48,902 32.9% 148,453 100.0%
Source: OCCA
Processed by CERAC
Participation
Ceska Zbrojovka A.S. 36.4%
Carl Walter 30.8%
Beretta 30.4%
Colt 29.9%
Llama 26.1%
Browning 25.8%
Smith & Wesson 25.2%
Indumil 22.9%
Remington 20.4%
Ruger 19.6%
Total 25.9%
Source: OCCA
Processed by CERAC
Documentos de trabajo cerac – número 14 – diciembre 2009 15
Table 10. Firearms acquisition by brand and type of weapon.
In short, the legal demand for firearms in Bogotá
follows the preferences implied by the need of a high level of
protection and the presence of high risk targets. Pistols appear
as gaining share in the demand, both for carrying and holding
permits, although we do not have access to time series data to
confirm this intuition. Comparing with the country as a whole,
we do see clearly that pistols are being favoured for carrying
rather than for holding. Legal demand in Bogotá also favours
short guns over long. There is no substantial difference in the
type of weapon bought by brand, although this can be only a
reflection of the restricted availability by brand, due to the state
monopoly on commercialisation.
3.2 Illegal Demand and compliance with
firearms regulations
While illegal demand for arms in Colombia and compliance of
the arms regulation regime is more difficult to measure, we
attempt to do so by analyzing criminal statistics and data from
the National Police on arms confiscations. This assumes that
confiscated arms are a good proxy of the near current demand
for firearms, and that their confiscation signals violation of the
criminal code.
In the case of confiscations it is important to note that
confiscation is not necessarily linked with criminal violence or
other crimes, but potentially with offences against the regulation
of firearms itself or minor misdemeanours. In this way, these
figures allow us to gauge the level of compliance with firearms
regulations, not only in terms of the number of arms involved
in certain crimes, but also the demand for guns for criminal
purposes. Furthermore, a confiscated gun may not necessarily
be taken out of civil hands permanently; after a judicial
procedure, the gun in question might be returned to the licensee
if the reason for confiscation was a minor violation of
regulation. There are no statistics available of how many of
these were returned to the licensees.
Arms confiscations have been increasing both in
Colombia and Bogotá since the 1990’s; with a noticeable
acceleration since 1983 (see Graph 1). In 2004, over 20,000
arms were confiscated in Bogotá, constituting roughly one-third
of the total confiscated in Colombia last year (some 63,000 in
all). Although we do not have information from other law
enforcement agencies (e.g. the military forces, the DAS or the
CTI), The National Police has never confiscated as many arms
as it did in the year 2005, both in Colombia as well as in its
capital. The figure was over 90 thousand for the whole country
and 23,571. For the first semester of 2006, the National Police
confiscated an even larger number of guns: in Colombia near 40
thousand firearms have been confiscated, while 12 thousand
were seized only in the capital.
Table 11 shows firearms confiscated by type of firearm
in Bogotá between 1964 and the first semester of 2006, for the
years for which information is available, by type of firearm. This
one shows how the confiscation has been growing over the
years, with the biggest proportion made of self-defence guns.
Table 12 presents firearms confiscated in Bogotá as a
proportion of the total confiscated in Colombia, and Table 13
shows the total confiscated in Colombia between 1964 and
2004, Graph 1 shows the time series of these three variables.
Colombia
Firearm brand
Machine
Gun
% Carbine % Shotgun % Rifle %
Undeter
mined
% Pistol % Revolver %
Submac
hine gun
% Total
Beretta 0,0% 28 0,1% 4.810 20,5% 2 0,0% 112 0,5% 18.408 78,3% 64 0,3% 89 0,4% 23.513
Browning 21 0,1% 1.661 6,9% 4.146 17,3% 14 0,1% 181 0,8% 17.789 74,1% 187 0,8% 3 0,0% 24.002
Colt 0,0% 118 0,5% 46 0,2% 322 1,3% 118 0,5% 4.412 17,8% 19.117 77,1% 675 2,7% 24.808
Ceska Zbrojovka A.S. 0,0% 15 0,1% 10 0,1% 0,0% 11 0,1% 17.113 98,2% 3 0,0% 270 1,5% 17.422
Indumil 0,0% 175 0,5% 36.544 98,4% 34 0,1% 53 0,1% 17 0,0% 329 0,9% 1 0,0% 37.153
Llama 0,0% 17 0,0% 71 0,0% 6 0,0% 101 0,1% 2.369 1,2% 192.167 98,7% 1 0,0% 194.732
Remington 0,0% 6.703 26,0% 17.978 69,6% 67 0,3% 172 0,7% 139 0,5% 761 2,9% 0,0% 25.820
Ruger 0,0% 498 2,2% 262 1,2% 95 0,4% 73 0,3% 457 2,0% 21.002 93,8% 1 0,0% 22.388
Smith & Wesson 2 0,0% 57 0,0% 744 0,4% 12 0,0% 404 0,2% 3.845 2,1% 176.787 97,2% 7 0,0% 181.858
Carl Walter 1 0,0% 477 2,2% 50 0,2% 1 0,0% 85 0,4% 21.012 96,7% 87 0,4% 9 0,0% 21.722
Bogotá
Firearm brand
Machine
Gun
% Carbine % Shotgun % Rifle %
Undeter
mined
% Pistol % Revolver %
Submac
hine gun
% Total
Beretta 0,0% 5 0,1% 1.049 14,7% 0,0% 4 0,1% 6.080 85,0% 2 0,0% 14 0,2% 7.154
Browning 17 0,3% 358 5,8% 924 14,9% 5 0,1% 8 0,1% 4.867 78,7% 3 0,0% 1 0,0% 6.183
Colt 0,0% 31 0,4% 0,0% 189 2,5% 10 0,1% 1.169 15,8% 5.467 73,7% 551 7,4% 7.417
Ceska Zbrojovka A.S. 0,0% 13 0,2% 2 0,0% 0,0% 0,0% 6.174 97,3% 0,0% 156 2,5% 6.345
Indumil 0,0% 26 0,3% 8.440 99,3% 12 0,1% 1 0,0% 3 0,0% 17 0,2% 0,0% 8.499
Llama 0,0% 1 0,0% 1 0,0% 1 0,0% 2 0,0% 502 1,0% 50.269 99,0% 0,0% 50.776
Remington 0,0% 1.409 26,8% 3.742 71,1% 34 0,6% 12 0,2% 33 0,6% 30 0,6% 0,0% 5.260
Ruger 0,0% 125 2,9% 23 0,5% 42 1,0% 6 0,1% 109 2,5% 4.073 93,0% 0,0% 4.378
Smith & Wesson 1 0,0% 3 0,0% 132 0,3% 6 0,0% 14 0,0% 1.282 2,8% 44.314 96,9% 3 0,0% 45.755
Carl Walter 0,0% 75 1,1% 4 0,1% 0,0% 3 0,0% 6.595 98,6% 3 0,0% 6 0,1% 6.686
Source: OCCA
Processed: CERAC
Documentos de trabajo cerac – número 14 – diciembre 2009 16
Graph 1. Confiscated arms in Bogotá and Colombia, and contribution of Bogotá to the national total, 1964-2005
Table 11. Firearms confiscated in Bogotá, 1964- June 2006
0
10000
20000
30000
40000
50000
60000
70000
80000
90000
100000
196419651966196719681969197019711972197319741975197619771978197919801981198219831984198519861987198819891990199119921993199419951996199719981999200020012002200320042005
0%
10%
20%
30%
40%
50%
60%
Confiscated Arms - Bogotá Confiscated Arms - Colombia Confiscated Arms Bogotá / Colombia
Source: Policía Nacional
Processed by CERAC
Year Revolver Pistol Shotgun Carbine
Machine and
sub machine
gun
Rifle Other Total
1964 1094 164 8 4 0 0 4 1274
1970 994 188 8 2 0 0 4 1196
1971 917 221 13 0 0 0 4 1155
1972 821 186 29 3 1 0 0 1040
1973 1144 285 20 4 0 1 1 1455
1974 1020 280 13 2 0 0 0 1315
1975 766 222 14 3 0 3 0 1008
1976 840 247 11 2 1 0 0 1101
1977 570 169 13 0 0 0 0 752
1978 251 78 17 0 0 0 71 417
1980 345 56 12 2 3 0 0 418
1981 395 80 30 7 0 0 0 512
1982 601 230 72 1 1 1 0 906
1983 4940 1203 16 0 1 0 0 6160
1984 923 157 26 2 27 1 0 1136
1987 985 257 174 1 7 3 0 1427
1992 1986 479 275 0 6 2 0 2748
1993 2860 713 416 3 26 4 0 4022
1998 5088 1857 1022 5 33 7 0 8012
1999 4952 1890 1011 6 33 1 0 7893
2003 9337 4963 1243 8 57 24 12 15644
2004 11902 7143 968 5 75 16 1 20110
2005 14210 8532 715 6 99 7 2 23571
2006 7629 4860 368 9 32 2 1 12901
** Data not available for 1965-1969, 1979, 1985-1986, 1988-1991, 1994-1997, 2000-2002
* Until June de 2006
Source: Policía Nacional.
Processed by CERAC
Type of firearm
Documentos de trabajo cerac – número 14 – diciembre 2009 17
Table 12. Firearms confiscated in Bogotá as a proportion of those confiscated in Colombia, 1964-2004
Confiscations in Bogotá have grown consistently since 1985,
with a notable acceleration since 2000. Nationally, this
acceleration is present since the new regime for arms control
entered into force in 1993. By 2005 the number of arms
confiscated reached a historical maximum after 12 years of
constant growth. All throughout the period, confiscations in
Bogotá have constituted an average of 22% of the total
confiscated throughout Colombia. Interestingly, the
acceleration of arms confiscation seems to be inversely related
with the reduction of homicide rates in Bogotá and in the
country (see Graph 2). The effort by the National Police to
control firearms is evident in Bogotá in terms of firearm control
is evident from the rising proportion of arms confiscated in the
city with respect to confiscation nationwide, rising from a paltry
8% in 1978 to 33% in 2003, while there is no reason to suggest
that the number of firearms in circulation in Bogotá has risen in
such a large proportion during the same period. Revolvers and
pistols constitute roughly 94% of confiscated arms in Bogotá,
while in Colombia this proportion is closer to 86% (see Graph
3 and Graph 4), confirming the preference for short weapons in
the city. In Bogotá and in Colombia, revolvers have been the
most confiscated weapon; however, their prevalence has been
falling in the last two decades as demand for pistols has
increased (see Graph 5).
Year Revolver Pistol Shotgun Carbine
Machine and
sub machine
gun
Assault rifle Other Total
1964 32% 28% 5% 6% 0% 0% 2% 29%
1970 29% 27% 5% 9% 0% 0% 4% 27%
1971 26% 28% 5% 0% 0% 0% 3% 24%
1972 26% 24% 7% 9% 50% 0% 0% 24%
1973 30% 29% 7% 12% 0% 10% 7% 29%
1974 26% 22% 4% 5% 0% 0% 0% 23%
1975 22% 19% 4% 7% 0% 10% 0% 19%
1976 21% 21% 3% 6% 33% 0% 0% 20%
1977 14% 13% 4% 0% 0% 0% 0% 13%
1978 8% 6% 3% 0% 0% 0% 36% 8%
1980 14% 7% 3% 3% 43% 0% 0% 11%
1981 13% 11% 6% 16% 0% 0% 0% 12%
1982 13% 16% 13% 4% 6% 5% 0% 14%
1983 58% 61% 3% 0% 2% 0% 0% 55%
1984 18% 5% 3% 1% 25% 1% 0% 12%
1987 16% 19% 14% 1% 1% 6% 0% 15%
1992 19% 20% 12% 0% 5% 2% 0% 18%
1993 20% 22% 13% 2% 18% 5% 0% 19%
1998 21% 25% 16% 4% 21% 6% 0% 21%
1999 20% 23% 14% 5% 19% 1% 0% 19%
2003 33% 42% 19% 6% 34% 6% 2% 33%
2004 32% 43% 12% 5% 33% 3% 0% 32%
** Data not available for 1965-1969, 1979, 1985-1986, 1988-1991, 1994-1997, 2000-2002
Source: Policía Nacional.
Processed by CERAC
Type of Firearm
Documentos de trabajo cerac – número 14 – diciembre 2009 18
Table 13: Firearms confiscated in Colombia, 1962-2004
Graph 2. Confiscated firearms and deaths by firearm in Bogotá
Año Revolver Pistol Shotgun Carbine
Machine and sub
machine gun
Assault rifle Total
1962 2223 448 390 68 0 53 3182
1963 2449 450 362 74 0 30 3365
1964 3389 580 344 67 0 34 4414
1965 10582 2059 1140 256 0 156 14193
1966 3494 616 293 48 8 27 4486
1967 3150 648 427 58 11 28 4322
1968 3524 778 451 53 0 24 4830
1969 3439 720 332 20 0 14 4525
1970 3484 702 256 22 11 10 4485
1971 3536 795 362 38 8 10 4749
1972 3142 780 438 35 11 17 4423
1973 3777 980 277 34 15 10 5093
1974 3919 1285 331 41 10 11 5597
1975 3545 1158 389 41 36 30 5199
1976 3945 1204 397 36 19 11 5612
1977 4151 1301 331 66 34 19 5902
1978 3018 1232 538 31 202 4 5025
1979 2713 851 437 54 26 18 4099
1980 2533 747 452 61 7 22 3822
1981 2997 731 483 43 17 8 4279
1982 4599 1436 535 24 17 22 6633
1983 8647 1982 626 121 63 29 11288
1984 5150 3194 942 169 106 6 9628
1985 5124 1359 1608 86 121 127 8425
1986 5842 1174 849 91 64 59 8079
1987 6006 1343 1213 85 633 54 9334
1988 7094 1854 1518 79 109 65 10719
1989 9241 1601 1701 124 64 48 12779
1990 15058 1672 1481 144 133 118 18606
1991 7151 2292 1949 222 144 589 12347
1992 10363 2455 2295 103 130 128 15474
1993 14145 3224 3158 158 145 88 20918
1994 15560 3962 3677 224 144 95 23662
1995 17761 4359 4732 138 126 128 27244
1996 18121 4626 5475 134 130 118 28604
1997 19995 5515 5505 94 148 214 31471
1998 24012 7527 6359 135 156 127 38316
1999 24750 8052 7242 113 177 193 40527
2000 25789 8577 7431 100 170 288 42355
2001 26927 9589 7508 146 207 279 44656
2002 47353
2003 28293 11695 6920 124 418 387 47837
2004 37123 16441 8409 97 414 553 63037
Total 409761 121994 89563 3857 4234 4251 680894
Source: Policía Nacional
Processed by CERAC
Type of firearm
0
5000
10000
15000
20000
25000
1964
1966
1968
1970
1972
1974
1976
1978
1980
1982
1984
1986
1988
1990
1992
1994
1996
1998
2000
2002
2004
Confiscated firearms in Bogotá Deaths by firearm in Bogotá
Source: National Police and DANE
Documentos de trabajo cerac – número 14 – diciembre 2009 19
Graph 3: Distribution of confiscated arms in Bogotá by type, 1964-2005.
Graph 4. Distribution of confiscated arms in Colombia, by type, 1964-2005.
73.5%
21.2%
4.8%
0.2%
0.3%
0.1%
Revolver Pistol Shotgun Carbine Machine and sub machine gun Assault rifle
Source: Policía Nacional
Processed by CERAC
68.1%
18.1%
11.6%
0.9%
0.7%
0.6%
Revolver Pistol Shotgun Carbine Machine and sub machine gun Assault rifle
Source: Policía Nacional
Processed by CERAC
Documentos de trabajo cerac – número 14 – diciembre 2009 20
Graph 5. Evolution of the distribution of confiscated arms in Bogotá by type,
1964-2005
For the last two and a half years, the National Police’s
Center for Criminological Studies has been registering with
increasing detail all cases in which a gun is confiscated. This
information was made available to us only for the city of
Bogotá.
By June 2006, the National Police has confiscated in
Bogotá and Colombia more that the double the number of guns
that were confiscated in 2005, which was in turn a record year
until then. It is likely that this record will be broken again in
2006. Tables 16 and 17 show firearms confiscated in Colombia
and Bogotá in the period 2003-June 2006 with respect to the
type of permit held. Both in Colombia and Bogotá the biggest
proportion of firearms confiscated are guns without permit and
carrying permit. Given that it is unlikely that such an explosion
of selling has occurred during the period, we venture to point to
an increase in gun-control police activity that lead to this large
increase.
The quantity of firearms confiscated with carrying
permits in Bogotá is much larger than in the whole country;
while in Bogotá this proportion is 84.4% in Colombia is 56.4%
(Table 18).Carrying permit holders, on the other hand, are prone
to fall short of regulation leading to a large number of
confiscations. The confiscation of a weapon may not be
connected with criminal offences but may be associated with
minor offences, including carrying of the weapon by someone
different than the permit holder, carrying the weapon under the
influence of alcohol, etc.
0%
10%
20%
30%
40%
50%
60%
70%
80%
90%
100%
1964
1970
1971
1972
1973
1974
1975
1976
1977
1978
1980
1981
1982
1983
1984
1987
1992
1993
1998
1999
2003
2004
2005*
Revolver Pistol Shotgun Carbine Machine and sub machine gun Assault rifle
Source: Policía Nacional
Processed by CERAC
Documentos de trabajo cerac – número 14 – diciembre 2009 21
Table 16. Confiscated arms in Colombia by type and permit
status. 2003- June 2006
Table 17. Confiscated arms in Bogotá by type and permit
status. 2003- June 2006
Table 18. Proportion of confiscated firearms by type and
permit status with respect of the Total. Colombia and Bogotá,
2003- June 2006
Additionally, there are significant differences between
types of firearm. Both in Colombia and Bogotá the biggest
proportion of pistols, revolvers and submachine guns
confiscated were granted carrying permits, a large part of
confiscated shotguns did not, as is shown in Table 18. Thus, the
granting of carrying permits involves a much higher probability
of falling foul of the regulations than in those cases a holding
permit is issued. It also shows that there is, at least in the city of
Bogotá, a high degree of enforcement of the regulation for
firearms: a 5% of guns issued with a carrying permit were
confiscated in the city. The proportion of guns without permit
that were confiscated has been falling; in 2003, arms without
permit confiscated were 23%, 16% in 2004 and only 9% until
August 2005.
In general, long guns are held in Bogotá without any
type of permit, while short weapons do have permits but are
confiscated for a series of reasons. Still, the number of long
weapons which are detected by the authorities are much lower
than short weapons. Revolvers (both legal and illegal) are the
most commonly confiscated firearms, representing
approximately 64% of the total. They are followed by pistols
Permit Type of firearm 2003 2004 2005 2006*
Revolver 13,861 18,433 24,477 14,955
Pistol 7,504 11,082 14,270 9,474
Shotgun 455 497 586 488
Sub Machine Gun 58 89 120 54
Carbine 2 10 11 7
Rifle 3 13 8 2
Machine Gun 1 4 7 6
Others** 4 3
21,884 30,128 39,483 24,989
Revolver 121 229 376 369
Pistol 31 91 153 174
Shotgun 67 65 105 118
Sub Machine Gun 1 1 4
Carbine 1 2 1
Rifle 2 1
Others** 1
Machine Gun 1
220 388 637 669
Revolver 13,233 15,539 16,609 7,773
Shotgun 5,744 6,934 7,573 3,936
Pistol 4,056 4,674 4,868 2,253
Rifle 229 285 277 138
Carbine 119 81 116 49
Sub Machine Gun 92 103 67 49
Others** 59 84 80 48
Machine Gun 11 11 15 7
23,543 27,711 29,605 14,253
45,647 58,227 69,725 39,911
* Until June 2006
** Includes grenade launcher, mortar, rocket and others
Source: Policía Nacional
Processed by CERAC
Without
permission
Holding
Carrying
Total
Total
Total
Total
Permit Type of firearm 2003 2004 2005 2006*
Revolver 6,772 8,875 12,322 6,710
Pistol 4,317 6,415 8,108 4,621
Shotgun 225 191 219 185
Sub Machine Gun 41 60 83 21
Rifle 2 9 4
Carbine 1 3 3 6
Machine Gun 1 2 3 5
11,359 15,555 20,742 11,548
Revolver 11 13 53 27
Pistol 5 7 20 13
Shotgun 14 1 13 12
30 21 86 52
Revolver 2,041 2,000 1,835 892
Shotgun 944 758 483 171
Pistol 480 459 404 226
Sub Machine Gun 11 12 11 6
Carbine 8 2 3 3
Rifle 8 2 3 2
Others** 8 3 2 1
Machine Gun 2 2
3,502 3,236 2,743 1,301
14,891 18,812 23,571 12,901
* Until June 2006
** Includes grenade launcher, mortar, rocket and others
Source: Policía Nacional
Processed by CERAC
Total
Total
Carriyng
Holding
Total
Without
permission
Total
Permit Type of firearm Colombia Bogotá
Carbine 7.5% 44.8%
Machine Gun 28.6% 73.3%
Others** 2.5% 0.0%
Pistol 72.2% 93.6%
Revolver 56.9% 83.5%
Rifle 2.7% 50.0%
Shotgun 7.6% 25.5%
Sub Machine Gun 50.3% 83.7%
54.6% 84.4%
Carbine 1.0% 0.0%
Machine Gun 1.6% 0.0%
Others** 0.4% 0.0%
Pistol 0.8% 0.4%
Revolver 0.9% 0.1%
Rifle 0.3% 0.0%
Shotgun 1.3% 1.2%
Sub Machine Gun 0.9% 0.0%
0.9% 0.3%
Carbine 91.5% 55.2%
Machine Gun 69.8% 26.7%
Others** 97.1% 100.0%
Pistol 27.0% 6.3%
Revolver 42.2% 16.3%
Rifle 97.0% 50.0%
Shotgun 91.0% 73.3%
Sub Machine Gun 48.7% 16.3%
44.5% 15.4%
* Until June 2006
** Includes grenade launcher, mortar, rocket and others
Source: Policía Nacional
Processed by CERAC
Without
permission
Total
Carrying
Total
Holding
Total
Documentos de trabajo cerac – número 14 – diciembre 2009 22
(21%) and shotguns (14%). Roughly 22% of all seized firearms
were of the Indumil-made Llama brand, of which 72% lacked
carrying permits (or at least the holding permit was not being
carried with the gun). Approximately 19.5% of the confiscated
weapons were Smith & Wesson, 78.3% illegal, followed by home-
made revolvers (Table 19).
Table 19. Confiscated firearm brand by type and permit,
January-May 2005
Also, newly available data show the type of
manufacturing of the gun if it is: industrially made or if it is a
home-made weapon. Tables 20 and 21 display the figures for
Colombia and Bogotá, 2003 and the first semester of 2006.
These show that the majority of confiscated weapons in
Colombia and Bogotá are original, being the higher proportion
in Bogotá: 95% and of 72%. In the whole of the country, on
the other hand a 12% of confiscated firearms are home-made
weapons.
Table 20. Confiscated firearms by type of fabrication.
Colombia, 2003-June 2006
Table 21. Confiscated firearms by type of fabrication.
Bogotá, 2003-June 2006
Type Brand With permit Without permit Percentage
Revolver
Llama 28.0% 72.0% 21.2%
Smith & Wesson 21.7% 78.3% 19.5%
Colt 100.0% 5.1%
Ruger 20.0% 80.0% 4.2%
Home Made Weapon 100.0% 5.9%
Not reported 100.0% 7.6%
Total Revolver 17.3% 82.7% 63.6%
Pistol
Prieto Beretta 28.6% 71.4% 5.9%
Browning 25.0% 75.0% 3.4%
Smith & Wesson 100.0% 1.7%
Ceska 100.0% 0.8%
Colt 100.0% 0.8%
CZ83 100.0% 0.8%
FN 100.0% 0.8%
Glock 100.0% 0.8%
Llama 100.0% 0.8%
Mauser 100.0% 0.8%
Parabellum 100.0% 0.8%
Sig Sauer 100.0% 0.8%
Taurus 100.0% 0.8%
Walther 100.0% 0.8%
Not reported 100.0% 0.8%
Total Pistol 20% 80% 21.2%
Shotgun
Home Made Weapon 100% 5.1%
Remington 50% 50% 1.7%
Indumil 100% 0.8%
Mossberg 100% 0.8%
Ruger 100% 0.8%
Not reported 5.1%
Total Shotgun 12% 88% 14.4%
Other firearms Not reported 100% 0.8%
Total 16.9% 83.1% 100.0%
Source: Policía Nacional
Processed by CERAC
Type of firearm 2003 2004 2005 2006*
Revolver 26,217 32,768 39,453 27,517
Pistol 13,353 18,757 22,063 16,051
Shotgun 1,519 1,523 1,505 1,593
Sub Machine Gun 151 190 229 111
Rifle 131 153 158 135
Carbine 80 54 50 48
Others** 14 12 10 16
Machine Gun 7 8 12 19
41,472 53,465 63,480 45,490
Shotgun 4,067 4,353 4,305 3,261
Revolver 3,045 3,748 4,165 3,044
Pistol 688 954 947 630
Others** 5 27 39 33
Sub Machine Gun 14 24 14 13
Carbine 17 10 19 17
Rifle 3 3 2 7
Machine Gun 3 5
7,839 9,122 9,496 7,005
Revolver 6,776 8,573 12,051 164
Pistol 2,352 3,017 4,813 80
Shotgun 1,863 2,570 3,169 56
Rifle 108 155 132 1
Others** 48 48 37 5
Sub Machine Gun 38 50 39 10
Carbine 33 33 66 1
Machine Gun 8 6 10
11,226 14,452 20,317 317
60,537 77,039 93,293 52,812
* Until June 2006
** Includes grenade launcher, mortar, rocket and others
Source: Policía Nacional
Processed by CERAC
Total
ORIGINAL
HOME
MADE
WEAPON
NO
REPORTED
Total
Total
Total
Permit Type of firearm 2003 2004 2005 2006*
Revolver 8,445 10,504 13,699 7,476
Pistol 4,756 6,809 8,357 4,830
Shotgun 385 314 325 243
Sub Machine Gun 49 67 92 24
Rifle 9 10 7 2
Carbine 6 5 4 8
Machine Gun 3 2 3 5
Others** 5 1 1
13,658 17,712 22,487 12,589
Shotgun 789 628 358 124
Revolver 351 372 300 146
Pistol 36 59 33 30
Sub Machine Gun 2 3 1
Carbine 2 1
Others** 1
1,180 1,063 692 301
Revolver 28 12 210 7
Pistol 10 13 142
Shotgun 9 8 32 1
Sub Machine Gun 1 2 1 3
Others** 3 1 2
Carbine 1 2
Machine Gun 2
Rifle 1 1
53 37 391 11
14,891 18,812 23,570 12,901
* Until June 2006
** Includes grenade launcher, mortar, rocket and others
Source: Policía Nacional
Processed by CERAC
NO
REPORTED
Total
Total
HOME
MADE
WEAPON
Total
Total
ORIGINAL
Documentos de trabajo cerac – número 14 – diciembre 2009 23
Table 22. Distribution of confiscated firearms by type of crime and permit status, January-May 2005
A more useful measure pure criminal demand is the
association of different types of criminal events with the firearm
involved in a crime, although the necessary is only available
from 2005 onwards10. Table 22 shows the type of crime
associated with a confiscated firearm for Bogotá, indicating that
83% of the firearms used in crimes did not have a permit.
Roughly 47% of the guns confiscated during the period were
for offences against the regulation of firearms (i.e., production,
trafficking, and carrying of firearms or munitions without a
license. Theft11 ranks second in terms of firearm confiscations
(24%), and only one quarter of these were registered. Personal
injuries were associated with roughly 12% of firearms
confiscations, of which 50% were covered by a license.
Approximately 10% of seized weapons were associated with
homicides, and, of those, 75% were illegal. Table 23 presents
the brands of firearms associated with different crimes.
Several conclusions can be extracted from these
figures. First, arms confiscation efforts by the National Police
have been growing year on year. It is possible that an increase in
the number of guns flowing into the city has led to this increase
in confiscation with the same level of effort by the authorities.
In our opinion, this is not the case. It is more likely that the
National Police and the Metropolitan Police (the section of
National Police concerned with the security in the city) has
identified this as a good practice and a police activity that offers
a measurable indicator that also has an impact on crime levels.
We conclude that this is the case based on interview held with
Metropolitan Police officers. In a highly insecure environment,
the enforcement of firearms regulation is a policy of choice for
the police. At the same time, we do not identify a relaxation of
10 This information corresponds only to the confiscated firearms that
have a record of the crime associated with it. This is less that 1% of the
total confiscations in Bogotá for 2005, hence the significance of the
assertions that are made here must consider this.
11 Theft includes here theft of vehicles, petrol, banks, armed robbery
and armed robbery in households.
border controls or anti-arms trafficking activities that would
have lead to an increase in the supply of firearms.
Crime associated Percentage With permit Without permit
Producing, Trafficking, illegal firearm or ammunition handling 47% 0% 100%
Theft* 24% 24% 76%
Personal injuries 12% 50% 50%
Homicide 10% 25% 75%
Crime association 4% 60% 40%
Damagge to goods 1% 0% 100%
Money laundering 1% 0% 100%
Authority impersonation 1% 0% 100%
Total 17% 83%
* Includes theft of vehicles, petrol, banks, to people and houses
Processed by CERAC
Documentos de trabajo cerac – número 14 – diciembre 2009 24
Table 23. Confiscated firearms by associated crime and weapon brand, January-May 2005
Additionally, we conclude that the increase in the
demand for pistols is a trend that is prevalent. Furthermore,
legal firearms have a high likelihood of becoming potentially
criminal firearms, but not in most cases as firearms regulation is
relatively tightly controlled. Demand for the use of firearms in
violent crimes (including homicide) is satisfied overwhelmingly
by the illegal gun market. Finally, as a very low proportion of
violent crimes is successfully prosecuted (see Restrepo, 2004)
we find that violations of firearms regulation is used as a proxy
to process individuals linked with criminal activity. In
Colombia, the police and justice system face a formidable
challenge in terms of violent crime, and in many occasions, the
only offence that is detectable and punishable is the
confiscation of a firearm and the subsidiary process of carrying
a gun without permit.
3.3 Demand for Use: Firearms Deaths in Bogotá
In this section, we assess criminal demand for firearms based
on the analysis of DANE’s data, Colombia’s National
Department of Statistics on firearm deaths in Bogotá and
Colombia between 1979 and 2003 and National Police for
2003-2007. Unfortunately, we have not yet been able to get
information on the use of guns in other forms of violence
against persons (as thefts, threats, kidnappings, etc.). We
nonetheless argue that the use of lethal violence indicators is
not only appropriate but particularly justified in that they are the
most serious of all forms of violence against people.
Some 45,000 people have died in firearm related
events in Bogotá between 1979 and 2005, constituting roughly
8% of the deaths in the capital caused by natural and external
causes. Since the mid-1980s, 40% deaths due to external causes
can be attributed to firearms. Deaths by firearm show a clear
inverted (V) pattern, climbing throughout the 1979-1993 period
when they reached a peak of 3,358 people killed (see Table 24,
Table 25 and Graph 6 ). From then on, firearms deaths have
declined continuously reaching the 1,273 figure by end-2003,
the lowest since 1988. Recall that a new firearms regulatory
framework was issued in 1993-94: we find a plausible
association of this new, more restrictive regulation and the
Brand of the
firearm
Crime
association
Damagge
to goods
Producing,
Trafficking, illegal
firearm or
ammunition handling
Homicide Theft*
Money
laundering
Injuries
Authority
impersonation
Total
Llama 18% 33% 33% 21% 100% 22%
Smith & Wesson 20% 22% 8% 8% 21% 21%
Not reported 100% 18% 8% 8% 21% 14%
Hechiza 18% 7% 11%
Colt 4% 17% 17% 6%
Prieto Beretta 40% 2% 17% 17% 7% 6%
Ruger 7% 5%
Browning 2% 8% 8% 7% 3%
Remington 20% 2% 2%
Ceska 2% 1%
CZ83 1%
FN 7% 1%
Glock 20% 1%
Indumil 7% 1%
Mauser 2% 1%
Mossberg 2% 1%
Parabellum 8% 8% 1%
Sig Sauer 100% 1%
Taurus 1%
Walther 2% 1%
Percentage 4% 1% 47% 10% 10% 1% 12% 1% 100%
Source: Policía Nacional
Processed by CERAC
* Includes theft of vehicles, petrol, banks, to people and houses
Crime
Documentos de trabajo cerac – número 14 – diciembre 2009 25
reduction in firearms deaths that took place in Bogotá
afterwards.
Also Table 25 shows how between 1979 and 1993 the
deaths by external causes and by firearm increase rapidly, and
that during the period 1993-2003 had a rapid and large
reduction, especially in Bogotá.
Bogotá has been a net contributor to the reduction of
homicidal violence in the whole country. Its share in the total
number of deaths by external causes in Colombia has fallen
from a peak of 15% in 1993 to a low of 8 % in 2003. Moreover,
the share in the total number of firearms deaths fell from 13%
of the total in the country to just 4% by the end of 2004 (Graph
7).
Still, historically, the impact of firearms in Bogotá has
been smaller than the one in the country as a whole: the share
of firearm deaths in total deaths between 1979 and 2003
reached 11% for the nation and only 7% in Bogotá. While
firearm deaths in Bogotá showed an increase of 125% between
1979 and 2003 (from 565 to 1,273 deaths), in the whole country
over the same period there was a staggering fivefold increase
(3,617 to 23,073). The proportions of deaths by firearm in
Bogotá and Colombia between 1979 and 2003 are in Graph 7.
Using estimates of population we use rates per 100.000
inhabitants to account for the risk exposure of the population .
In Bogotá, the all-cause mortality rate has been relatively stable
while the rate of external deaths and by firearms show the
influence of homicides, first increasing until 1993 (the rate of
deaths by firearm was 63 per 100,000 inhabitants) and then
decreasing continuously until 2003 (see Graph 8), when it fell
well below the historical minimum. Our projection shows that
we will be reaching even lower rates for 2006, rates around 16
per each 100,000 inhabitants. By 2003, the rate of deaths by
firearm in Bogotá was 19 per 100,000; in Colombia, the rate was
52 per 100,000 (see Table 26).
Table 24. Percentage of total deaths attributable to external causes, firearms, and percentage of external cause deaths attributable to
firearms, Colombia and Bogotá. 1979-2003
Year
Firearm
deaths/Total
External
Causes/Total
Firearm
deaths/exter
nal causes
Firearm
deaths/Total
External
Causes/Total
Firearm
deaths/exter
nal causes
1979 3% 14% 23% 3% 16% 20%
1980 4% 15% 26% 4% 16% 24%
1981 5% 16% 30% 4% 15% 26%
1982 5% 16% 31% 4% 17% 27%
1983 5% 17% 31% 5% 17% 27%
1984 6% 18% 34% 5% 16% 31%
1985 7% 19% 39% 6% 17% 36%
1986 9% 21% 45% 7% 16% 42%
1987 10% 21% 46% 7% 17% 38%
1988 11% 23% 50% 7% 17% 40%
1989 12% 23% 52% 8% 19% 41%
1990 13% 24% 54% 8% 19% 43%
1991 15% 27% 58% 9% 21% 45%
1992 15% 26% 57% 10% 22% 45%
1993 15% 26% 55% 12% 24% 50%
1994 14% 26% 53% 11% 22% 49%
1995 13% 24% 51% 10% 21% 46%
1996 13% 24% 55% 10% 20% 47%
1997 13% 24% 54% 8% 18% 46%
1998 13% 24% 51% 8% 18% 42%
1999 13% 24% 53% 7% 17% 43%
2000 14% 25% 57% 7% 16% 41%
2001 14% 25% 59% 6% 15% 40%
2002 15% 25% 60% 5% 14% 38%
2003 12% 22% 50% 4% 11% 36%
Average
1979-2003
11% 22% 47% 7% 18% 39%
Source: DANE
Processed by CERAC
Colombia Bogotá
Documentos de trabajo cerac – número 14 – diciembre 2009 26
Table 25. Total Deaths, deaths by external causes, and deaths by firearm, Colombia and Bogotá, 1979-2003
Graph 6. Evolution of deaths by external cause and firearm, Bogotá, 1979-2003
Año Total
External
Causes
Firearms
Deaths
Total
External
Causes
Firearms
Deaths
1979 110,400 15,680 3,617 17,737 2,792 565
1980 125,573 18,898 4,980 17,439 2,754 664
1981 139,505 22,084 6,552 18,931 2,933 774
1982 137,678 22,685 7,127 16,764 2,807 751
1983 140,292 23,767 7,343 16,882 2,868 770
1984 137,189 24,455 8,211 18,399 2,978 921
1985 153,947 29,218 11,505 22,955 3,825 1,392
1986 146,345 30,210 13,472 19,812 3,265 1,369
1987 151,957 32,179 14,780 20,512 3,526 1,354
1988 153,065 34,995 17,447 19,857 3,307 1,325
1989 154,694 36,228 18,947 22,966 4,351 1,764
1990 156,314 38,107 20,569 23,407 4,416 1,909
1991 162,063 43,066 24,941 24,672 5,084 2,263
1992 167,743 44,395 25,084 26,328 5,727 2,602
1993 168,647 44,621 24,572 28,342 6,691 3,358
1994 168,568 43,287 23,118 28,267 6,198 3,011
1995 169,896 41,532 21,313 28,534 6,060 2,809
1996 173,506 42,307 23,062 29,228 5,929 2,784
1997 170,753 41,087 22,222 28,308 5,161 2,398
1998 175,363 42,823 21,950 26,579 4,824 2,002
1999 183,553 43,959 23,320 28,487 4,753 2,040
2000 187,432 46,031 26,465 28,440 4,600 1,884
2001 191,513 47,175 27,618 28,864 4,258 1,693
2002 192,262 48,438 28,989 29,137 3,993 1,527
2003 192,124 41,864 23,073 30,475 3,499 1,273
Total 1979-2003 4,010,382 899,091 450,277 601,322 106,599 43,202
∆ 1979-1993 52.8% 184.6% 579.3% 59.8% 139.6% 494.3%
∆ 1979-2002 13.9% -6.2% -6.1% 7.5% -47.7% -62.1%
∆ 1979-2003 74.0% 167.0% 537.9% 71.8% 25.3% 125.3%
Source: DANE
Processed by CERAC
Colombia Bogotá
0
1,000
2,000
3,000
4,000
5,000
6,000
7,000
1979
1980
1981
1982
1983
1984
1985
1986
1987
1988
1989
1990
1991
1992
1993
1994
1995
1996
1997
1998
1999
2000
2001
2002
2003
Deaths
External Causes Deaths by firearmSource: DANE
Process by CERAC
Documentos de trabajo cerac – número 14 – diciembre 2009 27
Graph 7. Contribution of deaths in Bogotá to deaths in Colombia, by type, 1979-2003
Graph 8. Proportion of total deaths by firearm, Bogotá and Colombia, 1979-2003
4%
6%
8%
10%
12%
14%
16%
18%
20%
1979
1980
1981
1982
1983
1984
1985
1986
1987
1988
1989
1990
1991
1992
1993
1994
1995
1996
1997
1998
1999
2000
2001
2002
2003
Bogotá/Colombia
Total External Causes Firearm DeathsSource: DANE
Processed by CERAC
0
1,000
2,000
3,000
4,000
5,000
6,000
7,000
1979
1980
1981
1982
1983
1984
1985
1986
1987
1988
1989
1990
1991
1992
1993
1994
1995
1996
1997
1998
1999
2000
2001
2002
2003
Deaths
External Causes Deaths by firearmSource: DANE
Process by CERAC
Documentos de trabajo cerac – número 14 – diciembre 2009 28
Graph 9. Death rates per 100,000 inhabitants by external cause, firearm, and total, Bogotá, 1985-2003
Table 26. Death rates per 100,000 inhabitants by external cause, firearm, and total, Colombia and Bogotá, 1985-2003
0
20
40
60
80
100
120
140
1985
1986
1987
1988
1989
1990
1991
1992
1993
1994
1995
1996
1997
1998
1999
2000
2001
2002
2003
Rateby100.000inhabitants
0
100
200
300
400
500
600
Rateby100.000inhabitants-Total
Causas Externas Deaths by firearm External Causes
Source: DANE
Processed by CERAC
Año Total
External
Causes
Firearms
Deaths
Total
External
Causes
Firearms
Deaths
1985 486 92 36 533 89 32
1986 453 94 42 449 74 31
1987 461 98 45 453 78 30
1988 455 104 52 427 71 28
1989 451 106 55 479 91 37
1990 447 109 59 475 90 39
1991 454 121 70 487 100 45
1992 461 122 69 506 110 50
1993 454 120 66 529 125 63
1994 445 114 61 513 112 55
1995 441 108 55 503 107 49
1996 442 108 59 503 102 48
1997 426 103 55 475 87 40
1998 430 105 54 435 79 33
1999 441 106 56 454 76 33
2000 443 109 63 442 71 29
2001 445 110 64 439 65 26
2002 439 111 66 434 59 23
2003 431 94 52 444 51 19
∆ 1979-2003 -11% 2% 42% -17% -43% -43%
Average 1985-2003 449 108 57 474 88 38
Source: DANE
Processed by CERAC
Colombia Bogotá
Documentos de trabajo cerac – número 14 – diciembre 2009 29
Deaths (violent or otherwise) show an annual positive
growth over the whole period of 1979–2003 (see Table 27).
Two distinct trends can be identified during the period: first,
between 1979 and 1993, when total deaths, deaths due to
external causes, and firearm deaths show a growth of 60%,
140% and 494%, respectively; second, between 1994 and 2003,
when the level of violent deaths recedes, with growth rates of
7%, -48% and -62% (as seen in Table 25), respectively . In the
second period, almost all annual growth rates are negative (see
Graph 10).From 1993 onward, deaths decrease consistently, an
observation which lends support to the hypothesis that
legislation introduced in 1993 has had a positive effect on
reducing firearm violence. This is confirmed by trends in the
annual homicide rate, which declines by 15% over the period
1994 to 2003.
Table 27. Annual growth rate of deaths, deaths by external cause, and deaths by firearm, Bogotá, 1980-2003
Deaths by firearm may occur in a variety of events, including
accidents, suicides, homicides, events with undetermined
intention, and police/military interventions. In Bogotá and
elsewhere in Colombia, homicides are the most common events
in which firearm deaths occur, with over 90% of all firearm
deaths (see Graph 10). The intensity of the growth in the
number of homicides before 1993 and the rapid decrease during
the following years after this peak, explain most of the variation
in the level of deaths by external causes and in deaths by
firearms in Bogotá. Next section provides a brief description of
recent homicide patterns in Bogotá and Colombia, based on
analysis of alternative National Police information.
Year Total External Causes Deaths by firearm
1980 -1.7% -1.4% 16.1%
1981 8.2% 6.3% 15.3%
1982 -12.2% -4.4% -3.0%
1983 0.7% 2.1% 2.5%
1984 8.6% 3.8% 17.9%
1985 22.1% 25.0% 41.3%
1986 -14.7% -15.8% -1.7%
1987 3.5% 7.7% -1.1%
1988 -3.2% -6.4% -2.2%
1989 14.5% 27.4% 28.6%
1990 1.9% 1.5% 7.9%
1991 5.3% 14.1% 17.0%
1992 6.5% 11.9% 14.0%
1993 7.4% 15.6% 25.5%
1994 -0.3% -7.7% -10.9%
1995 0.9% -2.3% -6.9%
1996 2.4% -2.2% -0.9%
1997 -3.2% -13.9% -14.9%
1998 -6.3% -6.8% -18.0%
1999 6.9% -1.5% 1.9%
2000 -0.2% -3.3% -8.0%
2001 1.5% -7.7% -10.7%
2002 0.9% -6.4% -10.3%
2003 4.6% -12.4% -16.6%
Average 2.2% 1.6% 4.3%
Source: DANE
Process by CERAC
Documentos de trabajo cerac – número 14 – diciembre 2009 30
Graph 10. Evolution of growth rates of total deaths, deaths by external cause, and deaths by firearm, Bogotá, 1979-2003
Graph 11. Firearms deaths by type, Bogotá, 1979-2003
-30%
-20%
-10%
0%
10%
20%
30%
40%
50%
1980
1981
1982
1983
1984
1985
1986
1987
1988
1989
1990
1991
1992
1993
1994
1995
1996
1997
1998
1999
2000
2001
2002
2003
AnnualGrowthRate
Total External Causes Deaths by firearm
Source: DANE
Process by CERAC
0
500
1000
1500
2000
2500
3000
3500
1979
1980
1981
1982
1983
1984
1985
1986
1987
1988
1989
1990
1991
1992
1993
1994
1995
1996
1997
1998
1999
2000
2001
2002
2003
Deaths
Accidents Suicidies Homicides Total deaths by firearms
Source: DANE
Processed by CERAC
Documentos de trabajo cerac – número 14 – diciembre 2009 31
Graph 12. Firearms related deaths participation by external cause,
Bogotá, 1979-2003
Graph 13. Firearms related deaths participation by external cause,
Colombia, 1979-2002
0
10
20
30
40
50
60
70
80
90
100
1979
1980
1981
1982
1983
1984
1985
1986
1987
1988
1989
1990
1991
1992
1993
1994
1995
1996
1997
1998
1999
2000
2001
2002
2003
PProportionfirearmdeaths/deaths
Accidents Suicides Homicides External Causes
Source: DANE
Processed by CERAC
0
10
20
30
40
50
60
70
80
90
100
1979
1980
1981
1982
1983
1984
1985
1986
1987
1988
1989
1990
1991
1992
1993
1994
1995
1996
1997
1998
1999
2000
2001
2002
Proportionfirearmdeaths/deaths
Accidents Suicides Homicides External CausesSource: DANE
Processed by CERAC
Documentos de trabajo cerac – número 14 – diciembre 2009 32
Most homicides are carried out with firearms, both in
Bogotá and in Colombia more generally. Specifically, about
67% of all homicides in Bogotá were carried out with a firearm.
This percentage has a different dynamic in Bogotá than in the
rest of Colombia, as shown in Graph 11 and Graph 1312. While
in the capital there is a continuous fall in the proportion of
homicides committed with a firearm since 1995, this variable
has actually grown continuously during the whole period of
study for the whole country. While the level of homicidal
violence has fallen in Bogotá, demand for weapons has
decreased among its residents. In the rest of the country, the
contrary happened: a pattern of more homicidal violence with
more guns has been prevalent. The rates per 100,000
inhabitants for deaths by firearm, and type of external cause in
Bogotá appear in table 28.
Table 28. Firearm death rates per 100,000 habitants, by
type, Bogotá, 1979-2003
Patterns of death by firearm, gender, and age in
Bogotá resemble those of Colombia as a whole. Throughout
the entire period, men constitute 93% of firearm victims both
in Bogotá and Colombia, while the proportion of total deaths is
around 50% (both in Bogotá as well the rest of Colombia). In
Colombia, 17% of men die as a result of firearms while in
Bogotá this proportion is only 12%. Both in Colombia and in
12 From the total of deaths in Bogotá involving the use of weapons
during the period 1979-2003, firearms are responsible for 75%, knives
for 24%, and explosives for 1% of deaths. This pattern is similar in
homicides. Only other external causes of death (e.g., suicides and
accidents) are associated with different instruments and methods.
Bogotá, less than 2% of women die in firearm-related incidents.
The numbers of firearm deaths by gender in Bogotá and
Colombia are shown in Table 29.
On the other side, the temporal trend in firearm
deaths among men in Bogotá as well as in Colombia shows a
close correlation with deaths due to homicides over the period,
increasing between 1979 and 1993, and then decreasing from
1993 onward. For women, this rate is relatively constant
between 1979 and 1993, as shown in Table 30 and Graph 14.
In Bogotá as well as in Colombia, the rate of firearm deaths for
men is tenfold that for women. In 2002, the rate for men in
Bogotá was 43 per 100,000 and 4 per 100,000 for women.
Table 29. Deaths by firearm and gender in Colombia and
Bogotá, 1979-2002
Year Accidents Suicides Homicides
Deaths by
firearm
1985 0.1 0.9 31.3 32.3
1986 0.1 0.6 30.3 31.1
1987 0.0 0.4 29.5 29.9
1988 0.0 0.2 28.3 28.5
1989 0.0 0.7 36.1 36.8
1990 0.1 1.0 37.7 38.8
1991 0.2 1.0 43.6 44.7
1992 0.1 0.9 49.0 50.0
1993 0.1 0.5 62.1 62.7
1994 0.1 1.0 53.6 54.6
1995 0.0 0.8 48.6 49.5
1996 0.0 0.6 47.3 47.9
1997 0.1 0.9 39.3 40.3
1998 0.0 2.1 30.6 32.8
1999 0.0 2.0 30.5 32.5
2000 0.0 1.7 27.5 29.3
2001 0.1 1.9 23.8 25.8
2002 0.0 1.3 21.4 22.7
2003 0.0 1.3 17.2 18.5
Source: DANE
Process by CERAC
Men Women Men Women
1979 3339 281 502 63
1980 4641 338 615 49
1981 6100 444 718 56
1982 6621 501 687 64
1983 6874 471 708 62
1984 7692 519 857 64
1985 10772 733 1277 115
1986 12664 812 1266 103
1987 13879 908 1265 89
1988 16313 1151 1237 88
1989 17704 1254 1634 130
1990 19102 1471 1779 130
1991 23227 1726 2114 149
1992 23258 1835 2396 206
1993 22844 1763 3131 227
1994 21523 1614 2800 211
1995 19820 1486 2641 168
1996 21433 1617 2590 194
1997 20692 1558 2213 185
1998 20296 1522 1868 134
1999 21676 1573 1892 148
2000 24598 1763 1751 133
2001 25477 2043 1557 136
2002 26789 2110 1396 131
Source: DANE
Processed by CERAC
Year
Colombia Bogotá
Documentos de trabajo cerac – número 14 – diciembre 2009 33
Table 30. Death rates by firearm and gender in Colombia
and Bogotá, 1985-2002
The age structure of deaths is similar in Bogotá and
Colombia. Deaths by external causes and deaths by firearm are
both concentrated among individuals aged 20 to 29 years (40%
of the total), followed by individuals aged 30 to 39 (26%), and
10 to 19 (14%), as shown in Graph 14.
Graph 16 and Graph 16 show that up to age 14 and
after age 40, deaths are largely attributable to natural causes,
both in Bogotá and in the rest of Colombia. Deaths occurring
to individuals aged 15 to 40 are due in large part to external
causes, particularly firearms, with the highest concentration
between 24 and 29.
Graph 14. Decomposition of deaths by age groups, Bogotá,
1979-2002.
Graph 15. Death rates by external cause, firearm, and gender, Bogotá,
1985-2002
Men Women Men Women
1985 68 5 63 5
1986 79 5 61 4
1987 85 5 59 4
1988 98 7 56 4
1989 104 7 72 5
1990 110 8 76 5
1991 131 10 88 6
1992 129 10 97 8
1993 124 9 123 8
1994 115 8 107 7
1995 104 8 98 6
1996 110 8 93 6
1997 105 8 78 6
1998 101 7 64 4
1999 105 7 63 5
2000 118 8 57 4
2001 120 9 49 4
2002 124 10 43 4
Source: DANE
Processed by CERAC
Year
Colombia Bogotá
1%
14%
40%
26%
12%
5%
2%
0%
0%
0%
1 to 9 10 to 19 20 to 29 30 to 39 40 to 49
50 to 59 60 to 69 70 to 79 80 or more Undetermined
0
50
100
150
200
250
1985
1986
1987
1988
1989
1990
1991
1992
1993
1994
1995
1996
1997
1998
1999
2000
2001
2002
Rateper100.000inhabitants
External cause - Men External Cause - Woman By firearm - Men By firearm - Women
Source: DANE
Processed by CERAC
Documentos de trabajo cerac – número 14 – diciembre 2009 34
Graph 16. Total deaths, deaths by natural causes, deaths by external causes, and deaths by firearms, Bogotá, 1979-2002
Graph 16. Total deaths, deaths by natural causes, deaths by external causes, and deaths by firearms, Colombia, 1979-2002
0
10000
20000
30000
40000
50000
60000
2
to
4
years5
to
9
years
10
to
14
years
15
to
19
years
20
to
24
years
25
to
29
years
30
to
34
years
35
to
39
years
40
to
44
years
45
to
49
years
50
to
54
years
55
to
59
years
60
to
64
years
65
to
69
years
70
to
74
years
75
to
79
years
80
to
84
years
85+
Total Natural Causes External Causes By firearmSource: DANE
Processed by CERAC
0
50000
100000
150000
200000
250000
300000
350000
400000
2
to
4
years5
to
9
years
10
to
14
years
15
to
19
years
20
to
24
years
25
to
29
years
30
to
34
years
35
to
39
years
40
to
44
years
45
to
49
years
50
to
54
years
55
to
59
years
60
to
64
years
65
to
69
years
70
to
74
years
75
to
79
years
80
to
84
years
85+
Total Natural Causes External Causes By firearm
Source: DANE
Processed by CERAC
Documentos de trabajo cerac – número 14 – diciembre 2009 35
In spite of the substantial reduction in firearm deaths
in Bogotá, the rate is still quite high by international standards.
In Mexico City, for example, the proportion of firearm deaths
to total deaths peaks in 1987 at 2.3% while Bogotá reaches a
peak of 12% in 1993. In 2002, that proportion in Mexico City
was 1.2% while for Bogotá, continues been higher: 5%. As in
Bogotá (and the rest of Colombia), the majority of deaths due
to firearms in México occur by homicide (roughly 80%). The
rate of deaths by firearm per 100,000 inhabitants in 2002 in
Mexico City was 8.15; in Bogotá that same year, the rate was
almost three times as great (23 per 100,000).
Nonetheless, Bogotá has been more fortunate than
other large Colombian cities such as Cali and Medellín. As
shown in Graph 17 and Table 31 Bogotá has a lower
proportion of deaths by firearm than these other cities. For the
whole period (1979-2002), Medellín had three times the
proportion of Bogotá (21%) and Cali one and a half times the
proportion (11%). Furthermore, firearm death rates in Cali and
Medellín have been higher than in Bogotá between 1979 and
2002 (See Table 31).
Graph 17. Deaths by firearm with respect to total deaths, Medellín, Cali, and Bogotá, 1979-2002
In conclusion, firearms demand for criminal intentions
in Bogotá has two well defined periods. The first is the period
from 1979 to 1993, when firearms deaths show a high growth
rate and contribute substantially to the number of total deaths
in the city. The second period, characterized by rapid violence
reduction, starts in 1993 and coincides with new firearms
regulation and new policy interventions. During the whole
period, firearms homicides are the main explanatory
phenomena that explain the deterioration and improvement of
human security in the city. At the same time, it is clear that
there is a dynamic demand for guns for homicidal use. Then,
the manner in which different policies have had an impact on
this particular demand will be analyzed in this document.
0%
5%
10%
15%
20%
25%
30%
35%
40%
1979
1980
1981
1982
1983
1984
1985
1986
1987
1988
1989
1990
1991
1992
1993
1994
1995
1996
1997
1998
1999
2000
2001
2002
Medellín Cali Bogotá
Source: DANE
Processed by CERAC
Documentos de trabajo cerac – número 14 – diciembre 2009 36
Table 31. Deaths by firearm with respect to total deaths, Medellín, Cali, and Bogotá, 1979-2000
Table 32. Deaths by firearm per 100,000 inhabitants, Medellín, Cali, and Bogotá, 1995-2002
Año Medellín Cali Bogotá
1979 4.3% 2.5% 3.2%
1980 5.6% 3.1% 3.8%
1981 7.5% 4.3% 4.1%
1982 7.2% 4.0% 4.5%
1983 7.1% 3.4% 4.6%
1984 9.4% 4.9% 5.0%
1985 13.0% 9.0% 6.1%
1986 16.4% 11.0% 6.9%
1987 18.8% 7.1% 6.6%
1988 23.2% 6.9% 6.7%
1989 26.9% 8.3% 7.7%
1990 32.1% 8.3% 8.2%
1991 35.9% 10.9% 9.2%
1992 32.8% 12.1% 9.9%
1993 30.1% 13.9% 11.8%
1994 26.8% 16.5% 10.7%
1995 23.8% 15.3% 9.8%
1996 22.6% 14.1% 9.5%
1997 20.7% 11.5% 8.5%
1998 19.0% 12.4% 7.5%
1999 19.8% 13.6% 7.2%
2000 19.9% 13.9% 6.6%
2001 20.7% 13.5% 5.9%
2002 21.4% 13.5% 5.2%
Total 1979-2002 21.0% 10.7% 7.3%
Año Medellín Cali Bogotá
1995 211 101 49
1996 195 95 48
1997 172 71 40
1998 146 79 33
1999 158 91 33
2000 151 89 29
2001 164 89 26
2002 170 86 23
Documentos de trabajo cerac – número 14 – diciembre 2009 37
3.3.1 Recent patterns in homicide in the
Colombian cities: National Police Data
The level of homicide violence is a good proxy of the level of
firearm violence in Colombia, insofar as a large proportion of
homicides are perpetrated with firearms.
In each of the three largest Colombian cities (Bogotá, Medellín
and Cali), an upward trend in homicides occurs until the year
1994, at which point violence begins to diminish until 2002
(Graph 19). Medellín remarkably reduced its contribution to the
total number of homicides in 1991 and also in 2002.
The annual variation in homicides in Colombia over the last
two decades can be explained by the annual variation in rates of
municipalities other than Bogotá. Nonetheless, the annual
variation of homicides in Bogotá has strongly influenced the
annual variation of national homicides in the years 1989, 1993-
1994, and 1997. It is also worth noticing that the trend of
homicides in Bogotá moves in the opposite direction to that of
Colombia during the period 1989–1993 (see Graph 21).
Graph 19. Evolution of homicide level in Bogotá, Medellín, Cali, 1988-2009
0
500
1.000
1.500
2.000
2.500
3.000
3.500
4.000
4.500
5.000
1990
1991
1992
1993
1994
1995
1996
1997
1998
1999
2000
2001
2002
2003
2004
2005
2006
2007
2008
2009
Medellín,BogotáyCali
0
5.000
10.000
15.000
20.000
25.000
30.000
35.000
Colombia
Medellín Bogotá Cali Colombia
Documento CERAC No. 14: Assessing the Effect of Policy Interventions on Small Arms Demand in Bogotá, Colombia

Weitere ähnliche Inhalte

Ähnlich wie Documento CERAC No. 14: Assessing the Effect of Policy Interventions on Small Arms Demand in Bogotá, Colombia

Analysis of Programs, Models of Social Intervention and Interdisciplinary Tea...
Analysis of Programs, Models of Social Intervention and Interdisciplinary Tea...Analysis of Programs, Models of Social Intervention and Interdisciplinary Tea...
Analysis of Programs, Models of Social Intervention and Interdisciplinary Tea...BASPCAN
 
121G Law Essay One, B- Grade - Judges Should Be
121G Law Essay One, B- Grade - Judges Should Be121G Law Essay One, B- Grade - Judges Should Be
121G Law Essay One, B- Grade - Judges Should BeSamantha Vargas
 
Psy 303 Arg Exceptional Education / snaptutorial.com
Psy 303 Arg Exceptional Education / snaptutorial.comPsy 303 Arg Exceptional Education / snaptutorial.com
Psy 303 Arg Exceptional Education / snaptutorial.comBaileya71
 
Essay On The Cold War.pdf
Essay On The Cold War.pdfEssay On The Cold War.pdf
Essay On The Cold War.pdfAmanda Dahya
 
digitaltech_university_0.rarDigitalTech Universitycontact.docx
digitaltech_university_0.rarDigitalTech Universitycontact.docxdigitaltech_university_0.rarDigitalTech Universitycontact.docx
digitaltech_university_0.rarDigitalTech Universitycontact.docxduketjoy27252
 
Psy 303 arg Education Organization-snaptutorial.com
Psy 303 arg Education Organization-snaptutorial.comPsy 303 arg Education Organization-snaptutorial.com
Psy 303 arg Education Organization-snaptutorial.comrobertlesew34
 
Psy 303 Effective Communication / snaptutorial.com
Psy 303  Effective Communication / snaptutorial.comPsy 303  Effective Communication / snaptutorial.com
Psy 303 Effective Communication / snaptutorial.comHarrisGeorg37
 
Corruption, Norms, and Legal Enforcement Evidence from Diplom.docx
Corruption, Norms, and Legal Enforcement Evidence from Diplom.docxCorruption, Norms, and Legal Enforcement Evidence from Diplom.docx
Corruption, Norms, and Legal Enforcement Evidence from Diplom.docxrichardnorman90310
 
5 Paragraph Expository Essay Ppt
5 Paragraph Expository Essay Ppt5 Paragraph Expository Essay Ppt
5 Paragraph Expository Essay PptAndrea Lawson
 
5 Paragraph Expository Essay Ppt
5 Paragraph Expository Essay Ppt5 Paragraph Expository Essay Ppt
5 Paragraph Expository Essay PptLisa Thompson
 
Case StudyCities and Communities Quality of Life IndicatorsBa.docx
Case StudyCities and Communities Quality of Life IndicatorsBa.docxCase StudyCities and Communities Quality of Life IndicatorsBa.docx
Case StudyCities and Communities Quality of Life IndicatorsBa.docxketurahhazelhurst
 
Market Segmentation Essay
Market Segmentation EssayMarket Segmentation Essay
Market Segmentation EssayBrittney Hall
 
Medical Anthropology Essay Questions
Medical Anthropology Essay QuestionsMedical Anthropology Essay Questions
Medical Anthropology Essay QuestionsLori Nava
 
Countering the Financing of Terrorism-Law and Policy Conference
Countering the Financing of Terrorism-Law and Policy ConferenceCountering the Financing of Terrorism-Law and Policy Conference
Countering the Financing of Terrorism-Law and Policy ConferenceChicagoKent565
 
Anthropology Research Paper. Cultural Anthropolo
Anthropology Research Paper. Cultural AnthropoloAnthropology Research Paper. Cultural Anthropolo
Anthropology Research Paper. Cultural AnthropoloKimberly Harris
 

Ähnlich wie Documento CERAC No. 14: Assessing the Effect of Policy Interventions on Small Arms Demand in Bogotá, Colombia (20)

Documento CERAC No. 4: The Work of Amnesty International and Human Rights Wat...
Documento CERAC No. 4: The Work of Amnesty International and Human Rights Wat...Documento CERAC No. 4: The Work of Amnesty International and Human Rights Wat...
Documento CERAC No. 4: The Work of Amnesty International and Human Rights Wat...
 
Analysis of Programs, Models of Social Intervention and Interdisciplinary Tea...
Analysis of Programs, Models of Social Intervention and Interdisciplinary Tea...Analysis of Programs, Models of Social Intervention and Interdisciplinary Tea...
Analysis of Programs, Models of Social Intervention and Interdisciplinary Tea...
 
Documento CERAC No. 3: Quantification of the financial resources required to...
Documento CERAC No. 3: Quantification of the financial resources required  to...Documento CERAC No. 3: Quantification of the financial resources required  to...
Documento CERAC No. 3: Quantification of the financial resources required to...
 
121G Law Essay One, B- Grade - Judges Should Be
121G Law Essay One, B- Grade - Judges Should Be121G Law Essay One, B- Grade - Judges Should Be
121G Law Essay One, B- Grade - Judges Should Be
 
Documento CERAC No. 5: The design and implementation of an optimal reparation...
Documento CERAC No. 5: The design and implementation of an optimal reparation...Documento CERAC No. 5: The design and implementation of an optimal reparation...
Documento CERAC No. 5: The design and implementation of an optimal reparation...
 
Psy 303 Arg Exceptional Education / snaptutorial.com
Psy 303 Arg Exceptional Education / snaptutorial.comPsy 303 Arg Exceptional Education / snaptutorial.com
Psy 303 Arg Exceptional Education / snaptutorial.com
 
Essay On The Cold War.pdf
Essay On The Cold War.pdfEssay On The Cold War.pdf
Essay On The Cold War.pdf
 
digitaltech_university_0.rarDigitalTech Universitycontact.docx
digitaltech_university_0.rarDigitalTech Universitycontact.docxdigitaltech_university_0.rarDigitalTech Universitycontact.docx
digitaltech_university_0.rarDigitalTech Universitycontact.docx
 
Psy 303 arg Education Organization-snaptutorial.com
Psy 303 arg Education Organization-snaptutorial.comPsy 303 arg Education Organization-snaptutorial.com
Psy 303 arg Education Organization-snaptutorial.com
 
Psy 303 Effective Communication / snaptutorial.com
Psy 303  Effective Communication / snaptutorial.comPsy 303  Effective Communication / snaptutorial.com
Psy 303 Effective Communication / snaptutorial.com
 
Corruption, Norms, and Legal Enforcement Evidence from Diplom.docx
Corruption, Norms, and Legal Enforcement Evidence from Diplom.docxCorruption, Norms, and Legal Enforcement Evidence from Diplom.docx
Corruption, Norms, and Legal Enforcement Evidence from Diplom.docx
 
CASE Network Studies and Analyses 429 - The International Crisis and Latin Am...
CASE Network Studies and Analyses 429 - The International Crisis and Latin Am...CASE Network Studies and Analyses 429 - The International Crisis and Latin Am...
CASE Network Studies and Analyses 429 - The International Crisis and Latin Am...
 
5 Paragraph Expository Essay Ppt
5 Paragraph Expository Essay Ppt5 Paragraph Expository Essay Ppt
5 Paragraph Expository Essay Ppt
 
5 Paragraph Expository Essay Ppt
5 Paragraph Expository Essay Ppt5 Paragraph Expository Essay Ppt
5 Paragraph Expository Essay Ppt
 
Case StudyCities and Communities Quality of Life IndicatorsBa.docx
Case StudyCities and Communities Quality of Life IndicatorsBa.docxCase StudyCities and Communities Quality of Life IndicatorsBa.docx
Case StudyCities and Communities Quality of Life IndicatorsBa.docx
 
Market Segmentation Essay
Market Segmentation EssayMarket Segmentation Essay
Market Segmentation Essay
 
Medical Anthropology Essay Questions
Medical Anthropology Essay QuestionsMedical Anthropology Essay Questions
Medical Anthropology Essay Questions
 
Countering the Financing of Terrorism-Law and Policy Conference
Countering the Financing of Terrorism-Law and Policy ConferenceCountering the Financing of Terrorism-Law and Policy Conference
Countering the Financing of Terrorism-Law and Policy Conference
 
Eu Essay Competition 2014
Eu Essay Competition 2014Eu Essay Competition 2014
Eu Essay Competition 2014
 
Anthropology Research Paper. Cultural Anthropolo
Anthropology Research Paper. Cultural AnthropoloAnthropology Research Paper. Cultural Anthropolo
Anthropology Research Paper. Cultural Anthropolo
 

Mehr von CERAC - Centro de Recursos para el Análisis de Conflictos

Mehr von CERAC - Centro de Recursos para el Análisis de Conflictos (20)

¿Que ganará Colombia con la paz?
¿Que ganará Colombia con la paz?¿Que ganará Colombia con la paz?
¿Que ganará Colombia con la paz?
 
Tipología del conflicto armado interno
Tipología del conflicto armado internoTipología del conflicto armado interno
Tipología del conflicto armado interno
 
Crecimiento, Conflicto Armado y Crimen Organizado: Evidencia para Colombia
Crecimiento, Conflicto Armado y Crimen Organizado: Evidencia para ColombiaCrecimiento, Conflicto Armado y Crimen Organizado: Evidencia para Colombia
Crecimiento, Conflicto Armado y Crimen Organizado: Evidencia para Colombia
 
Urban violence and humanitarian action in Medellin
Urban violence and humanitarian action in MedellinUrban violence and humanitarian action in Medellin
Urban violence and humanitarian action in Medellin
 
Capacidades institucionales en materia económica para municipios en Colombia
Capacidades institucionales en materia económica para municipios en ColombiaCapacidades institucionales en materia económica para municipios en Colombia
Capacidades institucionales en materia económica para municipios en Colombia
 
The Dynamics of the Colombian Civil Conflict: A New Data Set
The Dynamics of the Colombian Civil Conflict: A New Data SetThe Dynamics of the Colombian Civil Conflict: A New Data Set
The Dynamics of the Colombian Civil Conflict: A New Data Set
 
El Control de las armas de fuego: múltiples estrategias, pero no un plan inte...
El Control de las armas de fuego: múltiples estrategias, pero no un plan inte...El Control de las armas de fuego: múltiples estrategias, pero no un plan inte...
El Control de las armas de fuego: múltiples estrategias, pero no un plan inte...
 
Hacia un plan de desarme integral
Hacia un plan de desarme integralHacia un plan de desarme integral
Hacia un plan de desarme integral
 
Ritmos de la producción discursiva en análisis político. Un análisis cuantita...
Ritmos de la producción discursiva en análisis político. Un análisis cuantita...Ritmos de la producción discursiva en análisis político. Un análisis cuantita...
Ritmos de la producción discursiva en análisis político. Un análisis cuantita...
 
¿Reelección de la Seguridad Democrática?
¿Reelección de la Seguridad Democrática? ¿Reelección de la Seguridad Democrática?
¿Reelección de la Seguridad Democrática?
 
El control de armas como estrategia de reducción de la violencia en Colombia:...
El control de armas como estrategia de reducción de la violencia en Colombia:...El control de armas como estrategia de reducción de la violencia en Colombia:...
El control de armas como estrategia de reducción de la violencia en Colombia:...
 
Registrar, cuantificar y debatir. ¿Cómo se ha medido la violencia contra trab...
Registrar, cuantificar y debatir. ¿Cómo se ha medido la violencia contra trab...Registrar, cuantificar y debatir. ¿Cómo se ha medido la violencia contra trab...
Registrar, cuantificar y debatir. ¿Cómo se ha medido la violencia contra trab...
 
Las barras de fútbol en Colombia: Balance de la producción académica y alguna...
Las barras de fútbol en Colombia: Balance de la producción académica y alguna...Las barras de fútbol en Colombia: Balance de la producción académica y alguna...
Las barras de fútbol en Colombia: Balance de la producción académica y alguna...
 
Conflicto barrista en Kennedy: pistas para su transformación
Conflicto barrista en Kennedy: pistas para su transformaciónConflicto barrista en Kennedy: pistas para su transformación
Conflicto barrista en Kennedy: pistas para su transformación
 
Documento CERAC No. 2: Commodity Price Shocks and Civil Conflict: Evidence Fr...
Documento CERAC No. 2: Commodity Price Shocks and Civil Conflict: Evidence Fr...Documento CERAC No. 2: Commodity Price Shocks and Civil Conflict: Evidence Fr...
Documento CERAC No. 2: Commodity Price Shocks and Civil Conflict: Evidence Fr...
 
Documento CERAC No. 1: It's not how you play the game, it's winning that matt...
Documento CERAC No. 1: It's not how you play the game, it's winning that matt...Documento CERAC No. 1: It's not how you play the game, it's winning that matt...
Documento CERAC No. 1: It's not how you play the game, it's winning that matt...
 
Documento CERAC No. 21: Capacidades institucionales en materia económica para...
Documento CERAC No. 21: Capacidades institucionales en materia económica para...Documento CERAC No. 21: Capacidades institucionales en materia económica para...
Documento CERAC No. 21: Capacidades institucionales en materia económica para...
 
Documento CERAC No. 19: Masacre del 16 de mayo de 1998: una estrategia de con...
Documento CERAC No. 19: Masacre del 16 de mayo de 1998: una estrategia de con...Documento CERAC No. 19: Masacre del 16 de mayo de 1998: una estrategia de con...
Documento CERAC No. 19: Masacre del 16 de mayo de 1998: una estrategia de con...
 
Documento CERAC No. 18: Dinámicas y usos de la violencia neoparamilitar en el...
Documento CERAC No. 18: Dinámicas y usos de la violencia neoparamilitar en el...Documento CERAC No. 18: Dinámicas y usos de la violencia neoparamilitar en el...
Documento CERAC No. 18: Dinámicas y usos de la violencia neoparamilitar en el...
 
Documento CERAC No. 17: Mujeres Delincuentes en Colombia: Una aproximación a ...
Documento CERAC No. 17: Mujeres Delincuentes en Colombia: Una aproximación a ...Documento CERAC No. 17: Mujeres Delincuentes en Colombia: Una aproximación a ...
Documento CERAC No. 17: Mujeres Delincuentes en Colombia: Una aproximación a ...
 

Kürzlich hochgeladen

BDSM⚡Call Girls in Sector 143 Noida Escorts >༒8448380779 Escort Service
BDSM⚡Call Girls in Sector 143 Noida Escorts >༒8448380779 Escort ServiceBDSM⚡Call Girls in Sector 143 Noida Escorts >༒8448380779 Escort Service
BDSM⚡Call Girls in Sector 143 Noida Escorts >༒8448380779 Escort ServiceDelhi Call girls
 
KAHULUGAN AT KAHALAGAHAN NG GAWAING PANSIBIKO.pptx
KAHULUGAN AT KAHALAGAHAN NG GAWAING PANSIBIKO.pptxKAHULUGAN AT KAHALAGAHAN NG GAWAING PANSIBIKO.pptx
KAHULUGAN AT KAHALAGAHAN NG GAWAING PANSIBIKO.pptxjohnandrewcarlos
 
30042024_First India Newspaper Jaipur.pdf
30042024_First India Newspaper Jaipur.pdf30042024_First India Newspaper Jaipur.pdf
30042024_First India Newspaper Jaipur.pdfFIRST INDIA
 
Defensa de JOH insiste que testimonio de analista de la DEA es falso y solici...
Defensa de JOH insiste que testimonio de analista de la DEA es falso y solici...Defensa de JOH insiste que testimonio de analista de la DEA es falso y solici...
Defensa de JOH insiste que testimonio de analista de la DEA es falso y solici...AlexisTorres963861
 
How Europe Underdeveloped Africa_walter.pdf
How Europe Underdeveloped Africa_walter.pdfHow Europe Underdeveloped Africa_walter.pdf
How Europe Underdeveloped Africa_walter.pdfLorenzo Lemes
 
Powerful Love Spells in Phoenix, AZ (310) 882-6330 Bring Back Lost Lover
Powerful Love Spells in Phoenix, AZ (310) 882-6330 Bring Back Lost LoverPowerful Love Spells in Phoenix, AZ (310) 882-6330 Bring Back Lost Lover
Powerful Love Spells in Phoenix, AZ (310) 882-6330 Bring Back Lost LoverPsychicRuben LoveSpells
 
TDP As the Party of Hope For AP Youth Under N Chandrababu Naidu’s Leadership
TDP As the Party of Hope For AP Youth Under N Chandrababu Naidu’s LeadershipTDP As the Party of Hope For AP Youth Under N Chandrababu Naidu’s Leadership
TDP As the Party of Hope For AP Youth Under N Chandrababu Naidu’s Leadershipanjanibaddipudi1
 
Pakistan PMLN Election Manifesto 2024.pdf
Pakistan PMLN Election Manifesto 2024.pdfPakistan PMLN Election Manifesto 2024.pdf
Pakistan PMLN Election Manifesto 2024.pdfFahimUddin61
 
如何办理(BU学位证书)美国贝翰文大学毕业证学位证书
如何办理(BU学位证书)美国贝翰文大学毕业证学位证书如何办理(BU学位证书)美国贝翰文大学毕业证学位证书
如何办理(BU学位证书)美国贝翰文大学毕业证学位证书Fi L
 
Israel Palestine Conflict, The issue and historical context!
Israel Palestine Conflict, The issue and historical context!Israel Palestine Conflict, The issue and historical context!
Israel Palestine Conflict, The issue and historical context!Krish109503
 
Enjoy Night⚡Call Girls Rajokri Delhi >༒8448380779 Escort Service
Enjoy Night⚡Call Girls Rajokri Delhi >༒8448380779 Escort ServiceEnjoy Night⚡Call Girls Rajokri Delhi >༒8448380779 Escort Service
Enjoy Night⚡Call Girls Rajokri Delhi >༒8448380779 Escort ServiceDelhi Call girls
 
Embed-2 (1).pdfb[k[k[[k[kkkpkdpokkdpkopko
Embed-2 (1).pdfb[k[k[[k[kkkpkdpokkdpkopkoEmbed-2 (1).pdfb[k[k[[k[kkkpkdpokkdpkopko
Embed-2 (1).pdfb[k[k[[k[kkkpkdpokkdpkopkobhavenpr
 
Lorenzo D'Emidio_Lavoro sullaNorth Korea .pptx
Lorenzo D'Emidio_Lavoro sullaNorth Korea .pptxLorenzo D'Emidio_Lavoro sullaNorth Korea .pptx
Lorenzo D'Emidio_Lavoro sullaNorth Korea .pptxlorenzodemidio01
 
Julius Randle's Injury Status: Surgery Not Off the Table
Julius Randle's Injury Status: Surgery Not Off the TableJulius Randle's Injury Status: Surgery Not Off the Table
Julius Randle's Injury Status: Surgery Not Off the Tableget joys
 
2024 04 03 AZ GOP LD4 Gen Meeting Minutes FINAL.docx
2024 04 03 AZ GOP LD4 Gen Meeting Minutes FINAL.docx2024 04 03 AZ GOP LD4 Gen Meeting Minutes FINAL.docx
2024 04 03 AZ GOP LD4 Gen Meeting Minutes FINAL.docxkfjstone13
 
Call Girls in Mira Road Mumbai ( Neha 09892124323 ) College Escorts Service i...
Call Girls in Mira Road Mumbai ( Neha 09892124323 ) College Escorts Service i...Call Girls in Mira Road Mumbai ( Neha 09892124323 ) College Escorts Service i...
Call Girls in Mira Road Mumbai ( Neha 09892124323 ) College Escorts Service i...Pooja Nehwal
 
Nara Chandrababu Naidu's Visionary Policies For Andhra Pradesh's Development
Nara Chandrababu Naidu's Visionary Policies For Andhra Pradesh's DevelopmentNara Chandrababu Naidu's Visionary Policies For Andhra Pradesh's Development
Nara Chandrababu Naidu's Visionary Policies For Andhra Pradesh's Developmentnarsireddynannuri1
 
28042024_First India Newspaper Jaipur.pdf
28042024_First India Newspaper Jaipur.pdf28042024_First India Newspaper Jaipur.pdf
28042024_First India Newspaper Jaipur.pdfFIRST INDIA
 
Kishan Reddy Report To People (2019-24).pdf
Kishan Reddy Report To People (2019-24).pdfKishan Reddy Report To People (2019-24).pdf
Kishan Reddy Report To People (2019-24).pdfKISHAN REDDY OFFICE
 
BDSM⚡Call Girls in Sector 135 Noida Escorts >༒8448380779 Escort Service
BDSM⚡Call Girls in Sector 135 Noida Escorts >༒8448380779 Escort ServiceBDSM⚡Call Girls in Sector 135 Noida Escorts >༒8448380779 Escort Service
BDSM⚡Call Girls in Sector 135 Noida Escorts >༒8448380779 Escort ServiceDelhi Call girls
 

Kürzlich hochgeladen (20)

BDSM⚡Call Girls in Sector 143 Noida Escorts >༒8448380779 Escort Service
BDSM⚡Call Girls in Sector 143 Noida Escorts >༒8448380779 Escort ServiceBDSM⚡Call Girls in Sector 143 Noida Escorts >༒8448380779 Escort Service
BDSM⚡Call Girls in Sector 143 Noida Escorts >༒8448380779 Escort Service
 
KAHULUGAN AT KAHALAGAHAN NG GAWAING PANSIBIKO.pptx
KAHULUGAN AT KAHALAGAHAN NG GAWAING PANSIBIKO.pptxKAHULUGAN AT KAHALAGAHAN NG GAWAING PANSIBIKO.pptx
KAHULUGAN AT KAHALAGAHAN NG GAWAING PANSIBIKO.pptx
 
30042024_First India Newspaper Jaipur.pdf
30042024_First India Newspaper Jaipur.pdf30042024_First India Newspaper Jaipur.pdf
30042024_First India Newspaper Jaipur.pdf
 
Defensa de JOH insiste que testimonio de analista de la DEA es falso y solici...
Defensa de JOH insiste que testimonio de analista de la DEA es falso y solici...Defensa de JOH insiste que testimonio de analista de la DEA es falso y solici...
Defensa de JOH insiste que testimonio de analista de la DEA es falso y solici...
 
How Europe Underdeveloped Africa_walter.pdf
How Europe Underdeveloped Africa_walter.pdfHow Europe Underdeveloped Africa_walter.pdf
How Europe Underdeveloped Africa_walter.pdf
 
Powerful Love Spells in Phoenix, AZ (310) 882-6330 Bring Back Lost Lover
Powerful Love Spells in Phoenix, AZ (310) 882-6330 Bring Back Lost LoverPowerful Love Spells in Phoenix, AZ (310) 882-6330 Bring Back Lost Lover
Powerful Love Spells in Phoenix, AZ (310) 882-6330 Bring Back Lost Lover
 
TDP As the Party of Hope For AP Youth Under N Chandrababu Naidu’s Leadership
TDP As the Party of Hope For AP Youth Under N Chandrababu Naidu’s LeadershipTDP As the Party of Hope For AP Youth Under N Chandrababu Naidu’s Leadership
TDP As the Party of Hope For AP Youth Under N Chandrababu Naidu’s Leadership
 
Pakistan PMLN Election Manifesto 2024.pdf
Pakistan PMLN Election Manifesto 2024.pdfPakistan PMLN Election Manifesto 2024.pdf
Pakistan PMLN Election Manifesto 2024.pdf
 
如何办理(BU学位证书)美国贝翰文大学毕业证学位证书
如何办理(BU学位证书)美国贝翰文大学毕业证学位证书如何办理(BU学位证书)美国贝翰文大学毕业证学位证书
如何办理(BU学位证书)美国贝翰文大学毕业证学位证书
 
Israel Palestine Conflict, The issue and historical context!
Israel Palestine Conflict, The issue and historical context!Israel Palestine Conflict, The issue and historical context!
Israel Palestine Conflict, The issue and historical context!
 
Enjoy Night⚡Call Girls Rajokri Delhi >༒8448380779 Escort Service
Enjoy Night⚡Call Girls Rajokri Delhi >༒8448380779 Escort ServiceEnjoy Night⚡Call Girls Rajokri Delhi >༒8448380779 Escort Service
Enjoy Night⚡Call Girls Rajokri Delhi >༒8448380779 Escort Service
 
Embed-2 (1).pdfb[k[k[[k[kkkpkdpokkdpkopko
Embed-2 (1).pdfb[k[k[[k[kkkpkdpokkdpkopkoEmbed-2 (1).pdfb[k[k[[k[kkkpkdpokkdpkopko
Embed-2 (1).pdfb[k[k[[k[kkkpkdpokkdpkopko
 
Lorenzo D'Emidio_Lavoro sullaNorth Korea .pptx
Lorenzo D'Emidio_Lavoro sullaNorth Korea .pptxLorenzo D'Emidio_Lavoro sullaNorth Korea .pptx
Lorenzo D'Emidio_Lavoro sullaNorth Korea .pptx
 
Julius Randle's Injury Status: Surgery Not Off the Table
Julius Randle's Injury Status: Surgery Not Off the TableJulius Randle's Injury Status: Surgery Not Off the Table
Julius Randle's Injury Status: Surgery Not Off the Table
 
2024 04 03 AZ GOP LD4 Gen Meeting Minutes FINAL.docx
2024 04 03 AZ GOP LD4 Gen Meeting Minutes FINAL.docx2024 04 03 AZ GOP LD4 Gen Meeting Minutes FINAL.docx
2024 04 03 AZ GOP LD4 Gen Meeting Minutes FINAL.docx
 
Call Girls in Mira Road Mumbai ( Neha 09892124323 ) College Escorts Service i...
Call Girls in Mira Road Mumbai ( Neha 09892124323 ) College Escorts Service i...Call Girls in Mira Road Mumbai ( Neha 09892124323 ) College Escorts Service i...
Call Girls in Mira Road Mumbai ( Neha 09892124323 ) College Escorts Service i...
 
Nara Chandrababu Naidu's Visionary Policies For Andhra Pradesh's Development
Nara Chandrababu Naidu's Visionary Policies For Andhra Pradesh's DevelopmentNara Chandrababu Naidu's Visionary Policies For Andhra Pradesh's Development
Nara Chandrababu Naidu's Visionary Policies For Andhra Pradesh's Development
 
28042024_First India Newspaper Jaipur.pdf
28042024_First India Newspaper Jaipur.pdf28042024_First India Newspaper Jaipur.pdf
28042024_First India Newspaper Jaipur.pdf
 
Kishan Reddy Report To People (2019-24).pdf
Kishan Reddy Report To People (2019-24).pdfKishan Reddy Report To People (2019-24).pdf
Kishan Reddy Report To People (2019-24).pdf
 
BDSM⚡Call Girls in Sector 135 Noida Escorts >༒8448380779 Escort Service
BDSM⚡Call Girls in Sector 135 Noida Escorts >༒8448380779 Escort ServiceBDSM⚡Call Girls in Sector 135 Noida Escorts >༒8448380779 Escort Service
BDSM⚡Call Girls in Sector 135 Noida Escorts >༒8448380779 Escort Service
 

Documento CERAC No. 14: Assessing the Effect of Policy Interventions on Small Arms Demand in Bogotá, Colombia

  • 1. 14 Assessing the Effect of Policy Interventions on Small Arms Demand in Bogotá, Colombia Katherine Aguirre, Óscar Becerra, Simón Mesa y Jorge A. Restrepo Diciembre, 2009
  • 2. ISSN: 1909 – 1397 CERAC – Centro de Recursos para el Análisis de Conflictos Calle 55 No. 5 – 22 Tel: 2170200 Bogotá, Colombia www.cerac.org.co El Centro de Recursos para el Análisis de Conflictos (CERAC) es un centro de investigación privado e independiente, especializado en la generación de recursos para la investigación sobre violencia, el análisis de conflictos armados y el estudio de sus impactos sobre el desarrollo socioeconómico y el bienestar de las personas. CERAC no tiene filiación partidista o gubernamental alguna. CERAC busca contribuir a la reducción de la violencia y su impacto sobre las personas, las comunidades y la sociedad, mediante la investigación en ciencias sociales basada en evidencia, el desarrollo de tecnologías e innovación, además de participar en el diseño, implementación y evaluación de políticas públicas e intervenciones dirigidas a reducir la violencia armada. (Para mayor información visítese: http://www.cerac.org.co/acercade.htm) La Serie Documentos de CERAC son publicaciones ocasionales de los resultados preliminares y avances de investigación de los miembros de CERAC, sus investigadores asociados, o de investigadores que han hecho uso de los recursos del Centro. Estos documentos son trabajo en curso, y como tal, están sujetos a modificaciones. Sus autores agradecen la retroalimentación y comentarios de los lectores. El contenido de los documentos de la Serie no representa la posición oficial de CERAC, los miembros de sus organismos de dirección o las entidades que proveen apoyo al centro. Sobre los autores Katherine Aguirre es economista de la Universidad del Valle. Ha sido investigadora de CERAC desde 2005 donde trabaja en temas relacionados con violencia armada y desarrollo. Oscar Becerra es economista de la Universidad Nacional de Colombia y tiene una maestría en Matemáticas Aplicadas de la misma universidad. Actualmente es asistente de investigación del Banco Interamericano de Desarrollo. Simón Mesa es economista de la Universidad de los Andes. Actualmente es Economista de la Dirección Técnica de la Empresa de Renovación Urbana en Bogotá. Jorge Restrepo es Profesor Asociado del Departamento de Economía de la Pontificia Universidad Javeriana. Economista de esta misma universidad, con estudios de postgrado en economía en la Universidad de Cambridge y el Royal Holloway College-Universidad de Londres, donde obtuvo grados de MSc y PhD en economía. Es Director y fundador de CERAC. The Conflict Analysis Resource Center (CERAC) is a private an independent think tank, focused in the generation of resources to study violence, armed conflicts and their impact on social and economic development and people’s welfare. CERAC does not have any partisan or governmental affiliation. The Center aims to contribute to the reduction of violence and its impact on individuals and communities, through social science research based on verifiable information; the development of technologies and innovation, and the involvement in the design, implementation and evaluation of public policies and interventions. (For more information, visit: www.cerac.org.co/aboutus.htm) The Working Papers Series of CERAC are occasional publications of preliminary research outputs and results of its staff members, its associated researchers, or from researchers that have used the resources of the Center. These documents are work in progress, and thus, are subject to changes. Their authors welcome feedback and comments of readers. The content of the Working Papers Series does not represent CERAC´s points of view, the members of their direction organisms or the entities that provide support to the Center. About the authors Katherine Aguirre holds a B.S. in economics from the Universidad del Valle. She has been a researcher at CERAC since 2005 where she studied topics related with armed violence and development. Oscar Becerra holds a M.Sc. in applied mathematics and a B.S. in economics from the Universidad Nacional de Colombia. Currently Oscar is working as Research Assistant at the Research Department of the Inter American Development Bank. Simón Mesa holds a B.S. in economics from the Universidad de los Andes. Currently is economist of the Empresa de Renovación Urbana in Bogota. Jorge Restrepo is Associate Professor of the Department of Economics of the Pontificia Universidad Javeriana. He holds a B.S. in economics from this university. Also studied at the Cambridge University and the Royal Holloway College-University of London, where he obtained MSc and PhD degrees in economics. He is director and founder of CERAC. Este es un documento de trabajo que ha sido posible gracias al apoyo de:
  • 3. Documentos de trabajo cerac – número 14 – diciembre 2009 1 documentos de trabajo cerac número 14 diciembre de 2009 Assessing the Effect of Policy Interventions on Small Arms Demand in Bogotá, Colombia Katherine Aguirre, Óscar Becerra, Simón Mesa and Jorge A. Restrepo * ** Resumen: In this document, we assess the market associated with the criminal use of firearms. This assessment will distinguish demand for firearms along two main axes: the markets in which they can be obtained (legal and illegal markets) and how individuals use them (criminally and non-criminally). Specifically, we will explore the impact that active anti-gun policies and other security interventions, established in the mid-1990s, had on reducing firearm-related homicides in Bogotá. After reviewing the general context, we will introduce the policies that have been implemented by local administrations during the period in which the homicide rate fell drastically. We then use a variety a statistical methods to assess the impact of gun- carrying and violence reduction interventions on homicide in Bogotá. The last section concludes. * Katherine Aguirre is researcher at CERAC. Óscar Becerra is working as Research Assistant at the Research Department of the Inter American Development Bank. Simón Mesa is economist of the Empresa de Renovación Urbana in Bogotá. Jorge A. Restrepo is Associate Professor of the Department of Economics of the Pontificia Universidad Javeriana and Director of CERAC. Corresponding author katherine.aguirre@cerac.org.co ** Brodie Ferguson contributed significantly to improve the quality of this report. CERAC also wants to acknowledge the help from the several institutions that contributed in making data available for this study, including the Centro de Estudios y Análisis en Convivencia y Seguridad Ciudadana from the Mayorship of Bogotá, the Centro Nacional de Referencia sobre Violencia from the Instituto Nacional de Medicina Legal y Ciencias Forenses, the Centro de Investigaciones Criminológicas-CIC from the National Police of Colombia, the Military Industry of Colombia (Indumil) and the Departamento de Control y Comercio de Armas, Municiones y Explosivos (DCCAE)
  • 4. Documentos de trabajo cerac – número 14 – diciembre 2009 2 TABLE OF CONTENTS 1. Study objectives ............................................................................................................................................................................ 3 2. Context........................................................................................................................................................................................... 4 2.1 The Small Arms Demand Model...................................................................................................................................... 4 2.2 Preferences and Small Arms Demand Realization......................................................................................................... 4 2.3 Firearms and Prices............................................................................................................................................................. 7 2.4 Resources.............................................................................................................................................................................. 8 3. Firearms Demand in Bogotá..................................................................................................................................................... 10 3.1 Legal Demand.................................................................................................................................................................... 10 3.2 Illegal Demand and compliance with firearms regulations......................................................................................... 15 3.3 Demand for Use: Firearms Deaths in Bogotá.............................................................................................................. 24 4. Interventions ............................................................................................................................................................................... 41 4.1 Mayoral Administrations.................................................................................................................................................. 41 4.2 Police Enforcement .......................................................................................................................................................... 42 4.3 Arms and Alcohol Interventions .................................................................................................................................... 42 5. Intervention Effects................................................................................................................................................................... 45 5.1 Perception Surveys: Subjective Indicators..................................................................................................................... 45 5.2 Impact of Firearm control on the Homicide Level in Bogotá................................................................................... 47 6. Conclusions ................................................................................................................................................................................. 52 7. References.................................................................................................................................................................................... 53 8. Annex 1........................................................................................................................................................................................ 55 9. Annex 2........................................................................................................................................................................................ 59
  • 5. Documentos de trabajo cerac – número 14 – diciembre 2009 3 1. STUDY OBJECTIVES In Bogotá, some 50,000 people died in firearm-related events between 1979 and 2009. This constitutes roughly 8% of the total number of deaths, by natural or external causes, registered in the Colombian capital. While the impact of firearms in Bogotá is smaller than in Colombia as a whole, where approximately 11% of deaths have been attributed to firearms, Bogotá contributed 10% of all firearms deaths in Colombia over the period 1979 to 2009. In Bogotá as in the rest of Colombia, homicides are the primary event through which firearms deaths occur (more than 90% of cases). In 2009, there were over 15,000 homicides registered in Colombia. Despite an impressive reduction since 2002 (26.8%), and this figure being the lowest in more than 20 years, the homicide rate in Colombia continues to rank as one of the highest in the world, if not the highest. Improvements in the city of Bogotá have contributed substantially to the overall reduction in homicides. The city has experienced an impressive reduction of homicide violence since its peak in 1993, when the number of homicides rose from 3,000 in 1992 to almost 4,500, a 33% increase. According to the National Police, the figure of 2009 of Bogotá was 1,327 a reduction of around 70% with respect to the 1993 level. The current homicide rate of 18 per 100,000 inhabitants is still quite high, but contrasts with the rate of 1993 of 80 per 100.000. The contribution of Bogotá to the total number of homicides of the country has not declined at the same speed as the level of homicides. For the 2007, the Ministry of Defence says that the capital contribute with 32.7 per cent in the decrease of the homicides in the whole country (Bogotá.gov.co, 2006). Violence in Colombia is a result of two interconnected complex social phenomena. The first is the prevalence of entrenched criminal organisations, mainly involved in the production and transport of illegal narcotics. The second is the three-sided armed conflict between the government, guerrilla groups and paramilitary groups (Aguirre et, al., 2006; p2). The situation in Bogotá is influenced more by common urban delinquency by conflict dynamics. In this document, we assess the market associated with the criminal use of firearms. Recent academic studies highlighted demand for firearms for violent use (Brauer and Muggah, 2005). This assessment will distinguish demand for firearms along two main axes: the markets in which they can be obtained (legal and illegal markets) and how individuals use them (criminally and non-criminally). Specifically, we will explore the impact that active anti- gun policies and other security interventions, established in the mid-1990s, had on reducing firearm-related homicides in Bogotá. After reviewing the general context, we will introduce the policies that have been implemented by local administrations during the period in which the homicide rate fell drastically. We then use a variety a statistical methods to assess the impact of gun-carrying and violence reduction interventions on homicide in Bogotá. The last section concludes.
  • 6. Documentos de trabajo cerac – número 14 – diciembre 2009 4 2. CONTEXT 2.1 The Small Arms Demand Model The subject of demand for small arms has been relatively neglected in the academic literature. Brauer and Muggah (2005) note that policy emphasis has been on the “supply-side of the small arms market,” such as export-control regimes, weapon registries, and arms and ammunition marking and tracing. Nonetheless, many acknowledge supply-side policies have limited effectiveness due to the nature of small arms and the political economy of production and distribution. Brauer (2004) argues that small arms are “harder to reign in from the supply-side since, by definition, they are relatively easy to produce, transport, hide and smuggle, they are durable and long-lasting, and, moreover, control regimes require a sophistication of internal and global coordination beyond the capacity of many states to implement” (Brauer, 2004). Recently, however, the demand for small arms has received increasing attention in both research and policy arenas. The demand model of the Small Arms Survey (hereafter, SAS) posits that demand can be explained by the confluence of individual’s preferences, their resources, and small arms prices. Brauer and Muggah (2005) elegantly articulate the concept thusly: “The ultimate expression of demand for small arms acquisition is governed by the interplay of motivations and means. In the extreme, a surfeit of means will not result in arms acquisition if accompanied by an utter lack of motive; conversely, the highest degree of motivation will not result in acquisition if the means – as broadly defined as we propose – are lacking. Both aspects must join for a choice to be made, for demand to be expressed, and for acquisition to take place.” According to the proposed model, resources may be monetary or non-monetary. Non-monetary resources include innate talent, education, strength, convictions, personal attributes, and personal or institutional resources as connections with other individuals. Prices are not only firearm prices, but relative prices of substitute and complementary goods. Brauer asserts that substitute goods are often expensive relative to complementary goods. For example, the cost of moving into a safer neighbourhood may be substantially greater than that of purchasing a firearm, since this includes not only time and money spent moving, but also the likelihood that property in the safer neighbourhood is more costly. Brauer and Muggah (2005) note that complementary goods prices, such as bullets and explosives, tend to be less expensive than substitute goods, and prove to be as effective as firearms. Brauer argues that analysis of small arms demand must consider an individual’s preferences in conjunction with his or her resources and the prices of alternate goods. Albeit consistent with economic theory, it is necessary to recognise that this model will need to take into account the differential circumstances of the demand of firearms with criminal intent. For a common criminal or a member of a criminal organisation, the firearm is a capital good required in order to engage in predatory activities. In an environment of high crime such as that in Colombia, common criminals seek guns with the intent of defending themselves from authorities and generating the sufficient threat in order to commit crimes. In a criminal organisation, guns appear as the tool for violence generation and for gaining control over areas of operations. In both cases, preferences are clearly biased towards demanding a gun to use it, much more in the case of organised crime. In the case of organised crime, resources are not a hampering influence for crime acquisition. As we will argue in the following sections, the fact that most of the violence in Colombia is generated by organised criminal groups and groups in conflict with the state requires the demand model to account for these particularities in order to fully understand the limited impact that gun control might have in the use of firearms. 2.2 Preferences and Small Arms Demand Realization While the demand model espoused by the SAS is consistent with economic theory, its measurement poses certain challenges. In our analysis of firearms demand in Bogotá, we make a distinction between legal and illegal markets as well as between criminal and non-criminal use. In Colombia, two markets for small arms demand can be recognized. The first market, legal and narrowly-regulated, is completely controlled by the state through a commercial organization known as the Military Industry (Indumil). At the same time, an illegal market of unknown size thrives, characterised by the availability of cheap firearms which are unavailable through legal channels and stimulated by criminal organisations and armed groups that have been operating for more than four decades in the country. Additionally, we propose that firearms can be used with two types of intentions: non-criminal and criminal. All firearms sought with non-criminal intention are considered legal, while
  • 7. Documentos de trabajo cerac – número 14 – diciembre 2009 5 those sought with criminal intention may be legal or illegal1. In Colombia, the legal use of firearms is subject to the holding or carrying permit with which they are issued (Chart 1). In the case of non-criminal demand, it is plausible to argue that the initial motivation for demand could be protection, status or even fetishism. In each of these cases, the SAS demand model would be an appropriate explanatory model of demand. In the case of criminal use, however, firearms demand follows a different choice procedure. In this case, the alternatives that preferences must order, viability must finance and prices will determine are different from the simple decision of whether or not to buy a gun for its eventual use or for the feeling of safety that it might convey. In the case of criminal demand for use, the decision process and the application of rational analysis does not appear to be so challenging, as in this case there is a much smaller distance between the demand for possession and the demand for use. Criminal behaviour, in fact, requires the use of violence, and in this case, small arms can be closely interpreted like a capital investment in the production of criminal control. Furthermore, the substitutes for firearms for criminal purposes are rather different than the substitutes for firearms for “legitimate” or legal ownership. In order to assess legal demand for firearms, we examine acquisition statistics from the Office for Firearm Control and Trade of the Ministry of Defence (OCCA) since 1994 and until 2005 (August). Data on illegal demand, however, is considerably difficult to obtain as it cannot be directly measured. In order to assess illegal demand, we analyze Police data on firearms confiscation, and legality of firearms involved in criminal events, and the types of crime which involve them. General firearms demand may be gauged through assessing demand for homicidal use of the weapon. Since more than 90% of the total deaths by firearms in Bogotá are homicides, demand for homicidal use of a firearm is a good proxy for criminal use of firearms and thus for the robustness of the illegal market. For this purpose, we make use of data from the National Institute of Legal Medicine and Forensic Sciences (IMLCF) on homicides in Bogotá, and from the National Department of Statistics (DANE) and Police (CIC) (Chart 2). This is based on the strong assumption that most homicide weapons are illegal. Still, as we do not have complete time series for the type of weapons used in homicides according to their legality, we use this as the best proxy available. 1 The acquisition of an illegal firearm is in itself a crime punished by law, hence, there are no illegal arms for non-criminal use.
  • 8. Documentos de trabajo cerac – número 14 – diciembre 2009 6 Chart 1. Small arms demand: the legal and illegal market, and criminal and non-criminal demand. Source: CERAC Chart 2. Datasets used to assess the Small Arms Demand in Bogotá Firearms Demand Criminal (Source: Medicina Legal, Police) Non criminal Illegal (Source: Police) Legal (Source: Police) Legal (Source: OCCA) Carrying Holding Illegal Non Criminal Source: Medicina Legal and Police Criminal Source: DCCA Legal Source: CERAC
  • 9. Documentos de trabajo cerac – número 14 – diciembre 2009 7 2.3 Firearms and Prices2 As mentioned above, we distinguish between two main markets for small arms: legal and illegal. Price formation in either of these markets depends on the specific features of each one. In this section, we briefly describe the prices that characterize each of these markets. Moreover, in Colombia, “legal costs” play an important role in the demand for firearms. These are the costs incurred in order to legally hold a registered firearm, or, inversely, the cost that agents may be subject to pay if captured with an unregistered firearm. The costs of obtaining a firearm in the legal market vary depending on the type of weapon and the type of permit sought. To start, there is a monetary cost for the weapon acquired and the legal restrictions associated with certain firearms. For example, Colombian firearms regulations (see Box 1) stipulate that civilians may not receive authorization for pistols and revolvers with a calibre greater than 0.38 inches (Ministerio de Defensa, nd)3. Hence for assault rifles and all other automatic weapons, the calibre is not relevant to the present analysis as these types of weapons are outside the legal reach of civilians. Table 1 shows the prices in 2006 which the military industry sells to civilians and to companies. According to Indumil the price of a “legal firearm” (handguns, carbines and shotguns) ranges between (USD) $143 and $65,0004, while the price to obtain a permit is $51.74 (Table 2). The relevant price to consider in terms of the SAS demand model, and for inter-country comparative purposes, is the one for weapons for which the access to civilians is permitted: the price ranges from $136 to $1,447 as shown in Table 1. Notice that a civilian earning the minimum wage will need to devote more than one months of work income in order to be able to afford a revolver and its permit. In addition, the procedure for obtaining a holding or carrying permit may take considerable time and is subject to certain prerequisites. The individual must pass a medical test, a battery of psychological tests, and a training course in order to obtain the permit. There is some circumstantial evidence that on the illegal market, weapon prices are lower, however additional risks are usually entailed. Although enforcement is not tight, under the current regulation, the penalty for criminal use of a firearm 2 For a more detailed exposition, see the Small Arms Survey Colombia study (Aguirre et. Al, 2006). 3 All of them are reserved to the Colombian Military Forces. 4 To put this in context, Colombian per capita GDP was USD$3,019 in 2005. may include a prison term of up to 15 years5. In some cases, this includes possessing the firearm without a license (a cost that the person acquiring it legally must consider). The illegal market offers buyers the possibility of obtaining forbidden firearms (unavailable through the legal market) at low cost. While a machine gun such as the M-60 (cal. 7.62) costs some $19,757 legally, the price is around $10,000 on the illegal market. Pistols and revolvers can be found since US$260. A new strategy of criminal users to avoid prosecution and enforcement of gun restrictions is the renting of firearms: there are several media reports sourced on the police that point to the existence of places where criminal organisations rent (and thus control property and use) of pistols for US$86 a day (El Tiempo, 2006a). In certain cases, the price of a weapon may be as little as 10% of the legal price6. Finally, the prices of substitute and complementary goods vary. In the legal market, the price of a cartridge oscillates between $0.10 (for a Seller & Bellot 22L) and $5.00 (for a cartridge calibre 0.5), while the price of a grenade (IM-26) is around $30 (Indumil, 2006). Explosives have a special peculiarity in that firms can buy them legally for industrial use, after review and permit approval from the military industry and the military regulatory offices.7 Knifes and machetes, which appear frequently as weapons both in criminal and conflict actions, are cheap and widely available. 5 The penal code established that human rights violations with firearms shall be punished with a prison sentence of up to 15 years. Production, distribution, and use can be punished with prison sentences ranging from 1 to 4 years. Prison sentences for carrying a weapon without a permit range from 3 to 10 years, and for using it in a homicide, from 2 to 6 years. 6 In Colombia, the price of an Ingram machine gun made in illegal workshops (popular arms workshops) is around USD$140, while the price of an original Ingram is around USD$1,400 (Graduate Institute of International Studies, 2004; 24). According to SEMANA Magazine (Edition N° 887) the price difference between Indumil and Black market prices is 56%, being the Indumil guns much higher than even the quoted black market. (OXFAM, 2003) 7 The relation between firearms and explosives is complex -- they may act as complementary or supplementary goods depending on the situation. In a terrorist attack, for example, the ratio of firearms to explosives used is different than in other types of attacks.
  • 10. Documentos de trabajo cerac – número 14 – diciembre 2009 8 Table 1. Firearms Prices by Type, 2006 Table 2. Prices of gun permits, 2006 2.4 Resources Colombia is a middle-income economy where most members of the population can afford to purchase a weapon if they so choose. This is evidenced by the sizeable number of weapons in the hands of civilians (currently more than 700.000 according to the information provided by the OCCA) despite the relatively large costs involved. Thus, while legal weapons are not cheap and the paperwork required for their acquisition is cumbersome (see Table 1), people have nonetheless endeavoured to legally obtain hundreds of thousands of firearms. Unfortunately, the available data did not allow us to see how demand has evolved over time making it impossible to see if there is some income or price effect on demand for weapons. Nor is there any means of correlating the level of income or wealth of people with the number of arms legally obtained. As mentioned above, resources do not constitute an impediment for firearms demand for criminal or conflict use in the case of Colombia. There have been several documented cases of massive illegal arms deals in which criminal organisations, guerrilla and paramilitary groups have been involved. The main barriers to firearm acquisition are the complex logistics involved in illegal deals and enforcement. Category of Firearm Firearm Make COL$ USD$ Relative Price to Revólver Relative to price to daily minimum wage (USD$ 5,9)* Handguns Pistol Llama Cal. 22 315,000 136.96 0.29 23.21 Pistol Jericho 9T Mod Cal 9mm 2,667,000 1,159.57 2.48 196.54 Revolver Llama Cal .38mm 1,205,000 523.91 1.12 88.80 Revolver Llama Scorpio Cal 32 1,075,000 467.39 1.00 79.22 Carabines and Shotguns Remington Cal .22 Mod 572 1,943,000 844.78 1.81 143.18 Sig/Sauer Carabine Cal 308 I5T 3,329,000 1,447.39 3.10 245.32 Remington Cal .12 Mod 87 266,700 115.96 0.25 19.65 Mossberg Cal .12 2,100,000 913.04 1.95 154.75 Source: Industria Militar. Processed: CERAC * The montlhy minumun wage to 2006 is USD$178 Type of Permit COL$ USD$ Holding or Carrying Permit 119,000 51.74 Permit Renewal or copy 30,000 13.04 Permit for Second Firearm 30,000 13.04 Permit Renewal following suspension 593,000 257.83 Explosives and ammunition Permit 890,000 386.96 Social Tax 40,800 17.74 Source: Industria Militar
  • 11. Documentos de trabajo cerac – número 14 – diciembre 2009 9 Box 1. Firearms Regulation in Colombia Despite having a dismal human security record directly linked to firearms, the regulatory framework for firearms in Colombia is well-designed and rather restrictive. This owes in part to the rise in criminal use of firearms during the eighties and early nineties, which sparked the development and implementation of a whole new regime of firearm control. Arms control legislation has a long history in Colombia. Regulation was implemented as early as 1947. Much later, in 1991, the new political Constitution created the institutional space to design, issue and implement a new regulatory framework. The new Constitution brought an avalanche of new regulations in all realms of the policy agenda, which overwhelmed the lobbying capabilities of interest groups and allowed the implementation of ambitious reformist initiatives. Among these, National Government Decree Number 2535 of 1993 regulated the production and trade of arms, munitions and explosives, as well as carrying and holding permits for a small group of firearms. The main pillar of the current regulatory framework is state ownership of all firearms and limited civilian access, in order to effectively ration and control demand for possession. Only the State is authorized to produce, import, and sell firearms. Decree 2535 established arms carrying to be a license given by the State rather than a right. It identified three types of firearms: those limited to use by the armed forces (uso privativo), restricted-use guns (uso restringido) and civilian guns (self-defense, sports or collection). The Ministry of Defense went even further, asserting that “the license of holding or carrying a firearm can be given, suspended or removed whenever the competent authority deems necessary” (Pardo, 1995). Consequently, civilians and firms may request the issuance of a permit, but must also demonstrate the need for the license. The Ministry of Defense Office for Control and Trade of Arms (OCCA) grants licenses subject to the justification provided in the request. Previous firearms legislation was similar in that the state provided a safe-conduct for the possession and carrying; however, the system of registry and tracking was very poor. Decree 2535 improved the control of civilian possession and control of arms, and encouraged civilian registration through a special amnesty whereby people were unconditionally granted a temporary holding permit regardless of their current legal status. The Ministry of Defense reports that around 190,000 holding permits were issued (see Table 3). The amnesty allowed people to relinquish their firearms to the State and even receive a monetary compensation for doing so. All safe-conducts issued before 1994 had to be changed to the updated holding and carrying licenses (Bulla, 1995). Decree 2535 stipulates that a holding permit authorizes its owner to hold a weapon in a declared building that may be his or her residence, place of work, or any other place of possible danger. Only two holding licenses can be authorized for a civilian, and their validity expires after ten years. The permit for carrying a firearm has some distinct characteristics. For example, the individual must justify his or her particular security reasons for carrying a gun, and no more than two carrying permits are authorized per person. A restricted-use gun license can be given if the individual justifies a risk of death. Article 4 specifically states that, although the state is the sole owner of the firearm, the licensee is fully responsible for its use. The regulatory framework also enables the political-administrative authorities, under an agreement with the military and police authorities, to temporarily restrict or even ban the carrying of firearms in order to control urban crime (Bulla, 1995; Pardo, 1995). This has been one of the main forms of arms control in the city of Bogotá. The Colombian Congress, with the support of the National Government in 2006 passed legislation that, although it has some provisions that strengthen the control and modernizes the Department of Arms Control and Trade, will lead to a greater supply of guns on the streets. The law also increases the permissiveness in behavior and goes against local security initiatives, popular and even led to greater state control and regulation of firearms (Comunidad Segura, 2009).
  • 12. Documentos de trabajo cerac – número 14 – diciembre 2009 10 3. FIREARMS DEMAND IN BOGOTÁ The assessment of small arms demand in Bogotá is somewhat imperfect in that we cannot take into account certain factors which affect individuals’ preferences for the demand for the use of small arms, such as psychological behaviour. As shown in section 2, we assess firearms demand by separately taking into consideration two markets: legal (Section 3.1) and illegal (Section 3.2). We assess legal demand using official information from the Ministry of Defence Office for Control and Trade of Arms (OCCA) on the sale of arms in Colombia and Bogotá for the period before and after 1994. Criminal demand is calculated indirectly through analysis of vital statistics data from DANE and National Police Centre for Criminological Research (CIC), which contains information on the legal status of weapons used in common crimes. To improve our understanding of the criminal market, we incorporate data on firearms use (IMLCF) which helps to clarify the demand for use in homicides of firearms in Bogotá and highlights patterns in the criminal use of such weapons since we consider that all illegal firearms are used in criminal activities. 3.1 Legal Demand In this section, we investigate patterns of firearms permit acquisition in Bogotá relative to Colombia as a whole. Permit acquisition is indicative of the preferences of those agents that choose to purchase weapons directly from the State. Data from OCCA allows us to identify who is seeking arms, the type of permit they are seeking, and the type of firearm they wish to acquire. The dataset contains information on 38 arms selling depots, of which 35 are different from those of Bogotá and are distributed around the country. The degree of demand for legal firearms in Bogotá will be assessed using data on the types of arms sought, the people seeking them, and the type of permit issued for each weapon. In each of these cases, we will examine any similarities in the contribution of demand in Bogotá to the national total. The comparison becomes even more interesting when we review differences in the acquisition of different firearm brands in relation to the permit acquired in Bogotá and in Colombia. Unfortunately, the dataset does not include information regarding the date on which the permit was requested. The only temporal information has to do with the information about weapons already in the hands of civilians before and after 1994 and is only available at the national level.8 The OCCAE had issued a total of 706,210 firearm permits to civilians by mid-2005. This figure includes the 235,696 registered firearms issued in the 1994 firearm amnesty, when the new regulation entered into force. The 2005 figure indicates a ratio of 1.53 legal arms per 100 civilians. But while the number of legally registered firearms is lower than those of its neighbours, it appears that Colombian civilians are arming themselves in greater numbers (Aguirre, et. Al, 2006; p. 5) The rate of legal firearms per 100 inhabitants in Bogotá is 2.61, one point over the rate of Colombia. This could be related with the big proportion of firearms bought by the security companies and the people that do not lived in the city but buy in the capital. At the national level, both before and after 1994, the firearm with the highest license participation was the revolver (55% before 1994 and 62% after), however pistols gained in popularity after 1994, increasing from 14% to 19% to become the second most prevalent firearm (Table 3). Shotguns were displaced from second place by pistols. This could be due to the fact that the amnesty might have been more effective in urban than rural areas, leading to a higher number of pistols to be registered for the first time and less shotguns legalised (Shotguns are less ‘movable’ weapons and are usually stored in the houses and hamlets of rural areas, and are thus less prone to be checked by authorities). 8 The fact that this is the cut-off year is explained for the new regulation of firearms holdings that took place in that year and included an amnesty.
  • 13. Documentos de trabajo cerac – número 14 – diciembre 2009 11 Table 3. Arms acquisition by type before and after 1994 As Table 4 shows, more than 80% of the total permits given in the period of amnesty were holding permits, pointing to the fact that the amnesty allowed a proper regulation of demand for private protection of property (the arm needs to be stored at the property) rather than demand for private protection of the person (which requires carrying it in particular at urban centres). Table 4. Permits issued before amnesty Regarding the legal demand for firearms in Bogotá, Table 3 shows arms acquisition behaviour since the 1994 amnesty through the beginning of 2005. Demand patterns by type of firearm are very similar between Bogotá and the rest of the nation. Around 60% of the demand is for revolvers while 15-20% is for pistols and shotguns. While the shotgun is the second firearm demanded in the whole country, in Bogotá is the pistol, with an important participation of 20 per cent. One quarter of the legal Colombian demand for firearms originates in Bogotá. This proportion varies little among different types of weapons, such as revolvers, shotguns, pistols and carbines, except for machine guns, submachine guns, and assault rifles, where the proportion of this guns is higher in Bogotá (see Table 4), although most of these permits are given for carrying which allow for the arm to be moved along the whole of the Colombian territory. Table 3. Type of firearms demanded, Colombia and Bogotá Table 4. Distribution of firearms registered in Bogotá in the total since 1994 Category of Firearm Quantity Before 1994 Participation (%) Before 1994 Quantity 1994-2005 Participation (%) 1994-2005 Monthy Average 1994-2005 Total Licensed Revolver 130,736 55.5% 293,674 62.4% 2,144 424,410 Shotgun 54,578 23.2% 68,454 14.5% 500 123,032 Pistol 32,168 13.6% 90,482 19.2% 660 122,650 Carabine 11,298 4.8% 9,755 2.1% 71 21,053 Undetermined 2,902 1.2% 419 0.1% 3 3,321 Assault rifle 2,531 1.1% 3,315 0.7% 24 5,846 Submachine Gun 1,452 0.6% 4,379 0.9% 32 5,831 Machine Gun 31 0.0% 36 0.0% 0 67 Total 235,696 100.0% 470,514 100.0% 3,434 706,210 Source: OCCA Processed by CERAC Type of permit Existent firearms before 1994 % Carrying 45,719 19% Holding 189,977 81% Total 235,696 Source: OCCA Processed: CERAC Colombia Type of firearm Quantity Participation (total) Revolver 424,410 60.1% Shotgun 123,032 17.4% Pistol 122,650 17.4% Carbine 21,053 3.0% Assault rifle 5,846 0.8% Submachine gun 5,831 0.8% Undetermined 3,321 0.5% Machine Gun 67 0.0% Total 706,210 100.0% Bogotá Type of firearm Quantity Participation (total) Revolver 106,538 58.2% Pistol 37,909 20.7% Shotgun 26,857 14.7% Carbine 4,718 2.6% Submachine gun 3,575 2.0% Assault rifle 3,218 1.8% Undetermined 308 0.2% Machine Gun 34 0.0% Total 183,157 100.0% Source: OCCA Processed by CERAC Type of firearm Colombia Bogotá Participation Submachine gun 5,831 3,575 61.3% Rifle 5,846 3,218 55.0% Machine Gun 67 34 50.7% Pistol 122,650 37,909 30.9% Revolver 424,410 106,538 25.1% Carbine 21,053 4,718 22.4% Shotgun 123,032 26,857 21.8% Undetermined 3,321 308 9.3% Total 706,210 183,157 25.9% Source: OCCA Processed: CERAC
  • 14. Documentos de trabajo cerac – número 14 – diciembre 2009 12 In terms of the acquirers and types of permits registered, however, we observe a more divergent pattern between Bogotá and Colombia as a whole (Table 5). While in the capital city roughly 65% of the permits are for carrying a firearm, in Colombia as a whole the figure is 57%. This suggests that in Bogotá, people and firms demand an arm overwhelmingly to carry it, while in the rest of the country (including the countryside) guns are sought to be “stored” at home or on the farm. This phenomenon can be related with the security of politicians, diplomatic, merchants and people with a high profile, who are concentrated in the capital. Furthermore, this pattern prevails across all consumer profiles and types of arms. For example, ordinary citizens in Bogotá have a carrying permit for 75% of firearms, while the national figure is 61%. Firms in Bogotá hold carrying permits for 45% of their weapons, while this figure is 39% for the country as a whole. This is consistent with the experience revealed to us by the National Police: there are proportionally very few households that hold guns in the city, which have lead to very few cases in which, for example, an armed robbery of a household leads to a two-way shooting or indeed the stealing of guns. Taking into account that the latest estimated number of households in the city is 1’934,828 according to the Quality of Life Survey (2003), we estimate that there is approximately a stock of 10 legal guns per 100 households in Bogotá, of which only 3 are licensed to be kept at a fixed site. In total, more than 470,000 permits were issued in Colombia after the amnesty enacted by the arms legislation of 1994. This is an average of 39,210 permits issued every year. Table 5. Demand for firearms by holder and type of permit, Colombia and Bogotá. On the other hand, it seems to be a high degree of demand for arms for protection “on the move” which is consistent with a response to a pattern of criminality in which kidnappings and armed attacks against vulnerable targets are frequent. Table 6 shows that more than a half of the total number of carrying permits for firms and foreigners are issued in Bogotá. This is likely due to a higher prevalence of firms that demand firearms (e.g., in order to protect property rights) as well as a larger presence of foreigners (including multinational executives in sectors at a higher risk of kidnapping) that require security. The pattern is also seen in citizens, but with a lower effect. Table 6. Distribution of type of permit holders of Bogotá in Colombia. The demand for all types of firearms in Bogotá by type of acquirer (Table 9) confirms this. Consumers in Bogotá, particularly ordinary citizens, show a stronger preference for revolvers over pistols and shotguns than the rest of the country. Foreigners in Bogotá, on the other hand, show patterns of demand which are consistently different than in the rest of the country, seeking more sophisticated guns, like pistols. Also, it is worth mentioning that outside Bogotá firms show a stronger preference for shotguns, while pistols are more preferred in Bogotá than in the rest of the country. This might be a result of the different nature of the responsibilities which private security companies in Bogotá have in comparison with those operating in rural areas of the country. Unfortunately, we are not able to differentiate demand for the type of organisation –like some state agencies that are subject of the requirement of registration (the DAS or Departamento Administrativo de Seguridad, for example) or even the demand for guns by specific sectors of the population (by age group or occupation, like members of the armed forces). The strong presence in Bogotá of these agencies or companies that have national reach and coverage, means that some of these guns, even if “based” in the city, can and do travel all over the country. Colombia Type of ID Carrying % Holding % Total Colombian citizen 348.885 61,1% 222.476 38,9% 571.361 Firms 51.861 38,7% 82.062 61,3% 133.923 Foreigner 365 39,4% 561 60,6% 926 Firearm Total 401.111 56,8% 305.099 43,2% 706.210 Bogotá Colombian citizen 90.582 75,0% 30.134 25,0% 120.716 Firms 27.870 44,9% 34.139 55,1% 62.009 Foreigner 186 43,1% 246 56,9% 432 Firearm total 118.638 64,8% 64.519 35,2% 183.157 Source: OCCA Processed by CERAC Type of ID Carrying Holding Colombian citizen 25.96% 13.54% Firms 53.74% 41.60% Foreigner 50.96% 43.85% Firearm Total 29.58% 21.15% Source: OCCA Processed by CERAC
  • 15. Documentos de trabajo cerac – número 14 – diciembre 2009 13 Table 7. Firearms demand, type and holder. Colombia and Bogotá Table 8 compares the acquisition patterns of the ten most popular weapons in the country. With the exception of the Indumil and Remington brands, more than half of firearm permits issued in Bogotá are for carrying. Llama9 (made by Indumil) is the most acquired firearm brand in the country, and 26% of those acquired are registered in Bogotá (see Table 9). Some 73% of the Llama firearms bought in the country are registered with a carrying permit, while in Bogotá this rate falls to 66%. The opposite pattern occurs with Smith & Wesson firearms where in Bogotá, 72% of these are registered with carrying permits while only 55% are in Colombia. Roughly one quarter of Smith & Wesson permits were issued in Bogotá, representing 31% of firearm sales in the city (Table 10). 9 A weapon of either Spanish or Colombian origin, as Indumil has recently starting producing it. Colombia Type of firearm Colombian citizen % of total weapons Foreigner % of total weapons Firm % of total weapons Total % of total weapons Revolver 346,787 60.7% 326 35.2% 77,297 57.7% 424,410 60.1% Shotgun 86,130 15.1% 212 22.9% 36,690 27.4% 123,032 17.4% Pistol 111,390 19.5% 281 30.3% 10,979 8.2% 122,650 17.4% Carbine 20,030 3.5% 89 9.6% 934 0.7% 21,053 3.0% Assault rifle 1,709 0.3% 11 1.2% 4,126 3.1% 5,846 0.8% Submachine gun 2,244 0.4% 6 0.6% 3,581 2.7% 5,831 0.8% Undetermined 3,004 0.5% 1 0.1% 316 0.2% 3,321 0.5% Machine gun 67 0.0% 0.0% 0.0% 67 0.0% Total 571,361 926 133,923 706,210 Bogotá Type of firearm Colombian citizen % of total weapons Foreigner % of total weapons Firm % of total weapons Total % of total weapons Revolver 69,201 57.3% 119 27.5% 37,218 60.0% 106,538 58.2% Pistol 30,540 25.3% 155 35.9% 7,214 11.6% 37,909 20.7% Shotgun 14,378 11.9% 82 19.0% 12,397 20.0% 26,857 14.7% Carbine 4,414 3.7% 63 14.6% 241 0.4% 4,718 2.6% Submachine gun 1,143 0.9% 4 0.9% 2,428 3.9% 3,575 2.0% Assault rifle 727 0.6% 9 2.1% 2,482 4.0% 3,218 1.8% Undetermined 279 0.2% 0.0% 29 0.0% 308 0.2% Machine gun 34 0.0% 0.0% 0.0% 34 0.0% Total 120,716 432 62,009 183,157 Source: OCCA Processed by CERAC
  • 16. Documentos de trabajo cerac – número 14 – diciembre 2009 14 Table 8. Most acquired firearms brands and type of permit, Colombia and Bogotá Table 9. Contribution of Bogotá’s firearms to the national total, by type, since 2004. Colombia Firearm Carrying % Total Holding % Total Total Overall participation Llama 142,626 73.2% 52,106 26.8% 194,732 34.0% Smith & Wesson 99,946 55.0% 81,912 45.0% 181,858 31.7% Indumil 4,353 11.7% 32,800 88.3% 37,153 6.5% Colt 12,898 52.0% 11,910 48.0% 24,808 4.3% Beretta 16,282 69.2% 7,231 30.8% 23,513 4.1% Carl Walter 16,473 75.8% 5,249 24.2% 21,722 3.8% Ceska Zbrojovka A.S. 16,830 96.6% 592 3.4% 17,422 3.0% Browning 13,304 55.4% 10,698 44.6% 24,002 4.2% Remington 7,285 28.2% 18,535 71.8% 25,820 4.5% Ruger 16,103 71.9% 6,285 28.1% 22,388 3.9% Total 346,100 60.4% 227,318 39.6% 573,418 100.0% Bogotá Firearm Carrying % Total Holding % Total Total Overall participation Llama 33,629 66.2% 17,147 33.8% 50,776 34.2% Smith & Wesson 32,780 71.6% 12,978 28.4% 45,755 30.8% Indumil 452 5.3% 8,047 94.7% 8,499 5.7% Colt 4,902 66.1% 2,515 33.9% 7,417 5.0% Beretta 5,768 80.6% 1,386 19.4% 7,154 4.8% Carl Walter 5,944 88.9% 742 11.1% 6,686 4.5% Ceska Zbrojovka A.S. 6,234 98.3% 111 1.7% 6,345 4.3% Browning 4,340 70.2% 1,843 29.8% 6,183 4.2% Remington 1,832 34.8% 3,428 65.2% 5,260 3.5% Ruger 3,673 83.9% 705 16.1% 4,378 2.9% Total 99,554 67.1% 48,902 32.9% 148,453 100.0% Source: OCCA Processed by CERAC Participation Ceska Zbrojovka A.S. 36.4% Carl Walter 30.8% Beretta 30.4% Colt 29.9% Llama 26.1% Browning 25.8% Smith & Wesson 25.2% Indumil 22.9% Remington 20.4% Ruger 19.6% Total 25.9% Source: OCCA Processed by CERAC
  • 17. Documentos de trabajo cerac – número 14 – diciembre 2009 15 Table 10. Firearms acquisition by brand and type of weapon. In short, the legal demand for firearms in Bogotá follows the preferences implied by the need of a high level of protection and the presence of high risk targets. Pistols appear as gaining share in the demand, both for carrying and holding permits, although we do not have access to time series data to confirm this intuition. Comparing with the country as a whole, we do see clearly that pistols are being favoured for carrying rather than for holding. Legal demand in Bogotá also favours short guns over long. There is no substantial difference in the type of weapon bought by brand, although this can be only a reflection of the restricted availability by brand, due to the state monopoly on commercialisation. 3.2 Illegal Demand and compliance with firearms regulations While illegal demand for arms in Colombia and compliance of the arms regulation regime is more difficult to measure, we attempt to do so by analyzing criminal statistics and data from the National Police on arms confiscations. This assumes that confiscated arms are a good proxy of the near current demand for firearms, and that their confiscation signals violation of the criminal code. In the case of confiscations it is important to note that confiscation is not necessarily linked with criminal violence or other crimes, but potentially with offences against the regulation of firearms itself or minor misdemeanours. In this way, these figures allow us to gauge the level of compliance with firearms regulations, not only in terms of the number of arms involved in certain crimes, but also the demand for guns for criminal purposes. Furthermore, a confiscated gun may not necessarily be taken out of civil hands permanently; after a judicial procedure, the gun in question might be returned to the licensee if the reason for confiscation was a minor violation of regulation. There are no statistics available of how many of these were returned to the licensees. Arms confiscations have been increasing both in Colombia and Bogotá since the 1990’s; with a noticeable acceleration since 1983 (see Graph 1). In 2004, over 20,000 arms were confiscated in Bogotá, constituting roughly one-third of the total confiscated in Colombia last year (some 63,000 in all). Although we do not have information from other law enforcement agencies (e.g. the military forces, the DAS or the CTI), The National Police has never confiscated as many arms as it did in the year 2005, both in Colombia as well as in its capital. The figure was over 90 thousand for the whole country and 23,571. For the first semester of 2006, the National Police confiscated an even larger number of guns: in Colombia near 40 thousand firearms have been confiscated, while 12 thousand were seized only in the capital. Table 11 shows firearms confiscated by type of firearm in Bogotá between 1964 and the first semester of 2006, for the years for which information is available, by type of firearm. This one shows how the confiscation has been growing over the years, with the biggest proportion made of self-defence guns. Table 12 presents firearms confiscated in Bogotá as a proportion of the total confiscated in Colombia, and Table 13 shows the total confiscated in Colombia between 1964 and 2004, Graph 1 shows the time series of these three variables. Colombia Firearm brand Machine Gun % Carbine % Shotgun % Rifle % Undeter mined % Pistol % Revolver % Submac hine gun % Total Beretta 0,0% 28 0,1% 4.810 20,5% 2 0,0% 112 0,5% 18.408 78,3% 64 0,3% 89 0,4% 23.513 Browning 21 0,1% 1.661 6,9% 4.146 17,3% 14 0,1% 181 0,8% 17.789 74,1% 187 0,8% 3 0,0% 24.002 Colt 0,0% 118 0,5% 46 0,2% 322 1,3% 118 0,5% 4.412 17,8% 19.117 77,1% 675 2,7% 24.808 Ceska Zbrojovka A.S. 0,0% 15 0,1% 10 0,1% 0,0% 11 0,1% 17.113 98,2% 3 0,0% 270 1,5% 17.422 Indumil 0,0% 175 0,5% 36.544 98,4% 34 0,1% 53 0,1% 17 0,0% 329 0,9% 1 0,0% 37.153 Llama 0,0% 17 0,0% 71 0,0% 6 0,0% 101 0,1% 2.369 1,2% 192.167 98,7% 1 0,0% 194.732 Remington 0,0% 6.703 26,0% 17.978 69,6% 67 0,3% 172 0,7% 139 0,5% 761 2,9% 0,0% 25.820 Ruger 0,0% 498 2,2% 262 1,2% 95 0,4% 73 0,3% 457 2,0% 21.002 93,8% 1 0,0% 22.388 Smith & Wesson 2 0,0% 57 0,0% 744 0,4% 12 0,0% 404 0,2% 3.845 2,1% 176.787 97,2% 7 0,0% 181.858 Carl Walter 1 0,0% 477 2,2% 50 0,2% 1 0,0% 85 0,4% 21.012 96,7% 87 0,4% 9 0,0% 21.722 Bogotá Firearm brand Machine Gun % Carbine % Shotgun % Rifle % Undeter mined % Pistol % Revolver % Submac hine gun % Total Beretta 0,0% 5 0,1% 1.049 14,7% 0,0% 4 0,1% 6.080 85,0% 2 0,0% 14 0,2% 7.154 Browning 17 0,3% 358 5,8% 924 14,9% 5 0,1% 8 0,1% 4.867 78,7% 3 0,0% 1 0,0% 6.183 Colt 0,0% 31 0,4% 0,0% 189 2,5% 10 0,1% 1.169 15,8% 5.467 73,7% 551 7,4% 7.417 Ceska Zbrojovka A.S. 0,0% 13 0,2% 2 0,0% 0,0% 0,0% 6.174 97,3% 0,0% 156 2,5% 6.345 Indumil 0,0% 26 0,3% 8.440 99,3% 12 0,1% 1 0,0% 3 0,0% 17 0,2% 0,0% 8.499 Llama 0,0% 1 0,0% 1 0,0% 1 0,0% 2 0,0% 502 1,0% 50.269 99,0% 0,0% 50.776 Remington 0,0% 1.409 26,8% 3.742 71,1% 34 0,6% 12 0,2% 33 0,6% 30 0,6% 0,0% 5.260 Ruger 0,0% 125 2,9% 23 0,5% 42 1,0% 6 0,1% 109 2,5% 4.073 93,0% 0,0% 4.378 Smith & Wesson 1 0,0% 3 0,0% 132 0,3% 6 0,0% 14 0,0% 1.282 2,8% 44.314 96,9% 3 0,0% 45.755 Carl Walter 0,0% 75 1,1% 4 0,1% 0,0% 3 0,0% 6.595 98,6% 3 0,0% 6 0,1% 6.686 Source: OCCA Processed: CERAC
  • 18. Documentos de trabajo cerac – número 14 – diciembre 2009 16 Graph 1. Confiscated arms in Bogotá and Colombia, and contribution of Bogotá to the national total, 1964-2005 Table 11. Firearms confiscated in Bogotá, 1964- June 2006 0 10000 20000 30000 40000 50000 60000 70000 80000 90000 100000 196419651966196719681969197019711972197319741975197619771978197919801981198219831984198519861987198819891990199119921993199419951996199719981999200020012002200320042005 0% 10% 20% 30% 40% 50% 60% Confiscated Arms - Bogotá Confiscated Arms - Colombia Confiscated Arms Bogotá / Colombia Source: Policía Nacional Processed by CERAC Year Revolver Pistol Shotgun Carbine Machine and sub machine gun Rifle Other Total 1964 1094 164 8 4 0 0 4 1274 1970 994 188 8 2 0 0 4 1196 1971 917 221 13 0 0 0 4 1155 1972 821 186 29 3 1 0 0 1040 1973 1144 285 20 4 0 1 1 1455 1974 1020 280 13 2 0 0 0 1315 1975 766 222 14 3 0 3 0 1008 1976 840 247 11 2 1 0 0 1101 1977 570 169 13 0 0 0 0 752 1978 251 78 17 0 0 0 71 417 1980 345 56 12 2 3 0 0 418 1981 395 80 30 7 0 0 0 512 1982 601 230 72 1 1 1 0 906 1983 4940 1203 16 0 1 0 0 6160 1984 923 157 26 2 27 1 0 1136 1987 985 257 174 1 7 3 0 1427 1992 1986 479 275 0 6 2 0 2748 1993 2860 713 416 3 26 4 0 4022 1998 5088 1857 1022 5 33 7 0 8012 1999 4952 1890 1011 6 33 1 0 7893 2003 9337 4963 1243 8 57 24 12 15644 2004 11902 7143 968 5 75 16 1 20110 2005 14210 8532 715 6 99 7 2 23571 2006 7629 4860 368 9 32 2 1 12901 ** Data not available for 1965-1969, 1979, 1985-1986, 1988-1991, 1994-1997, 2000-2002 * Until June de 2006 Source: Policía Nacional. Processed by CERAC Type of firearm
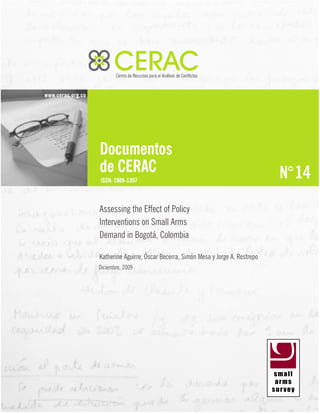
  • 19. Documentos de trabajo cerac – número 14 – diciembre 2009 17 Table 12. Firearms confiscated in Bogotá as a proportion of those confiscated in Colombia, 1964-2004 Confiscations in Bogotá have grown consistently since 1985, with a notable acceleration since 2000. Nationally, this acceleration is present since the new regime for arms control entered into force in 1993. By 2005 the number of arms confiscated reached a historical maximum after 12 years of constant growth. All throughout the period, confiscations in Bogotá have constituted an average of 22% of the total confiscated throughout Colombia. Interestingly, the acceleration of arms confiscation seems to be inversely related with the reduction of homicide rates in Bogotá and in the country (see Graph 2). The effort by the National Police to control firearms is evident in Bogotá in terms of firearm control is evident from the rising proportion of arms confiscated in the city with respect to confiscation nationwide, rising from a paltry 8% in 1978 to 33% in 2003, while there is no reason to suggest that the number of firearms in circulation in Bogotá has risen in such a large proportion during the same period. Revolvers and pistols constitute roughly 94% of confiscated arms in Bogotá, while in Colombia this proportion is closer to 86% (see Graph 3 and Graph 4), confirming the preference for short weapons in the city. In Bogotá and in Colombia, revolvers have been the most confiscated weapon; however, their prevalence has been falling in the last two decades as demand for pistols has increased (see Graph 5). Year Revolver Pistol Shotgun Carbine Machine and sub machine gun Assault rifle Other Total 1964 32% 28% 5% 6% 0% 0% 2% 29% 1970 29% 27% 5% 9% 0% 0% 4% 27% 1971 26% 28% 5% 0% 0% 0% 3% 24% 1972 26% 24% 7% 9% 50% 0% 0% 24% 1973 30% 29% 7% 12% 0% 10% 7% 29% 1974 26% 22% 4% 5% 0% 0% 0% 23% 1975 22% 19% 4% 7% 0% 10% 0% 19% 1976 21% 21% 3% 6% 33% 0% 0% 20% 1977 14% 13% 4% 0% 0% 0% 0% 13% 1978 8% 6% 3% 0% 0% 0% 36% 8% 1980 14% 7% 3% 3% 43% 0% 0% 11% 1981 13% 11% 6% 16% 0% 0% 0% 12% 1982 13% 16% 13% 4% 6% 5% 0% 14% 1983 58% 61% 3% 0% 2% 0% 0% 55% 1984 18% 5% 3% 1% 25% 1% 0% 12% 1987 16% 19% 14% 1% 1% 6% 0% 15% 1992 19% 20% 12% 0% 5% 2% 0% 18% 1993 20% 22% 13% 2% 18% 5% 0% 19% 1998 21% 25% 16% 4% 21% 6% 0% 21% 1999 20% 23% 14% 5% 19% 1% 0% 19% 2003 33% 42% 19% 6% 34% 6% 2% 33% 2004 32% 43% 12% 5% 33% 3% 0% 32% ** Data not available for 1965-1969, 1979, 1985-1986, 1988-1991, 1994-1997, 2000-2002 Source: Policía Nacional. Processed by CERAC Type of Firearm
  • 20. Documentos de trabajo cerac – número 14 – diciembre 2009 18 Table 13: Firearms confiscated in Colombia, 1962-2004 Graph 2. Confiscated firearms and deaths by firearm in Bogotá Año Revolver Pistol Shotgun Carbine Machine and sub machine gun Assault rifle Total 1962 2223 448 390 68 0 53 3182 1963 2449 450 362 74 0 30 3365 1964 3389 580 344 67 0 34 4414 1965 10582 2059 1140 256 0 156 14193 1966 3494 616 293 48 8 27 4486 1967 3150 648 427 58 11 28 4322 1968 3524 778 451 53 0 24 4830 1969 3439 720 332 20 0 14 4525 1970 3484 702 256 22 11 10 4485 1971 3536 795 362 38 8 10 4749 1972 3142 780 438 35 11 17 4423 1973 3777 980 277 34 15 10 5093 1974 3919 1285 331 41 10 11 5597 1975 3545 1158 389 41 36 30 5199 1976 3945 1204 397 36 19 11 5612 1977 4151 1301 331 66 34 19 5902 1978 3018 1232 538 31 202 4 5025 1979 2713 851 437 54 26 18 4099 1980 2533 747 452 61 7 22 3822 1981 2997 731 483 43 17 8 4279 1982 4599 1436 535 24 17 22 6633 1983 8647 1982 626 121 63 29 11288 1984 5150 3194 942 169 106 6 9628 1985 5124 1359 1608 86 121 127 8425 1986 5842 1174 849 91 64 59 8079 1987 6006 1343 1213 85 633 54 9334 1988 7094 1854 1518 79 109 65 10719 1989 9241 1601 1701 124 64 48 12779 1990 15058 1672 1481 144 133 118 18606 1991 7151 2292 1949 222 144 589 12347 1992 10363 2455 2295 103 130 128 15474 1993 14145 3224 3158 158 145 88 20918 1994 15560 3962 3677 224 144 95 23662 1995 17761 4359 4732 138 126 128 27244 1996 18121 4626 5475 134 130 118 28604 1997 19995 5515 5505 94 148 214 31471 1998 24012 7527 6359 135 156 127 38316 1999 24750 8052 7242 113 177 193 40527 2000 25789 8577 7431 100 170 288 42355 2001 26927 9589 7508 146 207 279 44656 2002 47353 2003 28293 11695 6920 124 418 387 47837 2004 37123 16441 8409 97 414 553 63037 Total 409761 121994 89563 3857 4234 4251 680894 Source: Policía Nacional Processed by CERAC Type of firearm 0 5000 10000 15000 20000 25000 1964 1966 1968 1970 1972 1974 1976 1978 1980 1982 1984 1986 1988 1990 1992 1994 1996 1998 2000 2002 2004 Confiscated firearms in Bogotá Deaths by firearm in Bogotá Source: National Police and DANE
  • 21. Documentos de trabajo cerac – número 14 – diciembre 2009 19 Graph 3: Distribution of confiscated arms in Bogotá by type, 1964-2005. Graph 4. Distribution of confiscated arms in Colombia, by type, 1964-2005. 73.5% 21.2% 4.8% 0.2% 0.3% 0.1% Revolver Pistol Shotgun Carbine Machine and sub machine gun Assault rifle Source: Policía Nacional Processed by CERAC 68.1% 18.1% 11.6% 0.9% 0.7% 0.6% Revolver Pistol Shotgun Carbine Machine and sub machine gun Assault rifle Source: Policía Nacional Processed by CERAC
  • 22. Documentos de trabajo cerac – número 14 – diciembre 2009 20 Graph 5. Evolution of the distribution of confiscated arms in Bogotá by type, 1964-2005 For the last two and a half years, the National Police’s Center for Criminological Studies has been registering with increasing detail all cases in which a gun is confiscated. This information was made available to us only for the city of Bogotá. By June 2006, the National Police has confiscated in Bogotá and Colombia more that the double the number of guns that were confiscated in 2005, which was in turn a record year until then. It is likely that this record will be broken again in 2006. Tables 16 and 17 show firearms confiscated in Colombia and Bogotá in the period 2003-June 2006 with respect to the type of permit held. Both in Colombia and Bogotá the biggest proportion of firearms confiscated are guns without permit and carrying permit. Given that it is unlikely that such an explosion of selling has occurred during the period, we venture to point to an increase in gun-control police activity that lead to this large increase. The quantity of firearms confiscated with carrying permits in Bogotá is much larger than in the whole country; while in Bogotá this proportion is 84.4% in Colombia is 56.4% (Table 18).Carrying permit holders, on the other hand, are prone to fall short of regulation leading to a large number of confiscations. The confiscation of a weapon may not be connected with criminal offences but may be associated with minor offences, including carrying of the weapon by someone different than the permit holder, carrying the weapon under the influence of alcohol, etc. 0% 10% 20% 30% 40% 50% 60% 70% 80% 90% 100% 1964 1970 1971 1972 1973 1974 1975 1976 1977 1978 1980 1981 1982 1983 1984 1987 1992 1993 1998 1999 2003 2004 2005* Revolver Pistol Shotgun Carbine Machine and sub machine gun Assault rifle Source: Policía Nacional Processed by CERAC
  • 23. Documentos de trabajo cerac – número 14 – diciembre 2009 21 Table 16. Confiscated arms in Colombia by type and permit status. 2003- June 2006 Table 17. Confiscated arms in Bogotá by type and permit status. 2003- June 2006 Table 18. Proportion of confiscated firearms by type and permit status with respect of the Total. Colombia and Bogotá, 2003- June 2006 Additionally, there are significant differences between types of firearm. Both in Colombia and Bogotá the biggest proportion of pistols, revolvers and submachine guns confiscated were granted carrying permits, a large part of confiscated shotguns did not, as is shown in Table 18. Thus, the granting of carrying permits involves a much higher probability of falling foul of the regulations than in those cases a holding permit is issued. It also shows that there is, at least in the city of Bogotá, a high degree of enforcement of the regulation for firearms: a 5% of guns issued with a carrying permit were confiscated in the city. The proportion of guns without permit that were confiscated has been falling; in 2003, arms without permit confiscated were 23%, 16% in 2004 and only 9% until August 2005. In general, long guns are held in Bogotá without any type of permit, while short weapons do have permits but are confiscated for a series of reasons. Still, the number of long weapons which are detected by the authorities are much lower than short weapons. Revolvers (both legal and illegal) are the most commonly confiscated firearms, representing approximately 64% of the total. They are followed by pistols Permit Type of firearm 2003 2004 2005 2006* Revolver 13,861 18,433 24,477 14,955 Pistol 7,504 11,082 14,270 9,474 Shotgun 455 497 586 488 Sub Machine Gun 58 89 120 54 Carbine 2 10 11 7 Rifle 3 13 8 2 Machine Gun 1 4 7 6 Others** 4 3 21,884 30,128 39,483 24,989 Revolver 121 229 376 369 Pistol 31 91 153 174 Shotgun 67 65 105 118 Sub Machine Gun 1 1 4 Carbine 1 2 1 Rifle 2 1 Others** 1 Machine Gun 1 220 388 637 669 Revolver 13,233 15,539 16,609 7,773 Shotgun 5,744 6,934 7,573 3,936 Pistol 4,056 4,674 4,868 2,253 Rifle 229 285 277 138 Carbine 119 81 116 49 Sub Machine Gun 92 103 67 49 Others** 59 84 80 48 Machine Gun 11 11 15 7 23,543 27,711 29,605 14,253 45,647 58,227 69,725 39,911 * Until June 2006 ** Includes grenade launcher, mortar, rocket and others Source: Policía Nacional Processed by CERAC Without permission Holding Carrying Total Total Total Total Permit Type of firearm 2003 2004 2005 2006* Revolver 6,772 8,875 12,322 6,710 Pistol 4,317 6,415 8,108 4,621 Shotgun 225 191 219 185 Sub Machine Gun 41 60 83 21 Rifle 2 9 4 Carbine 1 3 3 6 Machine Gun 1 2 3 5 11,359 15,555 20,742 11,548 Revolver 11 13 53 27 Pistol 5 7 20 13 Shotgun 14 1 13 12 30 21 86 52 Revolver 2,041 2,000 1,835 892 Shotgun 944 758 483 171 Pistol 480 459 404 226 Sub Machine Gun 11 12 11 6 Carbine 8 2 3 3 Rifle 8 2 3 2 Others** 8 3 2 1 Machine Gun 2 2 3,502 3,236 2,743 1,301 14,891 18,812 23,571 12,901 * Until June 2006 ** Includes grenade launcher, mortar, rocket and others Source: Policía Nacional Processed by CERAC Total Total Carriyng Holding Total Without permission Total Permit Type of firearm Colombia Bogotá Carbine 7.5% 44.8% Machine Gun 28.6% 73.3% Others** 2.5% 0.0% Pistol 72.2% 93.6% Revolver 56.9% 83.5% Rifle 2.7% 50.0% Shotgun 7.6% 25.5% Sub Machine Gun 50.3% 83.7% 54.6% 84.4% Carbine 1.0% 0.0% Machine Gun 1.6% 0.0% Others** 0.4% 0.0% Pistol 0.8% 0.4% Revolver 0.9% 0.1% Rifle 0.3% 0.0% Shotgun 1.3% 1.2% Sub Machine Gun 0.9% 0.0% 0.9% 0.3% Carbine 91.5% 55.2% Machine Gun 69.8% 26.7% Others** 97.1% 100.0% Pistol 27.0% 6.3% Revolver 42.2% 16.3% Rifle 97.0% 50.0% Shotgun 91.0% 73.3% Sub Machine Gun 48.7% 16.3% 44.5% 15.4% * Until June 2006 ** Includes grenade launcher, mortar, rocket and others Source: Policía Nacional Processed by CERAC Without permission Total Carrying Total Holding Total
  • 24. Documentos de trabajo cerac – número 14 – diciembre 2009 22 (21%) and shotguns (14%). Roughly 22% of all seized firearms were of the Indumil-made Llama brand, of which 72% lacked carrying permits (or at least the holding permit was not being carried with the gun). Approximately 19.5% of the confiscated weapons were Smith & Wesson, 78.3% illegal, followed by home- made revolvers (Table 19). Table 19. Confiscated firearm brand by type and permit, January-May 2005 Also, newly available data show the type of manufacturing of the gun if it is: industrially made or if it is a home-made weapon. Tables 20 and 21 display the figures for Colombia and Bogotá, 2003 and the first semester of 2006. These show that the majority of confiscated weapons in Colombia and Bogotá are original, being the higher proportion in Bogotá: 95% and of 72%. In the whole of the country, on the other hand a 12% of confiscated firearms are home-made weapons. Table 20. Confiscated firearms by type of fabrication. Colombia, 2003-June 2006 Table 21. Confiscated firearms by type of fabrication. Bogotá, 2003-June 2006 Type Brand With permit Without permit Percentage Revolver Llama 28.0% 72.0% 21.2% Smith & Wesson 21.7% 78.3% 19.5% Colt 100.0% 5.1% Ruger 20.0% 80.0% 4.2% Home Made Weapon 100.0% 5.9% Not reported 100.0% 7.6% Total Revolver 17.3% 82.7% 63.6% Pistol Prieto Beretta 28.6% 71.4% 5.9% Browning 25.0% 75.0% 3.4% Smith & Wesson 100.0% 1.7% Ceska 100.0% 0.8% Colt 100.0% 0.8% CZ83 100.0% 0.8% FN 100.0% 0.8% Glock 100.0% 0.8% Llama 100.0% 0.8% Mauser 100.0% 0.8% Parabellum 100.0% 0.8% Sig Sauer 100.0% 0.8% Taurus 100.0% 0.8% Walther 100.0% 0.8% Not reported 100.0% 0.8% Total Pistol 20% 80% 21.2% Shotgun Home Made Weapon 100% 5.1% Remington 50% 50% 1.7% Indumil 100% 0.8% Mossberg 100% 0.8% Ruger 100% 0.8% Not reported 5.1% Total Shotgun 12% 88% 14.4% Other firearms Not reported 100% 0.8% Total 16.9% 83.1% 100.0% Source: Policía Nacional Processed by CERAC Type of firearm 2003 2004 2005 2006* Revolver 26,217 32,768 39,453 27,517 Pistol 13,353 18,757 22,063 16,051 Shotgun 1,519 1,523 1,505 1,593 Sub Machine Gun 151 190 229 111 Rifle 131 153 158 135 Carbine 80 54 50 48 Others** 14 12 10 16 Machine Gun 7 8 12 19 41,472 53,465 63,480 45,490 Shotgun 4,067 4,353 4,305 3,261 Revolver 3,045 3,748 4,165 3,044 Pistol 688 954 947 630 Others** 5 27 39 33 Sub Machine Gun 14 24 14 13 Carbine 17 10 19 17 Rifle 3 3 2 7 Machine Gun 3 5 7,839 9,122 9,496 7,005 Revolver 6,776 8,573 12,051 164 Pistol 2,352 3,017 4,813 80 Shotgun 1,863 2,570 3,169 56 Rifle 108 155 132 1 Others** 48 48 37 5 Sub Machine Gun 38 50 39 10 Carbine 33 33 66 1 Machine Gun 8 6 10 11,226 14,452 20,317 317 60,537 77,039 93,293 52,812 * Until June 2006 ** Includes grenade launcher, mortar, rocket and others Source: Policía Nacional Processed by CERAC Total ORIGINAL HOME MADE WEAPON NO REPORTED Total Total Total Permit Type of firearm 2003 2004 2005 2006* Revolver 8,445 10,504 13,699 7,476 Pistol 4,756 6,809 8,357 4,830 Shotgun 385 314 325 243 Sub Machine Gun 49 67 92 24 Rifle 9 10 7 2 Carbine 6 5 4 8 Machine Gun 3 2 3 5 Others** 5 1 1 13,658 17,712 22,487 12,589 Shotgun 789 628 358 124 Revolver 351 372 300 146 Pistol 36 59 33 30 Sub Machine Gun 2 3 1 Carbine 2 1 Others** 1 1,180 1,063 692 301 Revolver 28 12 210 7 Pistol 10 13 142 Shotgun 9 8 32 1 Sub Machine Gun 1 2 1 3 Others** 3 1 2 Carbine 1 2 Machine Gun 2 Rifle 1 1 53 37 391 11 14,891 18,812 23,570 12,901 * Until June 2006 ** Includes grenade launcher, mortar, rocket and others Source: Policía Nacional Processed by CERAC NO REPORTED Total Total HOME MADE WEAPON Total Total ORIGINAL
  • 25. Documentos de trabajo cerac – número 14 – diciembre 2009 23 Table 22. Distribution of confiscated firearms by type of crime and permit status, January-May 2005 A more useful measure pure criminal demand is the association of different types of criminal events with the firearm involved in a crime, although the necessary is only available from 2005 onwards10. Table 22 shows the type of crime associated with a confiscated firearm for Bogotá, indicating that 83% of the firearms used in crimes did not have a permit. Roughly 47% of the guns confiscated during the period were for offences against the regulation of firearms (i.e., production, trafficking, and carrying of firearms or munitions without a license. Theft11 ranks second in terms of firearm confiscations (24%), and only one quarter of these were registered. Personal injuries were associated with roughly 12% of firearms confiscations, of which 50% were covered by a license. Approximately 10% of seized weapons were associated with homicides, and, of those, 75% were illegal. Table 23 presents the brands of firearms associated with different crimes. Several conclusions can be extracted from these figures. First, arms confiscation efforts by the National Police have been growing year on year. It is possible that an increase in the number of guns flowing into the city has led to this increase in confiscation with the same level of effort by the authorities. In our opinion, this is not the case. It is more likely that the National Police and the Metropolitan Police (the section of National Police concerned with the security in the city) has identified this as a good practice and a police activity that offers a measurable indicator that also has an impact on crime levels. We conclude that this is the case based on interview held with Metropolitan Police officers. In a highly insecure environment, the enforcement of firearms regulation is a policy of choice for the police. At the same time, we do not identify a relaxation of 10 This information corresponds only to the confiscated firearms that have a record of the crime associated with it. This is less that 1% of the total confiscations in Bogotá for 2005, hence the significance of the assertions that are made here must consider this. 11 Theft includes here theft of vehicles, petrol, banks, armed robbery and armed robbery in households. border controls or anti-arms trafficking activities that would have lead to an increase in the supply of firearms. Crime associated Percentage With permit Without permit Producing, Trafficking, illegal firearm or ammunition handling 47% 0% 100% Theft* 24% 24% 76% Personal injuries 12% 50% 50% Homicide 10% 25% 75% Crime association 4% 60% 40% Damagge to goods 1% 0% 100% Money laundering 1% 0% 100% Authority impersonation 1% 0% 100% Total 17% 83% * Includes theft of vehicles, petrol, banks, to people and houses Processed by CERAC
  • 26. Documentos de trabajo cerac – número 14 – diciembre 2009 24 Table 23. Confiscated firearms by associated crime and weapon brand, January-May 2005 Additionally, we conclude that the increase in the demand for pistols is a trend that is prevalent. Furthermore, legal firearms have a high likelihood of becoming potentially criminal firearms, but not in most cases as firearms regulation is relatively tightly controlled. Demand for the use of firearms in violent crimes (including homicide) is satisfied overwhelmingly by the illegal gun market. Finally, as a very low proportion of violent crimes is successfully prosecuted (see Restrepo, 2004) we find that violations of firearms regulation is used as a proxy to process individuals linked with criminal activity. In Colombia, the police and justice system face a formidable challenge in terms of violent crime, and in many occasions, the only offence that is detectable and punishable is the confiscation of a firearm and the subsidiary process of carrying a gun without permit. 3.3 Demand for Use: Firearms Deaths in Bogotá In this section, we assess criminal demand for firearms based on the analysis of DANE’s data, Colombia’s National Department of Statistics on firearm deaths in Bogotá and Colombia between 1979 and 2003 and National Police for 2003-2007. Unfortunately, we have not yet been able to get information on the use of guns in other forms of violence against persons (as thefts, threats, kidnappings, etc.). We nonetheless argue that the use of lethal violence indicators is not only appropriate but particularly justified in that they are the most serious of all forms of violence against people. Some 45,000 people have died in firearm related events in Bogotá between 1979 and 2005, constituting roughly 8% of the deaths in the capital caused by natural and external causes. Since the mid-1980s, 40% deaths due to external causes can be attributed to firearms. Deaths by firearm show a clear inverted (V) pattern, climbing throughout the 1979-1993 period when they reached a peak of 3,358 people killed (see Table 24, Table 25 and Graph 6 ). From then on, firearms deaths have declined continuously reaching the 1,273 figure by end-2003, the lowest since 1988. Recall that a new firearms regulatory framework was issued in 1993-94: we find a plausible association of this new, more restrictive regulation and the Brand of the firearm Crime association Damagge to goods Producing, Trafficking, illegal firearm or ammunition handling Homicide Theft* Money laundering Injuries Authority impersonation Total Llama 18% 33% 33% 21% 100% 22% Smith & Wesson 20% 22% 8% 8% 21% 21% Not reported 100% 18% 8% 8% 21% 14% Hechiza 18% 7% 11% Colt 4% 17% 17% 6% Prieto Beretta 40% 2% 17% 17% 7% 6% Ruger 7% 5% Browning 2% 8% 8% 7% 3% Remington 20% 2% 2% Ceska 2% 1% CZ83 1% FN 7% 1% Glock 20% 1% Indumil 7% 1% Mauser 2% 1% Mossberg 2% 1% Parabellum 8% 8% 1% Sig Sauer 100% 1% Taurus 1% Walther 2% 1% Percentage 4% 1% 47% 10% 10% 1% 12% 1% 100% Source: Policía Nacional Processed by CERAC * Includes theft of vehicles, petrol, banks, to people and houses Crime
  • 27. Documentos de trabajo cerac – número 14 – diciembre 2009 25 reduction in firearms deaths that took place in Bogotá afterwards. Also Table 25 shows how between 1979 and 1993 the deaths by external causes and by firearm increase rapidly, and that during the period 1993-2003 had a rapid and large reduction, especially in Bogotá. Bogotá has been a net contributor to the reduction of homicidal violence in the whole country. Its share in the total number of deaths by external causes in Colombia has fallen from a peak of 15% in 1993 to a low of 8 % in 2003. Moreover, the share in the total number of firearms deaths fell from 13% of the total in the country to just 4% by the end of 2004 (Graph 7). Still, historically, the impact of firearms in Bogotá has been smaller than the one in the country as a whole: the share of firearm deaths in total deaths between 1979 and 2003 reached 11% for the nation and only 7% in Bogotá. While firearm deaths in Bogotá showed an increase of 125% between 1979 and 2003 (from 565 to 1,273 deaths), in the whole country over the same period there was a staggering fivefold increase (3,617 to 23,073). The proportions of deaths by firearm in Bogotá and Colombia between 1979 and 2003 are in Graph 7. Using estimates of population we use rates per 100.000 inhabitants to account for the risk exposure of the population . In Bogotá, the all-cause mortality rate has been relatively stable while the rate of external deaths and by firearms show the influence of homicides, first increasing until 1993 (the rate of deaths by firearm was 63 per 100,000 inhabitants) and then decreasing continuously until 2003 (see Graph 8), when it fell well below the historical minimum. Our projection shows that we will be reaching even lower rates for 2006, rates around 16 per each 100,000 inhabitants. By 2003, the rate of deaths by firearm in Bogotá was 19 per 100,000; in Colombia, the rate was 52 per 100,000 (see Table 26). Table 24. Percentage of total deaths attributable to external causes, firearms, and percentage of external cause deaths attributable to firearms, Colombia and Bogotá. 1979-2003 Year Firearm deaths/Total External Causes/Total Firearm deaths/exter nal causes Firearm deaths/Total External Causes/Total Firearm deaths/exter nal causes 1979 3% 14% 23% 3% 16% 20% 1980 4% 15% 26% 4% 16% 24% 1981 5% 16% 30% 4% 15% 26% 1982 5% 16% 31% 4% 17% 27% 1983 5% 17% 31% 5% 17% 27% 1984 6% 18% 34% 5% 16% 31% 1985 7% 19% 39% 6% 17% 36% 1986 9% 21% 45% 7% 16% 42% 1987 10% 21% 46% 7% 17% 38% 1988 11% 23% 50% 7% 17% 40% 1989 12% 23% 52% 8% 19% 41% 1990 13% 24% 54% 8% 19% 43% 1991 15% 27% 58% 9% 21% 45% 1992 15% 26% 57% 10% 22% 45% 1993 15% 26% 55% 12% 24% 50% 1994 14% 26% 53% 11% 22% 49% 1995 13% 24% 51% 10% 21% 46% 1996 13% 24% 55% 10% 20% 47% 1997 13% 24% 54% 8% 18% 46% 1998 13% 24% 51% 8% 18% 42% 1999 13% 24% 53% 7% 17% 43% 2000 14% 25% 57% 7% 16% 41% 2001 14% 25% 59% 6% 15% 40% 2002 15% 25% 60% 5% 14% 38% 2003 12% 22% 50% 4% 11% 36% Average 1979-2003 11% 22% 47% 7% 18% 39% Source: DANE Processed by CERAC Colombia Bogotá
  • 28. Documentos de trabajo cerac – número 14 – diciembre 2009 26 Table 25. Total Deaths, deaths by external causes, and deaths by firearm, Colombia and Bogotá, 1979-2003 Graph 6. Evolution of deaths by external cause and firearm, Bogotá, 1979-2003 Año Total External Causes Firearms Deaths Total External Causes Firearms Deaths 1979 110,400 15,680 3,617 17,737 2,792 565 1980 125,573 18,898 4,980 17,439 2,754 664 1981 139,505 22,084 6,552 18,931 2,933 774 1982 137,678 22,685 7,127 16,764 2,807 751 1983 140,292 23,767 7,343 16,882 2,868 770 1984 137,189 24,455 8,211 18,399 2,978 921 1985 153,947 29,218 11,505 22,955 3,825 1,392 1986 146,345 30,210 13,472 19,812 3,265 1,369 1987 151,957 32,179 14,780 20,512 3,526 1,354 1988 153,065 34,995 17,447 19,857 3,307 1,325 1989 154,694 36,228 18,947 22,966 4,351 1,764 1990 156,314 38,107 20,569 23,407 4,416 1,909 1991 162,063 43,066 24,941 24,672 5,084 2,263 1992 167,743 44,395 25,084 26,328 5,727 2,602 1993 168,647 44,621 24,572 28,342 6,691 3,358 1994 168,568 43,287 23,118 28,267 6,198 3,011 1995 169,896 41,532 21,313 28,534 6,060 2,809 1996 173,506 42,307 23,062 29,228 5,929 2,784 1997 170,753 41,087 22,222 28,308 5,161 2,398 1998 175,363 42,823 21,950 26,579 4,824 2,002 1999 183,553 43,959 23,320 28,487 4,753 2,040 2000 187,432 46,031 26,465 28,440 4,600 1,884 2001 191,513 47,175 27,618 28,864 4,258 1,693 2002 192,262 48,438 28,989 29,137 3,993 1,527 2003 192,124 41,864 23,073 30,475 3,499 1,273 Total 1979-2003 4,010,382 899,091 450,277 601,322 106,599 43,202 ∆ 1979-1993 52.8% 184.6% 579.3% 59.8% 139.6% 494.3% ∆ 1979-2002 13.9% -6.2% -6.1% 7.5% -47.7% -62.1% ∆ 1979-2003 74.0% 167.0% 537.9% 71.8% 25.3% 125.3% Source: DANE Processed by CERAC Colombia Bogotá 0 1,000 2,000 3,000 4,000 5,000 6,000 7,000 1979 1980 1981 1982 1983 1984 1985 1986 1987 1988 1989 1990 1991 1992 1993 1994 1995 1996 1997 1998 1999 2000 2001 2002 2003 Deaths External Causes Deaths by firearmSource: DANE Process by CERAC
  • 29. Documentos de trabajo cerac – número 14 – diciembre 2009 27 Graph 7. Contribution of deaths in Bogotá to deaths in Colombia, by type, 1979-2003 Graph 8. Proportion of total deaths by firearm, Bogotá and Colombia, 1979-2003 4% 6% 8% 10% 12% 14% 16% 18% 20% 1979 1980 1981 1982 1983 1984 1985 1986 1987 1988 1989 1990 1991 1992 1993 1994 1995 1996 1997 1998 1999 2000 2001 2002 2003 Bogotá/Colombia Total External Causes Firearm DeathsSource: DANE Processed by CERAC 0 1,000 2,000 3,000 4,000 5,000 6,000 7,000 1979 1980 1981 1982 1983 1984 1985 1986 1987 1988 1989 1990 1991 1992 1993 1994 1995 1996 1997 1998 1999 2000 2001 2002 2003 Deaths External Causes Deaths by firearmSource: DANE Process by CERAC
  • 30. Documentos de trabajo cerac – número 14 – diciembre 2009 28 Graph 9. Death rates per 100,000 inhabitants by external cause, firearm, and total, Bogotá, 1985-2003 Table 26. Death rates per 100,000 inhabitants by external cause, firearm, and total, Colombia and Bogotá, 1985-2003 0 20 40 60 80 100 120 140 1985 1986 1987 1988 1989 1990 1991 1992 1993 1994 1995 1996 1997 1998 1999 2000 2001 2002 2003 Rateby100.000inhabitants 0 100 200 300 400 500 600 Rateby100.000inhabitants-Total Causas Externas Deaths by firearm External Causes Source: DANE Processed by CERAC Año Total External Causes Firearms Deaths Total External Causes Firearms Deaths 1985 486 92 36 533 89 32 1986 453 94 42 449 74 31 1987 461 98 45 453 78 30 1988 455 104 52 427 71 28 1989 451 106 55 479 91 37 1990 447 109 59 475 90 39 1991 454 121 70 487 100 45 1992 461 122 69 506 110 50 1993 454 120 66 529 125 63 1994 445 114 61 513 112 55 1995 441 108 55 503 107 49 1996 442 108 59 503 102 48 1997 426 103 55 475 87 40 1998 430 105 54 435 79 33 1999 441 106 56 454 76 33 2000 443 109 63 442 71 29 2001 445 110 64 439 65 26 2002 439 111 66 434 59 23 2003 431 94 52 444 51 19 ∆ 1979-2003 -11% 2% 42% -17% -43% -43% Average 1985-2003 449 108 57 474 88 38 Source: DANE Processed by CERAC Colombia Bogotá
  • 31. Documentos de trabajo cerac – número 14 – diciembre 2009 29 Deaths (violent or otherwise) show an annual positive growth over the whole period of 1979–2003 (see Table 27). Two distinct trends can be identified during the period: first, between 1979 and 1993, when total deaths, deaths due to external causes, and firearm deaths show a growth of 60%, 140% and 494%, respectively; second, between 1994 and 2003, when the level of violent deaths recedes, with growth rates of 7%, -48% and -62% (as seen in Table 25), respectively . In the second period, almost all annual growth rates are negative (see Graph 10).From 1993 onward, deaths decrease consistently, an observation which lends support to the hypothesis that legislation introduced in 1993 has had a positive effect on reducing firearm violence. This is confirmed by trends in the annual homicide rate, which declines by 15% over the period 1994 to 2003. Table 27. Annual growth rate of deaths, deaths by external cause, and deaths by firearm, Bogotá, 1980-2003 Deaths by firearm may occur in a variety of events, including accidents, suicides, homicides, events with undetermined intention, and police/military interventions. In Bogotá and elsewhere in Colombia, homicides are the most common events in which firearm deaths occur, with over 90% of all firearm deaths (see Graph 10). The intensity of the growth in the number of homicides before 1993 and the rapid decrease during the following years after this peak, explain most of the variation in the level of deaths by external causes and in deaths by firearms in Bogotá. Next section provides a brief description of recent homicide patterns in Bogotá and Colombia, based on analysis of alternative National Police information. Year Total External Causes Deaths by firearm 1980 -1.7% -1.4% 16.1% 1981 8.2% 6.3% 15.3% 1982 -12.2% -4.4% -3.0% 1983 0.7% 2.1% 2.5% 1984 8.6% 3.8% 17.9% 1985 22.1% 25.0% 41.3% 1986 -14.7% -15.8% -1.7% 1987 3.5% 7.7% -1.1% 1988 -3.2% -6.4% -2.2% 1989 14.5% 27.4% 28.6% 1990 1.9% 1.5% 7.9% 1991 5.3% 14.1% 17.0% 1992 6.5% 11.9% 14.0% 1993 7.4% 15.6% 25.5% 1994 -0.3% -7.7% -10.9% 1995 0.9% -2.3% -6.9% 1996 2.4% -2.2% -0.9% 1997 -3.2% -13.9% -14.9% 1998 -6.3% -6.8% -18.0% 1999 6.9% -1.5% 1.9% 2000 -0.2% -3.3% -8.0% 2001 1.5% -7.7% -10.7% 2002 0.9% -6.4% -10.3% 2003 4.6% -12.4% -16.6% Average 2.2% 1.6% 4.3% Source: DANE Process by CERAC
  • 32. Documentos de trabajo cerac – número 14 – diciembre 2009 30 Graph 10. Evolution of growth rates of total deaths, deaths by external cause, and deaths by firearm, Bogotá, 1979-2003 Graph 11. Firearms deaths by type, Bogotá, 1979-2003 -30% -20% -10% 0% 10% 20% 30% 40% 50% 1980 1981 1982 1983 1984 1985 1986 1987 1988 1989 1990 1991 1992 1993 1994 1995 1996 1997 1998 1999 2000 2001 2002 2003 AnnualGrowthRate Total External Causes Deaths by firearm Source: DANE Process by CERAC 0 500 1000 1500 2000 2500 3000 3500 1979 1980 1981 1982 1983 1984 1985 1986 1987 1988 1989 1990 1991 1992 1993 1994 1995 1996 1997 1998 1999 2000 2001 2002 2003 Deaths Accidents Suicidies Homicides Total deaths by firearms Source: DANE Processed by CERAC
  • 33. Documentos de trabajo cerac – número 14 – diciembre 2009 31 Graph 12. Firearms related deaths participation by external cause, Bogotá, 1979-2003 Graph 13. Firearms related deaths participation by external cause, Colombia, 1979-2002 0 10 20 30 40 50 60 70 80 90 100 1979 1980 1981 1982 1983 1984 1985 1986 1987 1988 1989 1990 1991 1992 1993 1994 1995 1996 1997 1998 1999 2000 2001 2002 2003 PProportionfirearmdeaths/deaths Accidents Suicides Homicides External Causes Source: DANE Processed by CERAC 0 10 20 30 40 50 60 70 80 90 100 1979 1980 1981 1982 1983 1984 1985 1986 1987 1988 1989 1990 1991 1992 1993 1994 1995 1996 1997 1998 1999 2000 2001 2002 Proportionfirearmdeaths/deaths Accidents Suicides Homicides External CausesSource: DANE Processed by CERAC
  • 34. Documentos de trabajo cerac – número 14 – diciembre 2009 32 Most homicides are carried out with firearms, both in Bogotá and in Colombia more generally. Specifically, about 67% of all homicides in Bogotá were carried out with a firearm. This percentage has a different dynamic in Bogotá than in the rest of Colombia, as shown in Graph 11 and Graph 1312. While in the capital there is a continuous fall in the proportion of homicides committed with a firearm since 1995, this variable has actually grown continuously during the whole period of study for the whole country. While the level of homicidal violence has fallen in Bogotá, demand for weapons has decreased among its residents. In the rest of the country, the contrary happened: a pattern of more homicidal violence with more guns has been prevalent. The rates per 100,000 inhabitants for deaths by firearm, and type of external cause in Bogotá appear in table 28. Table 28. Firearm death rates per 100,000 habitants, by type, Bogotá, 1979-2003 Patterns of death by firearm, gender, and age in Bogotá resemble those of Colombia as a whole. Throughout the entire period, men constitute 93% of firearm victims both in Bogotá and Colombia, while the proportion of total deaths is around 50% (both in Bogotá as well the rest of Colombia). In Colombia, 17% of men die as a result of firearms while in Bogotá this proportion is only 12%. Both in Colombia and in 12 From the total of deaths in Bogotá involving the use of weapons during the period 1979-2003, firearms are responsible for 75%, knives for 24%, and explosives for 1% of deaths. This pattern is similar in homicides. Only other external causes of death (e.g., suicides and accidents) are associated with different instruments and methods. Bogotá, less than 2% of women die in firearm-related incidents. The numbers of firearm deaths by gender in Bogotá and Colombia are shown in Table 29. On the other side, the temporal trend in firearm deaths among men in Bogotá as well as in Colombia shows a close correlation with deaths due to homicides over the period, increasing between 1979 and 1993, and then decreasing from 1993 onward. For women, this rate is relatively constant between 1979 and 1993, as shown in Table 30 and Graph 14. In Bogotá as well as in Colombia, the rate of firearm deaths for men is tenfold that for women. In 2002, the rate for men in Bogotá was 43 per 100,000 and 4 per 100,000 for women. Table 29. Deaths by firearm and gender in Colombia and Bogotá, 1979-2002 Year Accidents Suicides Homicides Deaths by firearm 1985 0.1 0.9 31.3 32.3 1986 0.1 0.6 30.3 31.1 1987 0.0 0.4 29.5 29.9 1988 0.0 0.2 28.3 28.5 1989 0.0 0.7 36.1 36.8 1990 0.1 1.0 37.7 38.8 1991 0.2 1.0 43.6 44.7 1992 0.1 0.9 49.0 50.0 1993 0.1 0.5 62.1 62.7 1994 0.1 1.0 53.6 54.6 1995 0.0 0.8 48.6 49.5 1996 0.0 0.6 47.3 47.9 1997 0.1 0.9 39.3 40.3 1998 0.0 2.1 30.6 32.8 1999 0.0 2.0 30.5 32.5 2000 0.0 1.7 27.5 29.3 2001 0.1 1.9 23.8 25.8 2002 0.0 1.3 21.4 22.7 2003 0.0 1.3 17.2 18.5 Source: DANE Process by CERAC Men Women Men Women 1979 3339 281 502 63 1980 4641 338 615 49 1981 6100 444 718 56 1982 6621 501 687 64 1983 6874 471 708 62 1984 7692 519 857 64 1985 10772 733 1277 115 1986 12664 812 1266 103 1987 13879 908 1265 89 1988 16313 1151 1237 88 1989 17704 1254 1634 130 1990 19102 1471 1779 130 1991 23227 1726 2114 149 1992 23258 1835 2396 206 1993 22844 1763 3131 227 1994 21523 1614 2800 211 1995 19820 1486 2641 168 1996 21433 1617 2590 194 1997 20692 1558 2213 185 1998 20296 1522 1868 134 1999 21676 1573 1892 148 2000 24598 1763 1751 133 2001 25477 2043 1557 136 2002 26789 2110 1396 131 Source: DANE Processed by CERAC Year Colombia Bogotá
  • 35. Documentos de trabajo cerac – número 14 – diciembre 2009 33 Table 30. Death rates by firearm and gender in Colombia and Bogotá, 1985-2002 The age structure of deaths is similar in Bogotá and Colombia. Deaths by external causes and deaths by firearm are both concentrated among individuals aged 20 to 29 years (40% of the total), followed by individuals aged 30 to 39 (26%), and 10 to 19 (14%), as shown in Graph 14. Graph 16 and Graph 16 show that up to age 14 and after age 40, deaths are largely attributable to natural causes, both in Bogotá and in the rest of Colombia. Deaths occurring to individuals aged 15 to 40 are due in large part to external causes, particularly firearms, with the highest concentration between 24 and 29. Graph 14. Decomposition of deaths by age groups, Bogotá, 1979-2002. Graph 15. Death rates by external cause, firearm, and gender, Bogotá, 1985-2002 Men Women Men Women 1985 68 5 63 5 1986 79 5 61 4 1987 85 5 59 4 1988 98 7 56 4 1989 104 7 72 5 1990 110 8 76 5 1991 131 10 88 6 1992 129 10 97 8 1993 124 9 123 8 1994 115 8 107 7 1995 104 8 98 6 1996 110 8 93 6 1997 105 8 78 6 1998 101 7 64 4 1999 105 7 63 5 2000 118 8 57 4 2001 120 9 49 4 2002 124 10 43 4 Source: DANE Processed by CERAC Year Colombia Bogotá 1% 14% 40% 26% 12% 5% 2% 0% 0% 0% 1 to 9 10 to 19 20 to 29 30 to 39 40 to 49 50 to 59 60 to 69 70 to 79 80 or more Undetermined 0 50 100 150 200 250 1985 1986 1987 1988 1989 1990 1991 1992 1993 1994 1995 1996 1997 1998 1999 2000 2001 2002 Rateper100.000inhabitants External cause - Men External Cause - Woman By firearm - Men By firearm - Women Source: DANE Processed by CERAC
  • 36. Documentos de trabajo cerac – número 14 – diciembre 2009 34 Graph 16. Total deaths, deaths by natural causes, deaths by external causes, and deaths by firearms, Bogotá, 1979-2002 Graph 16. Total deaths, deaths by natural causes, deaths by external causes, and deaths by firearms, Colombia, 1979-2002 0 10000 20000 30000 40000 50000 60000 2 to 4 years5 to 9 years 10 to 14 years 15 to 19 years 20 to 24 years 25 to 29 years 30 to 34 years 35 to 39 years 40 to 44 years 45 to 49 years 50 to 54 years 55 to 59 years 60 to 64 years 65 to 69 years 70 to 74 years 75 to 79 years 80 to 84 years 85+ Total Natural Causes External Causes By firearmSource: DANE Processed by CERAC 0 50000 100000 150000 200000 250000 300000 350000 400000 2 to 4 years5 to 9 years 10 to 14 years 15 to 19 years 20 to 24 years 25 to 29 years 30 to 34 years 35 to 39 years 40 to 44 years 45 to 49 years 50 to 54 years 55 to 59 years 60 to 64 years 65 to 69 years 70 to 74 years 75 to 79 years 80 to 84 years 85+ Total Natural Causes External Causes By firearm Source: DANE Processed by CERAC
  • 37. Documentos de trabajo cerac – número 14 – diciembre 2009 35 In spite of the substantial reduction in firearm deaths in Bogotá, the rate is still quite high by international standards. In Mexico City, for example, the proportion of firearm deaths to total deaths peaks in 1987 at 2.3% while Bogotá reaches a peak of 12% in 1993. In 2002, that proportion in Mexico City was 1.2% while for Bogotá, continues been higher: 5%. As in Bogotá (and the rest of Colombia), the majority of deaths due to firearms in México occur by homicide (roughly 80%). The rate of deaths by firearm per 100,000 inhabitants in 2002 in Mexico City was 8.15; in Bogotá that same year, the rate was almost three times as great (23 per 100,000). Nonetheless, Bogotá has been more fortunate than other large Colombian cities such as Cali and Medellín. As shown in Graph 17 and Table 31 Bogotá has a lower proportion of deaths by firearm than these other cities. For the whole period (1979-2002), Medellín had three times the proportion of Bogotá (21%) and Cali one and a half times the proportion (11%). Furthermore, firearm death rates in Cali and Medellín have been higher than in Bogotá between 1979 and 2002 (See Table 31). Graph 17. Deaths by firearm with respect to total deaths, Medellín, Cali, and Bogotá, 1979-2002 In conclusion, firearms demand for criminal intentions in Bogotá has two well defined periods. The first is the period from 1979 to 1993, when firearms deaths show a high growth rate and contribute substantially to the number of total deaths in the city. The second period, characterized by rapid violence reduction, starts in 1993 and coincides with new firearms regulation and new policy interventions. During the whole period, firearms homicides are the main explanatory phenomena that explain the deterioration and improvement of human security in the city. At the same time, it is clear that there is a dynamic demand for guns for homicidal use. Then, the manner in which different policies have had an impact on this particular demand will be analyzed in this document. 0% 5% 10% 15% 20% 25% 30% 35% 40% 1979 1980 1981 1982 1983 1984 1985 1986 1987 1988 1989 1990 1991 1992 1993 1994 1995 1996 1997 1998 1999 2000 2001 2002 Medellín Cali Bogotá Source: DANE Processed by CERAC
  • 38. Documentos de trabajo cerac – número 14 – diciembre 2009 36 Table 31. Deaths by firearm with respect to total deaths, Medellín, Cali, and Bogotá, 1979-2000 Table 32. Deaths by firearm per 100,000 inhabitants, Medellín, Cali, and Bogotá, 1995-2002 Año Medellín Cali Bogotá 1979 4.3% 2.5% 3.2% 1980 5.6% 3.1% 3.8% 1981 7.5% 4.3% 4.1% 1982 7.2% 4.0% 4.5% 1983 7.1% 3.4% 4.6% 1984 9.4% 4.9% 5.0% 1985 13.0% 9.0% 6.1% 1986 16.4% 11.0% 6.9% 1987 18.8% 7.1% 6.6% 1988 23.2% 6.9% 6.7% 1989 26.9% 8.3% 7.7% 1990 32.1% 8.3% 8.2% 1991 35.9% 10.9% 9.2% 1992 32.8% 12.1% 9.9% 1993 30.1% 13.9% 11.8% 1994 26.8% 16.5% 10.7% 1995 23.8% 15.3% 9.8% 1996 22.6% 14.1% 9.5% 1997 20.7% 11.5% 8.5% 1998 19.0% 12.4% 7.5% 1999 19.8% 13.6% 7.2% 2000 19.9% 13.9% 6.6% 2001 20.7% 13.5% 5.9% 2002 21.4% 13.5% 5.2% Total 1979-2002 21.0% 10.7% 7.3% Año Medellín Cali Bogotá 1995 211 101 49 1996 195 95 48 1997 172 71 40 1998 146 79 33 1999 158 91 33 2000 151 89 29 2001 164 89 26 2002 170 86 23
  • 39. Documentos de trabajo cerac – número 14 – diciembre 2009 37 3.3.1 Recent patterns in homicide in the Colombian cities: National Police Data The level of homicide violence is a good proxy of the level of firearm violence in Colombia, insofar as a large proportion of homicides are perpetrated with firearms. In each of the three largest Colombian cities (Bogotá, Medellín and Cali), an upward trend in homicides occurs until the year 1994, at which point violence begins to diminish until 2002 (Graph 19). Medellín remarkably reduced its contribution to the total number of homicides in 1991 and also in 2002. The annual variation in homicides in Colombia over the last two decades can be explained by the annual variation in rates of municipalities other than Bogotá. Nonetheless, the annual variation of homicides in Bogotá has strongly influenced the annual variation of national homicides in the years 1989, 1993- 1994, and 1997. It is also worth noticing that the trend of homicides in Bogotá moves in the opposite direction to that of Colombia during the period 1989–1993 (see Graph 21). Graph 19. Evolution of homicide level in Bogotá, Medellín, Cali, 1988-2009 0 500 1.000 1.500 2.000 2.500 3.000 3.500 4.000 4.500 5.000 1990 1991 1992 1993 1994 1995 1996 1997 1998 1999 2000 2001 2002 2003 2004 2005 2006 2007 2008 2009 Medellín,BogotáyCali 0 5.000 10.000 15.000 20.000 25.000 30.000 35.000 Colombia Medellín Bogotá Cali Colombia