"I see eyes in my soup": How Delivery Hero implemented the safety system for ...
Zerega San Diego Gas & Electric Presentation - July 31, 2012
1. $0.00
$1.00
$2.00
$3.00
$4.00
$5.00
$6.00
10 20 30 40 50
F
u
e
l
c
o
s
t
MPG >
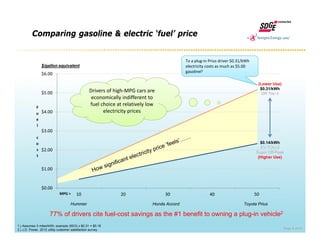
Comparing gasoline & electric ‘fuel’ price
1.) Assumes 3 miles/kWh; example (50/3) x $0.31 = $5.16
2.) J.D. Power, 2012 utility customer satisfaction survey
Toyota Prius
To a plug‐in Prius driver $0.31/kWh
electricity costs as much as $5.00
gasolinel1
$0.14/kWh
EV-TOU-2
Super Off-Peak
(Higher Use)
(Lower Use)
$0.31/kWh
DR Tier 4
Hummer Honda Accord
$/gallon equivalent
Drivers of high‐MPG cars are
economically indifferent to
fuel choice at relatively low
electricity prices
Page 6 of 21
77% of drivers cite fuel-cost savings as the #1 benefit to owning a plug-in vehicle2
2. $1.61 $1.61 $1.61 $1.61
$23
$11
$8 $6
$24
$12
$8
$6
$2.93
$1.52
$1.04
$0.81
(1)
4
9
14
19
24
$0
$10
$20
$30
$40
$50
$60
30 60 90 120
Cars charged during 30‐day period
23‐minutes per car at 48 kW All other times
During On‐Peak
Energy
Total charging hrs/day
Utility billing cost per 50-miles
On AL-TOU in Summer1
1.) Assumes AL-TOU rate as of May 2012; 90% charging efficiency and 3 miles/kWh
2.) Average $/kWh = (total utility bill / total kWh measured at meter during billing period) / total cars charged during billing period
3.) Assumes 48 MPG (e.g. 2012 Plug-in Prius) and 3 miles/kWh
4.) Assumes average of AL-TOU On, Semi and Off-Peak and includes UDC, Commodity, DWR Bond, Taxes (i.e., approximately ~$0.10./kWh) as of Jun 2012
$46.96 gge3
Demand
Charges
Hours
$12.91 gge
Average
$/kWh2
(1 car per day) (4 cars per day)
For a Plug‐in Prius driver, utility billing costs can
quickly exceed gasoline3 if site loads are not
managed, even at high utilization rates.
2% utilization 3% utilization 5% utilization 6% utilization
Fast Charge - Highest Cost
Page 9 of 21
3. $1.61 $1.61 $1.61 $1.61
$0.67 $0.33 $0.22 $0.17
$0.70
$0.35 $0.23 $0.18
$0.18
$0.14 $0.12
$0.12
(1)
4
9
14
19
24
$0
$1
$2
$3
$4
$5
$6
$7
$8
$9
$10
30 60 90 120
Cars charged during 30‐day period
13.2 hours per car at 1.4 kW All other times
During On‐Peak
Energy
Total charging hrs/day
Utility billing cost per 50-miles
On AL-TOU in Summer1
$2.88 gge3
Demand
Charges
Hours
(1 car per day) (4 cars per day)
Charging from standard 120V outlets is low cost
even with all demand charges...and serves the
overwhelming majority of drivers before Noon.
*Infeasible due to
charge duration
55% utilization 108% utilization
*Each Level 1 unit can provide
one 50-mile charge each day
Level 1 - Highest Cost
Page 11 of 21
1.) Assumes AL-TOU rate as of May 2012; 90% charging efficiency and 3 miles/kWh
2.) Average $/kWh = (total utility bill / total kWh measured at meter during billing period) / total cars charged during billing period
3.) Assumes 48 MPG (e.g. 2012 Plug-in Prius) and 3 miles/kWh
4.) Assumes average of AL-TOU On, Semi and Off-Peak and includes UDC, Commodity, DWR Bond, Taxes (i.e., approximately ~$0.10./kWh) as of Jun 2012
4. Summary - costs per car
AL-TOU in Summer
4 cars/day Utilization1 No Load
Management
No New On‐
Peak
No New
Demand
CAPEX2,3
Fast Charge 6%
$0.81/kWh
$12.91 gge
$0.46/kWh
$7.38 gge
$0.10/kWh
$1.61 gge
$0.14/kWh
$2.32 gge
Level 2 70%
$0.16/kWh
$2.58 gge
$0.13/kWh
$2.08 gge
$0.10/kWh
$1.61 gge
$0.03/kWh
$0.45 gge
Level 1 55%
$0.18/kWh
$2.88 gge
‐ ‐
$0.005/kWh
$0.09 gge
1.) Hours actively charging / 24
2.) CAPEX assumptions: $100,000 for DCFC, $15,000 for Level 2, $1,000 for Level 1
3.) Assumes: $0 O&M costs; 48 MPG; 3 miles/kWh;10 year book life; 5 Yr straight-line depreciation; 40% tax rate; 5% cost of capital; 90% charging efficiency; 365 Days available
per year and $26.43 per kW demand charge.
1 car/day Utilization1 No Load
Management
No New On‐
Peak
No New
Demand
CAPEX
Fast Charge 2%
$2.93/kWh
$46.96 gge
$1.55/kWh
$24.87 gge
$0.10/kWh
$1.61 gge
$0.05/kWh
$8.68 gge
Level 2 23%
$0.29/kWh
$4.63 gge
$0.20/kWh
$3.13 gge
$0.10/kWh
$1.61 gge
$0.08/kWh
$1.35 gge
Without demand charges, utility billing cost
per car doesn’t vary with speed or
utilization rate; only energy costs remain.
Equipment cost can add significantly
to per‐car charging costs2,3
Page 12 of 21
5. How far do your employees drive to work?
0%
5%
10%
15%
20%
25%
30%
35%
40%
0 5 15 25 35 45 55 65 75 85 95 105 115 125 135 145 155 165 175 185 195
Portion of daily trips
Daily miles driven
Daily miles driven
2009 National Household Travel Survey
Source: U.S. DOT, Federal Highway Administration 2009 National Household Travel Survey http://nhts.ornl.gov/2009/pub/stt.pdf
Trips exceeding ½ of all-electric Nissan LEAF range
The majority of people drive
relatively few miles each day
SDG&E employee average use:
30 LEAFs, 2 Volts, 1 Active‐E, 1
conversion (16 users)
~3 kWh/session
Done well before “On‐Peak”
0.3 sessions/day/EVSE
Page 13 of 21
6. Matching charging equipment to charging time
Hours required to recharge, at various power levels
0
2
4
6
8
10
12
14
1.8 kW 6.6 kW 50 kW
80 miles
35 miles
10 miles
Assumptions: 3 miles of range per kWh, measure at utility meter; costs are illustrative – approximations of ‘all-in’ installed cost
Note: San Diego "...average regional commute…23.7 daily miles per person...” http://www.movesandiego.org/reports.html
Hours parked at work
$500 20-Amp outlet
No monthly fees
$10,000 Level 2
Possible fees
$50,000 DC Fast Charger
Possible fees
A 10 and 35 mile charge are finished
well before the end of the workday.
Re‐charging in the entire time you remain parked results in least cost
Required range
An 80 mile charge from an outlet takes
longer that the entire workday.
Hrs.
Page 14 of 21
7. Emerging policies
• IRS definition of “De minimis”
– …so small as to make accounting for it unreasonable or impractical
• An essential element of de minimis benefits - frequency and value
– Must be occasional or unusual in frequency
• Includes such items as (precede all with word “occasional”):
– Use of photocopier
– Snacks, coffee, doughnuts, etc.
– Tickets for entertainment events; holiday gifts
– Meal money or transportation expense for working overtime
– Personal use of a business cell phone
• Carbon credits, as per Air Resources Board
– Owned by the employer
– Estimated is OK – until Nov 2015 – then measurement is required (SB 1455)
http://www.irs.gov/govt/fslg/article/0,,id=184791,00.html Page 16 of 21