SlideShare ist ein Scribd-Unternehmen logo
1 von 18
Downloaden Sie, um offline zu lesen
Acme Company
                                                                                                         Income Statement


             A    B                                        Jan          Feb          Mar          Apr          May            Jun          Jul          Aug          Sep          Oct          Nov          Dec          Year


                       REVENUE
             8   382    Recurring Service                 $583,022     $641,706     $707,045     $780,101     $858,888       $942,593    $1,033,925   $1,135,161   $1,243,571   $1,359,631   $1,485,008   $1,616,996   $12,387,646
             9   401    Software                            $91,115    $101,686     $121,995     $123,304     $143,851       $145,398     $166,183     $177,587     $189,110     $210,371     $212,632     $234,131     $1,917,363
            10   411    Installation                      $263,000     $287,750     $328,500     $359,750     $394,250       $421,750     $470,000     $511,000     $539,500     $587,750     $630,250     $659,750     $5,453,250
            11   395    Hardware Sales                   $2,912,840   $3,157,690   $3,591,810   $3,899,085   $4,236,525     $4,509,625   $4,942,163   $5,373,113   $5,646,963   $6,079,500   $6,535,850   $6,810,450   $57,695,613
            12   413    Other                                    $0           $0           $0           $0           $0             $0           $0           $0           $0           $0           $0           $0            $0
            13            Total                          $3,849,977   $4,188,832   $4,749,350   $5,162,240   $5,633,514     $6,019,366   $6,612,270   $7,196,860   $7,619,144   $8,237,252   $8,863,740   $9,321,327   $77,453,872

                       COSTS OF SALES
            16   527    Network Operation/Maintenance     $213,835     $235,897     $261,137     $288,872     $319,103       $351,374     $387,384     $426,573     $467,801     $512,770     $560,844     $610,959     $4,636,549
            17   669    Operations Staff                  $184,019     $204,919     $219,246     $215,681     $220,978       $216,978     $236,186     $239,986     $228,186     $228,186     $236,913     $232,913     $2,664,190
            18   518    Third-Party Installations         $123,000     $135,000     $156,000     $171,000     $187,500       $201,000     $222,000     $243,000     $256,500     $277,500     $297,000     $310,500     $2,580,000
            19   513    Cost of Hardware Sold            $1,897,400   $2,047,213   $2,314,060   $2,498,119   $2,704,676     $2,871,389   $3,125,967   $3,390,292   $3,557,504   $3,812,083   $4,115,738   $4,283,450   $36,617,889
            20   487    Depreciation                        $48,042      $48,874      $50,334      $51,166      $51,998        $52,865      $53,697      $54,529      $55,039      $55,550      $56,167      $56,678     $634,941
            21            Total                          $2,466,297   $2,671,902   $3,000,778   $3,224,838   $3,484,255     $3,693,606   $4,025,234   $4,354,379   $4,565,031   $4,886,088   $5,266,662   $5,494,500   $47,133,570

            23         GROSS MARGIN                      $1,383,680   $1,516,930   $1,748,572   $1,937,402   $2,149,259     $2,325,761   $2,587,036   $2,842,481   $3,054,113   $3,351,164   $3,597,078   $3,826,827   $30,320,302

                       S, G, & A
            26 716       Engineering                      $237,540     $237,540     $237,540     $237,540     $237,540       $237,540     $237,540     $237,635     $237,635     $237,635     $237,635     $237,635     $2,850,958
            27 789       Marketing & Sales                $364,918     $411,750     $391,287     $401,193     $428,313       $433,326     $461,236     $510,583     $487,009     $503,140     $517,848     $528,658     $5,439,263
            28 856       Administration                   $269,120     $286,120     $291,267     $294,485     $293,985       $298,984     $293,484     $328,576     $302,076     $300,576     $300,576     $400,576     $3,659,826
            29           Amortize Org / Start-Up Costs       $540         $540         $540         $540         $540            $540           $11           $0           $0           $0           $0           $0        $3,251
            30 13        Bad Debt                          $19,250      $20,944      $23,747      $25,811      $28,168         $30,097      $33,061      $35,984      $38,096      $41,186      $44,319      $46,607     $387,269
            31           Other                              $8,500       $8,500       $8,500       $8,500       $8,500          $8,500       $8,500       $8,500       $8,500       $8,500       $8,500       $8,500     $102,000
            32             Total                          $899,868     $965,395     $952,881     $968,069     $997,046      $1,008,988   $1,033,834   $1,121,279   $1,073,316   $1,091,037   $1,108,878   $1,221,976   $12,442,567

            34         EBIT                               $483,812     $551,535     $795,691     $969,333    $1,152,213     $1,316,773   $1,553,202   $1,721,202   $1,980,797   $2,260,126   $2,488,200   $2,604,851   $17,877,735

            36 125       Interest Expense                      $43          $38          $33          $28          $22            ($2)         ($2)         ($2)         ($2)         ($2)         ($2)         ($2)        $147
            37 146       Interest Income                    $4,139       $5,065       $5,817       $7,113       $9,313        $12,339      $15,698      $17,340      $19,879      $22,773      $25,791      $29,921      $175,188

            39         INCOME BEFORE TAXES                $487,907     $556,562     $801,475     $976,418    $1,161,504     $1,329,114   $1,568,903   $1,738,544   $2,000,678   $2,282,902   $2,513,994   $2,634,774   $18,052,775

            41           Taxes (40%)                             $0           $0           $0           $0           $0       $58,459     $627,561     $695,418     $800,271     $913,161    $1,005,597   $1,053,910    $5,154,377

            43         NET PROFIT                         $487,907     $556,562     $801,475     $976,418    $1,161,504     $1,270,656    $941,342    $1,043,127   $1,200,407   $1,369,741   $1,508,396   $1,580,865   $12,898,398


A = This Row #   B = Row # of driver                                                                                                                                                                                         Page 1
Acme Company
                                                                                                                         Balance Sheet


             A    B                                                 Jan           Feb           Mar           Apr            May            Jun             Jul           Aug            Sep            Oct            Nov            Dec            Year


                       ASSETS
                        Current
            99 184        Cash / Short Term Investments          $1,350,633    $1,551,238    $1,896,857    $2,483,517     $3,290,316      $4,186,048     $4,623,913     $5,300,955     $6,072,905     $6,877,658     $7,978,987     $8,924,966     $8,924,966
           100 13         Receivables                            $2,830,256    $3,078,556    $3,497,875    $3,797,418     $4,144,939      $4,420,663     $4,859,767     $5,286,002     $5,585,618     $6,037,561     $6,487,274     $6,810,217     $6,810,217
           101            Partners Notes Subscribed                      $0            $0            $0            $0             $0              $0             $0             $0             $0             $0             $0             $0             $0
           102 513        Inventory                              $3,070,819    $3,471,090    $3,747,178    $4,057,014     $4,307,083      $4,688,950     $5,085,438     $5,336,257     $5,718,124     $6,173,606     $6,425,175     $7,447,021     $7,447,021
           103            Prepaid Expenses                          $41,000       $38,000       $35,000       $32,000        $29,000         $26,000        $23,000        $20,000        $17,000        $50,000        $47,000        $44,000        $44,000
           104            Other                                   $144,027      $144,527      $145,027      $145,527       $146,027        $146,527       $147,027       $147,527       $148,027       $148,527       $149,027       $149,527       $149,527
           105              Total                                $7,436,735    $8,283,412    $9,321,937   $10,515,476    $11,917,365     $13,468,189    $14,739,145    $16,090,740    $17,541,673    $19,287,353    $21,087,463    $23,375,730    $23,375,730

                         Fixed
           108 454         PP&E                                   $2,304,597   $2,347,097   $2,420,597   $2,463,097   $2,505,597   $2,551,097   $2,593,597   $2,636,097   $2,660,597   $2,685,097   $2,715,597   $2,740,097                         $2,740,097
           109 488         Less Accum Depreciation               ($1,074,351) ($1,123,225) ($1,173,559) ($1,224,725) ($1,276,723) ($1,329,589) ($1,383,286) ($1,437,815) ($1,492,854) ($1,548,404) ($1,604,572) ($1,661,250)                       ($1,661,250)
           110               Net                                  $1,230,246   $1,223,872   $1,247,038   $1,238,372   $1,228,874   $1,221,508   $1,210,311   $1,198,282   $1,167,743   $1,136,693   $1,111,025   $1,078,847                         $1,078,847

                         Other
           113            Investments                                    $0            $0            $0            $0            $0                $0             $0            $0             $0             $0             $0             $0              $0
           114 172        Organizational / Start-Up Costs            $2,711        $2,171        $1,631        $1,091          $551               $11             $0            $0             $0             $0             $0             $0              $0
           115              Total                                    $2,711        $2,171        $1,631        $1,091          $551               $11             $0            $0             $0             $0             $0             $0              $0

           117                TOTAL ASSETS                       $8,669,692    $9,509,454   $10,570,606   $11,754,939    $13,146,790     $14,689,708    $15,949,456    $17,289,022    $18,709,416    $20,424,046    $22,198,488    $24,454,578    $24,454,578


                       LIABILITIES
           121           Accounts Payable                        $1,749,090    $1,950,271    $2,074,003    $2,193,062     $2,311,955      $2,493,717     $2,700,995     $2,857,711     $2,979,559     $3,209,744     $3,331,177     $3,903,553     $3,903,553
           122           Accounts Payable - ABC Company           $515,143      $562,225      $645,270      $692,878       $758,225        $811,373       $865,920       $949,618      $1,004,715     $1,060,713     $1,145,913     $1,202,860     $1,202,860
           123           Taxes/Benefits Payable                   $513,238      $548,685      $602,102      $643,878       $690,518        $730,359       $786,940       $842,966       $886,007       $944,714      $1,004,127     $1,050,029     $1,050,029
           124           Unearned Revenue                                $0            $0            $0            $0             $0              $0             $0             $0             $0             $0             $0             $0             $0
           125           Equipment Lease                             $4,328        $3,818        $3,300        $2,773         $2,238           ($249)         ($249)         ($249)         ($249)         ($249)         ($249)         ($249)         ($249)
           126           Convertible Debentures plus interest            $0            $0            $0            $0             $0              $0             $0             $0             $0             $0             $0             $0             $0
           127             Total                                 $2,781,798    $3,064,999    $3,324,675    $3,532,590     $3,762,937      $4,035,199     $4,353,606     $4,650,046     $4,870,032     $5,214,921     $5,480,967     $6,156,192     $6,156,192


                       CAPITAL
           131          Capital (Paid & Subscribed)              $16,223,356 $16,223,356 $16,223,356 $16,223,356 $16,223,356 $16,223,356 $16,223,356 $16,223,356 $16,223,356 $16,223,356 $16,223,356 $16,223,356                                   $16,223,356
           132 179      Capital Receivable                                $0            $0            $0            $0            $0            $0            $0            $0            $0            $0            $0            $0                      $0
           133 43       Capital Allocations - Prior Years       ($10,823,369) ($10,823,369) ($10,823,369) ($10,823,369) ($10,823,369) ($10,823,369) ($10,823,369) ($10,823,369) ($10,823,369) ($10,823,369) ($10,823,369) ($10,823,369)           ($10,823,369)
           134 43       Retained Earnings - Current Year           $487,907     $1,044,468    $1,845,944    $2,822,362    $3,983,866    $5,254,521    $6,195,863    $7,238,989    $8,439,396    $9,809,138 $11,317,534 $12,898,398                 $12,898,398
           135            Total                                   $5,887,894    $6,444,456    $7,245,931    $8,222,349    $9,383,853 $10,654,509 $11,595,850 $12,638,977 $13,839,383 $15,209,125 $16,717,521 $18,298,386                           $18,298,386

           137         TOTAL LIABILITIES & CAPITAL               $8,669,692    $9,509,454   $10,570,606   $11,754,939    $13,146,790     $14,689,708    $15,949,456    $17,289,022    $18,709,416    $20,424,046    $22,198,488    $24,454,578    $24,454,578


A = This Row #   B = Row # of driver                                                                                                                                                                                                                     Page 2
Acme Company
                                                                                                                     Cash Flow


             A    B                                           Jan           Feb           Mar           Apr            May           Jun           Jul           Aug           Sep           Oct           Nov           Dec           Year


           146         BEGINNING CASH                       $1,103,641    $1,350,633    $1,551,238    $1,896,857     $2,483,517    $3,290,316    $4,186,048    $4,623,913    $5,300,955    $6,072,905    $6,877,658    $7,978,987     $1,103,641

           148         NET PROFIT/LOSS                       $487,907      $556,562      $801,475      $976,418      $1,161,504    $1,270,656     $941,342     $1,043,127    $1,200,407    $1,369,741    $1,508,396    $1,580,865    $12,898,398

                       NON-CASH EXPENSES
           151    20    Depreciation                          $48,042       $48,874       $50,334       $51,166        $51,998       $52,865       $53,697       $54,529       $55,039       $55,550       $56,167       $56,678       $634,941
           152    29    Amortize Org / Start-Up Costs           $540          $540          $540          $540           $540          $540            $11            $0            $0            $0            $0            $0         $3,251
           153          Other                                      $0            $0            $0            $0             $0            $0            $0            $0            $0            $0            $0            $0             $0
           154            Total                               $48,582       $49,414       $50,874       $51,706        $52,538       $53,405       $53,708       $54,529       $55,039       $55,550       $56,167       $56,678       $638,192

                       WORKING CAP CHANGES
           157   121    Accounts Payable                     $293,954      $201,181      $123,732      $119,059        $118,893     $181,762      $207,278      $156,716      $121,848      $230,184      $121,433     $572,376       $2,448,416
           158   122    Accounts Payable - ABC Company      ($460,438)      $47,083       $83,045       $47,608         $65,348      $53,148       $54,548       $83,698       $55,098       $55,998       $85,200      $56,948        $227,280
           159   123    Taxes/Benefits Payable                ($8,706)      $35,447       $53,417       $41,776         $46,641      $39,840       $56,582       $56,025       $43,041       $58,707       $59,414      $45,901        $528,085
           160   124    Unearned Revenue                           $0            $0            $0            $0              $0           $0            $0            $0            $0            $0            $0           $0               $0
           161   126    Other Liabilities                          $0            $0            $0            $0              $0           $0            $0            $0            $0            $0            $0           $0               $0
           162   100    Accounts Receivable                  $195,913     ($248,301)    ($419,319)    ($299,543)      ($347,520)   ($275,725)    ($439,104)    ($426,235)    ($299,616)    ($451,944)    ($449,712)   ($322,943)     ($3,784,047)
           163   102    Inventory                           ($224,719)    ($400,271)    ($276,088)    ($309,836)      ($250,069)   ($381,867)    ($396,488)    ($250,819)    ($381,867)    ($455,483)    ($251,569) ($1,021,846)     ($4,600,921)
           164   103    Prepaid Expenses                       $3,000        $3,000        $3,000        $3,000          $3,000       $3,000        $3,000        $3,000        $3,000      ($33,000)       $3,000       $3,000               $0
           165   104    Other Assets                            ($500)        ($500)        ($500)        ($500)          ($500)       ($500)        ($500)        ($500)        ($500)        ($500)        ($500)       ($500)         ($6,000)
           166            Total                             ($201,495)    ($362,361)    ($432,713)    ($398,437)      ($364,208)   ($380,342)    ($514,684)    ($378,114)    ($458,997)    ($596,037)    ($432,735)   ($667,064)     ($5,187,187)

                       CASH PROVIDED BY/(USED FOR)
                        INVESTMENT ACTIVITIES
           170 443        Capital Expenditures                ($87,500)     ($42,500)     ($73,500)     ($42,500)      ($42,500)     ($45,500)     ($42,500)     ($42,500)     ($24,500)     ($24,500)     ($30,500)     ($24,500)     ($523,000)
           171 113        Investments, International                $0            $0            $0            $0             $0            $0            $0            $0            $0            $0            $0            $0             $0
           172            Organizational / Start-Up Costs           $0            $0            $0            $0             $0            $0            $0            $0            $0            $0            $0            $0             $0
           173              Total                             ($87,500)     ($42,500)     ($73,500)     ($42,500)      ($42,500)     ($45,500)     ($42,500)     ($42,500)     ($24,500)     ($24,500)     ($30,500)     ($24,500)     ($523,000)

                       CASH PROVIDED BY/(USED FOR)
                        FINANCING ACTIVITIES
           177            Equity Additions - Committed             $0            $0            $0            $0             $0             $0            $0            $0            $0            $0            $0            $0             $0
           178            Equity Additions - New Money             $0            $0            $0            $0             $0             $0            $0            $0            $0            $0            $0            $0             $0
           179            Financing Receivable                     $0            $0            $0            $0             $0             $0            $0            $0            $0            $0            $0            $0             $0
           180            Lease/Debt Additions                     $0            $0            $0            $0             $0             $0            $0            $0            $0            $0            $0            $0             $0
           181            Lease/Debt Retirements                ($502)        ($510)        ($518)        ($527)         ($535)       ($2,487)           $0            $0            $0            $0            $0            $0        ($5,079)
           182              Total                               ($502)        ($510)        ($518)        ($527)         ($535)       ($2,487)           $0            $0            $0            $0            $0            $0        ($5,079)

           184         ENDING CASH BALANCE                  $1,350,633    $1,551,238    $1,896,857    $2,483,517     $3,290,316    $4,186,048    $4,623,913    $5,300,955    $6,072,905    $6,877,658    $7,978,987    $8,924,966     $8,924,966


A = This Row #   B = Row # of driver                                                                                                                                                                                                       Page 3
Acme Company
                                                                                                    Incremental Installations


             A    B                                           Jan         Feb         Mar         Apr         May           Jun          Jul         Aug         Sep         Oct         Nov         Dec         Year
                       Vending, Cold Drink
           245          Network 1                       20%       600         700         800         900        1,000           1,100     1,200       1,300       1,400       1,500       1,600       1,700       13,800
           246          Network 2                        5%       150         175         200         225          250             275       300         325         350         375         400         425        3,450
           247          Network 3                       75%     2,250       2,625       3,000       3,375        3,750           4,125     4,500       4,875       5,250       5,625       6,000       6,375       51,750
           248            Sub-Total                             3,000       3,500       4,000       4,500        5,000           5,500     6,000       6,500       7,000       7,500       8,000       8,500       69,000
                       Vending, Snack Food
           250          Network 1                       20%       200         200         300         300          300             300       300         400         400         400         400         400        3,900
           251          Network 2                        5%        50          50          75          75           75              75        75         100         100         100         100         100          975
           252          Network 3                       75%       750         750       1,125       1,125        1,125           1,125     1,125       1,500       1,500       1,500       1,500       1,500       14,625
           253            Sub-Total                             1,000       1,000       1,500       1,500        1,500           1,500     1,500       2,000       2,000       2,000       2,000       2,000       19,500
                       Vending, Other
           255          Network 1                       20%          40          40          60          60         100           100          100         100         100         100         100         100      1,000
           256          Network 2                        5%          10          10          15          15          25            25           25          25          25          25          25          25        250
           257          Network 3                       75%         150         150         225         225         375           375          375         375         375         375         375         375      3,750
           258            Sub-Total                                 200         200         300         300         500           500          500         500         500         500         500         500      5,000
                       Overnight Courier
           260          Network 1                       15%       180         180         180         180          180             180       180         180         180         180         225         225        2,250
           261          Network 2                        5%        60          60          60          60           60              60        60          60          60          60          75          75          750
           262          Network 3                       80%       960         960         960         960          960             960       960         960         960         960       1,200       1,200       12,000
           263            Sub-Total                             1,200       1,200       1,200       1,200        1,200           1,200     1,200       1,200       1,200       1,200       1,500       1,500       15,000
                       Distribution
           265           Network 1                      15%          60          60          60          60          60            60           60          60          60          60          75          75        750
           266           Network 2                       5%          20          20          20          20          20            20           20          20          20          20          25          25        250
           267           Network 3                      80%         320         320         320         320         320           320          320         320         320         320         400         400      4,000
           268             Sub-Total                                400         400         400         400         400           400          400         400         400         400         500         500      5,000
                       Railroad, Utility, Alarm, etc.
           270          Network 1                       15%       240         285         330         375          435             495       555         615         675         735         795         855        6,390
           271          Network 2                        5%        80          95         110         125          145             165       185         205         225         245         265         285        2,130
           272          Network 3                       80%     1,280       1,520       1,760       2,000        2,320           2,640     2,960       3,280       3,600       3,920       4,240       4,560       34,080
           273             Sub-Total                            1,600       1,900       2,200       2,500        2,900           3,300     3,700       4,100       4,500       4,900       5,300       5,700       42,600
           274         International                                800         800         800     1,000        1,000           1,000     1,500       1,500       1,500       2,000       2,000       2,000       15,900
           275         Other                                          0           0           0           0           0             0            0           0           0           0           0           0          0
           276           TOTAL NEW INSTALLATIONS                8,200       9,000      10,400      11,400       12,500          13,400    14,800      16,200      17,100      18,500      19,800      20,700      172,000


A = This Row #   B = Row # of driver                                                                                                                                                                                Page 4
Acme Company
                                                                                         Cumulative Installs by Industry


             A    B                                        Jan       Feb       Mar       Apr          May           Jun        Jul       Aug       Sep       Oct       Nov       Dec        Year
                       Vending, Cold Drink
           284 245      Network 1                           10,705    11,405    12,205    13,105        14,105        15,205    16,405    17,705    19,105    20,605    22,205    23,905        23,905
           285 246      Network 2                            8,300     8,475     8,675     8,900         9,150         9,425     9,725    10,050    10,400    10,775    11,175    11,600        11,600
           286 247      Network 3                           13,000    15,625    18,625    22,000        25,750        29,875    34,375    39,250    44,500    50,125    56,125    62,500        62,500
           287            Sub-Total                         32,005    35,505    39,505    44,005        49,005        54,505    60,505    67,005    74,005    81,505    89,505    98,005        98,005
           288              Market Size                                                                                                                                                      2,947,118
           289              Market Penetration                                                                                                                                                   3.3%
                       Vending, Snack Food
           291 250      Network 1                            2,800     3,000     3,300     3,600         3,900         4,200     4,500     4,900     5,300     5,700     6,100     6,500         6,500
           292 251      Network 2                              700       750       825       900           975         1,050     1,125     1,225     1,325     1,425     1,525     1,625         1,625
           293 252      Network 3                            4,500     5,250     6,375     7,500         8,625         9,750    10,875    12,375    13,875    15,375    16,875    18,375        18,375
           294            Sub-Total                          8,000     9,000    10,500    12,000        13,500        15,000    16,500    18,500    20,500    22,500    24,500    26,500        26,500
           295              Market Size                                                                                                                                                      1,077,443
           296              Market Penetration                                                                                                                                                   2.5%
                       Vending, Other
           298 255      Network 1                              440       480       540       600           700           800       900     1,000     1,100     1,200     1,300     1,400         1,400
           299 256      Network 2                              110       120       135       150           175           200       225       250       275       300       325       350           350
           300 257      Network 3                              650       800     1,025     1,250         1,625         2,000     2,375     2,750     3,125     3,500     3,875     4,250         4,250
           301            Sub-Total                          1,200     1,400     1,700     2,000         2,500         3,000     3,500     4,000     4,500     5,000     5,500     6,000         6,000
           302              Market Size                                                                                                                                                      1,331,361
           303              Market Penetration                                                                                                                                                   0.5%
                       Overnight Courier
           305 260      Network 1                            9,032     9,212     9,392     9,572         9,752         9,932    10,112    10,292    10,472    10,652    10,877    11,102       11,102
           306 261      Network 2                            1,193     1,253     1,313     1,373         1,433         1,493     1,553     1,613     1,673     1,733     1,808     1,883        1,883
           307 262      Network 3                            9,020     9,980    10,940    11,900        12,860        13,820    14,780    15,740    16,700    17,660    18,860    20,060       20,060
           308            Sub-Total                         19,245    20,445    21,645    22,845        24,045        25,245    26,445    27,645    28,845    30,045    31,545    33,045       33,045
           309              Market Size                                                                                                                                                       165,000
           310              Market Penetration                                                                                                                                                 20.0%
                       Distribution
           312 265       Network 1                           1,780     1,840     1,900     1,960         2,020         2,080     2,140     2,200     2,260     2,320     2,395     2,470         2,470
           313 266       Network 2                             145       165       185       205           225           245       265       285       305       325       350       375           375
           314 267       Network 3                           1,445     1,765     2,085     2,405         2,725         3,045     3,365     3,685     4,005     4,325     4,725     5,125         5,125
           315             Sub-Total                         3,370     3,770     4,170     4,570         4,970         5,370     5,770     6,170     6,570     6,970     7,470     7,970         7,970
                              Market Size
                              Market Penetration                                                                                                                                           #DIV/0!
                       Railroad, Utility, Alarm, etc.
           319 270      Network 1                            3,720     4,005     4,335     4,710         5,145         5,640     6,195     6,810     7,485     8,220     9,015     9,870         9,870
           320 271      Network 2                              936     1,031     1,141     1,266         1,411         1,576     1,761     1,966     2,191     2,436     2,701     2,986         2,986
           321 272      Network 3                            8,535    10,055    11,815    13,815        16,135        18,775    21,735    25,015    28,615    32,535    36,775    41,335        41,335
           322             Sub-Total                        13,191    15,091    17,291    19,791        22,691        25,991    29,691    33,791    38,291    43,191    48,491    54,191        54,191
           323               Market Size                                                                                                                                                   247,294,981
           324               Market Penetration                                                                                                                                                  0.0%
           325 274     International, Alternative            8,300     9,100     9,900    10,900        11,900        12,900    14,400    15,900    17,400    19,400    21,400    23,400       23,400
           326 275     Other, Alternative                        0         0         0         0             0             0         0         0         0         0         0         0             0
           327                    Total - All Industries    85,311    94,311   104,711   116,111       128,611       142,011   156,811   173,011   190,111   208,611   228,411   249,111      249,111


A = This Row #   B = Row # of driver                                                                                                                                                            Page 5
Acme Company
                                                                                            Cumulative Installs by Network


             A    B                                       Jan        Feb        Mar         Apr         May           Jun          Jul         Aug         Sep         Oct         Nov         Dec         Year
                        Network 1
           335   245     Vending, Cold Drink               10,705     11,405     12,205      13,105        14,105       15,205      16,405      17,705      19,105      20,605      22,205      23,905       23,905
           336   250     Vending, Snack Food                2,800      3,000      3,300       3,600         3,900        4,200       4,500       4,900       5,300       5,700       6,100       6,500        6,500
           337   255     Vending, Other                       440        480        540         600           700          800         900       1,000       1,100       1,200       1,300       1,400        1,400
           338   260     Overnight Courier                  9,032      9,212      9,392       9,572         9,752        9,932      10,112      10,292      10,472      10,652      10,877      11,102       11,102
           339   265     Distribution                       1,780      1,840      1,900       1,960         2,020        2,080       2,140       2,200       2,260       2,320       2,395       2,470        2,470
           340   270     Railroad, Utility, Alarm, etc.     3,720      4,005      4,335       4,710         5,145        5,640       6,195       6,810       7,485       8,220       9,015       9,870        9,870
           341             Sub-Total                       28,477     29,942     31,672      33,547        35,622       37,857      40,252      42,907      45,722      48,697      51,892      55,247       55,247
                        Network 2
           343   246     Vending, Cold Drink                8,300      8,475      8,675       8,900         9,150        9,425       9,725      10,050      10,400      10,775      11,175      11,600       11,600
           344   251     Vending, Snack Food                  700        750        825         900           975        1,050       1,125       1,225       1,325       1,425       1,525       1,625        1,625
           345   256     Vending, Other                       110        120        135         150           175          200         225         250         275         300         325         350          350
           346   261     Overnight Courier                  1,193      1,253      1,313       1,373         1,433        1,493       1,553       1,613       1,673       1,733       1,808       1,883        1,883
           347   266     Distribution                         145        165        185         205           225          245         265         285         305         325         350         375          375
           348   271     Railroad, Utility, Alarm, etc.       936      1,031      1,141       1,266         1,411        1,576       1,761       1,966       2,191       2,436       2,701       2,986        2,986
           349             Sub-Total                       11,384     11,794     12,274      12,794        13,369       13,989      14,654      15,389      16,169      16,994      17,884      18,819       18,819
                        Network 3
           351   247     Vending, Cold Drink               13,000     15,625     18,625      22,000        25,750       29,875      34,375      39,250      44,500      50,125      56,125      62,500       62,500
           352   252     Vending, Snack Food                4,500      5,250      6,375       7,500         8,625        9,750      10,875      12,375      13,875      15,375      16,875      18,375       18,375
           353   257     Vending, Other                       650        800      1,025       1,250         1,625        2,000       2,375       2,750       3,125       3,500       3,875       4,250        4,250
           354   262     Overnight Courier                  9,020      9,980     10,940      11,900        12,860       13,820      14,780      15,740      16,700      17,660      18,860      20,060       20,060
           355   267     Distribution                       1,445      1,765      2,085       2,405         2,725        3,045       3,365       3,685       4,005       4,325       4,725       5,125        5,125
           356   272     Railroad, Utility, Alarm, etc.     8,535     10,055     11,815      13,815        16,135       18,775      21,735      25,015      28,615      32,535      36,775      41,335       41,335
           357   275     Other                                  0          0          0           0             0            0           0           0           0           0           0           0            0
           358             Sub-Total                       37,150     43,475     50,865      58,870        67,720       77,265      87,505      98,815     110,820     123,520     137,235     151,645      151,645
           359 274      International                       8,300      9,100      9,900      10,900        11,900       12,900      14,400      15,900      17,400      19,400      21,400      23,400       23,400
           360                     Total - All Networks    85,311     94,311    104,711     116,111       128,611      142,011     156,811     173,011     190,111     208,611     228,411     249,111      249,111


                       Transceivers/Software
           364           Incremental                             8          9          11          11          13             13          15          16          17          19          19          21          172
           365          Cumulative (1 per 1000 Devices)         85         94         105         116         129            142         157         173         190         209         228         249          249


A = This Row #   B = Row # of driver                                                                                                                                                                          Page 6
Acme Company
                                                                                                                  Revenue Projections


             A    B                                         Rate     Jan          Feb          Mar          Apr          May            Jun          Jul          Aug          Sep          Oct          Nov          Dec          Year
                       Service Revenue
           373   284     Vending, Cold Drink               $5.42    $165,185     $182,783     $203,090     $226,103     $251,825        $280,253    $311,390     $345,233     $381,785     $421,043     $463,010     $507,683     $3,739,382
           374   291     Vending, Snack Food               $9.03     $67,688      $76,713      $87,994     $101,531     $115,069        $128,606    $142,144     $157,938     $175,988     $194,038     $212,088     $230,138     $1,689,931
           375   298     Vending, Other                   $10.83          $0           $0           $0           $0           $0              $0           $0           $0           $0           $0           $0           $0            $0
           376   305     Overnight Courier                 $9.48    $176,685     $188,056     $199,428     $210,799     $222,171        $233,542    $244,914     $256,285     $267,657     $279,028     $291,821     $306,035     $2,876,421
           377   312     Distribution                      $5.42     $17,166      $19,332      $21,498      $23,664      $25,830         $27,996      $30,162      $32,328      $34,494      $36,660      $39,096      $41,804     $350,026
           378   319     Railroad, Utility, Alarm, etc.    $5.42     $67,097      $76,574      $87,674     $100,400     $115,020        $131,807    $150,759     $171,878     $195,162     $220,613     $248,229     $278,012     $1,843,223
           379   325     International                    $10.83     $85,557      $94,221     $102,885     $112,632     $123,462        $134,292    $147,830     $164,075     $180,320     $199,272     $220,932     $242,592     $1,808,069
           380   326     Other                            $10.00          $0           $0           $0           $0           $0              $0           $0           $0           $0           $0           $0           $0            $0
           381   365     Transceivers                     $45.00      $3,645       $4,028       $4,478       $4,973       $5,513          $6,098       $6,728       $7,425       $8,168       $8,978       $9,833      $10,733       $80,595
           382             Total                                    $583,022     $641,706     $707,045     $780,101     $858,888        $942,593   $1,033,925   $1,135,161   $1,243,571   $1,359,631   $1,485,008   $1,616,996   $12,387,646

                       Hardware Sales
           385   245    Vending                            $290    $1,218,000   $1,363,000   $1,682,000   $1,827,000   $2,030,000   $2,175,000     $2,320,000   $2,610,000   $2,755,000   $2,900,000   $3,045,000   $3,190,000   $27,115,000
           386   248    Vending, Monifit                   $121     $101,640     $113,740     $140,360     $152,460     $169,400     $181,500       $193,600     $217,800     $229,900     $242,000     $254,100     $266,200     $2,262,700
           387   260    Overnight Courier                  $500     $600,000     $600,000     $600,000     $600,000     $600,000     $600,000       $600,000     $600,000     $600,000     $600,000     $750,000     $750,000     $7,500,000
           388   265    Distribution                       $333     $133,000     $133,000     $133,000     $133,000     $133,000     $133,000       $133,000     $133,000     $133,000     $133,000     $166,250     $166,250     $1,662,500
           389   270    Railroad, Utility, Alarm, etc.     $290     $464,000     $551,000     $638,000     $725,000     $841,000     $957,000      $1,073,000   $1,189,000   $1,305,000   $1,421,000   $1,537,000   $1,653,000   $12,354,000
           390   275    Other                              $428            $0           $0           $0           $0           $0           $0             $0           $0           $0           $0           $0           $0            $0
           391   274    International                      $316     $252,700     $252,700     $252,700     $315,875     $315,875     $315,875       $473,813     $473,813     $473,813     $631,750     $631,750     $631,750     $5,022,413
           392   364    Transceivers                       $750        $6,000       $6,750       $8,250       $8,250       $9,750       $9,750        $11,250      $12,000      $12,750      $14,250      $14,250      $15,750     $129,000
           393          ERC                                 $33     $137,500     $137,500     $137,500     $137,500     $137,500     $137,500       $137,500     $137,500     $137,500     $137,500     $137,500     $137,500     $1,650,000
           394          Other                                              $0           $0           $0           $0           $0           $0             $0           $0           $0           $0           $0           $0            $0
           395            Total                                    $2,912,840   $3,157,690   $3,591,810   $3,899,085   $4,236,525   $4,509,625     $4,942,163   $5,373,113   $5,646,963   $6,079,500   $6,535,850   $6,810,450   $57,695,613

                       Software
           398 364       Primary License Fees             $9,500     $76,000      $85,500     $104,500     $104,500     $123,500        $123,500    $142,500     $152,000     $161,500     $180,500     $180,500     $199,500     $1,634,000
           399           Other License Fees               $5,000      $5,000       $5,000       $5,000       $5,000       $5,000          $5,000      $5,000       $5,000       $5,000       $5,000       $5,000       $5,000        $60,000
           400           Maintenance Fees                  $119      $10,115      $11,186      $12,495      $13,804      $15,351         $16,898     $18,683      $20,587      $22,610      $24,871      $27,132      $29,631      $223,363
           401             Total                                     $91,115     $101,686     $121,995     $123,304     $143,851        $145,398    $166,183     $177,587     $189,110     $210,371     $212,632     $234,131     $1,917,363

                       Installations                         25%
           404   248     Vending                           $100     $105,000     $117,500     $145,000     $157,500     $175,000        $187,500    $200,000     $225,000     $237,500     $250,000     $262,500     $275,000     $2,337,500
           405   263     Overnight Courier                 $150      $45,000      $45,000      $45,000      $45,000      $45,000         $45,000     $45,000      $45,000      $45,000      $45,000      $56,250      $56,250      $562,500
           406   272     Distribution                      $150      $15,000      $15,000      $15,000      $15,000      $15,000         $15,000     $15,000      $15,000      $15,000      $15,000      $18,750      $18,750      $187,500
           407   273     Railroad, Utility, Alarm, etc.    $150      $60,000      $71,250      $82,500      $93,750     $108,750        $123,750    $138,750     $153,750     $168,750     $183,750     $198,750     $213,750     $1,597,500
           408   274     International                     $150      $30,000      $30,000      $30,000      $37,500      $37,500         $37,500     $56,250      $56,250      $56,250      $75,000      $75,000      $75,000      $596,250
           409   275     Other                             $150           $0           $0           $0           $0           $0              $0          $0           $0           $0           $0           $0           $0             $0
           410   364     Transceivers/Software            $1,000      $8,000       $9,000      $11,000      $11,000      $13,000         $13,000     $15,000      $16,000      $17,000      $19,000      $19,000      $21,000      $172,000
           411             Total                                    $263,000     $287,750     $328,500     $359,750     $394,250        $421,750    $470,000     $511,000     $539,500     $587,750     $630,250     $659,750     $5,453,250

           413         Other                                               $0           $0           $0           $0           $0             $0           $0           $0           $0           $0           $0           $0            $0

           415         Total Revenue                               $3,849,977   $4,188,832   $4,749,350   $5,162,240   $5,633,514   $6,019,366     $6,612,270   $7,196,860   $7,619,144   $8,237,252   $8,863,740   $9,321,327   $77,453,872


A = This Row #   B = Row # of driver                                                                                                                                                                                                   Page 7
Acme Company
                                                                                                                     Assets


             A    B                                             Jan          Feb          Mar          Apr            May          Jun          Jul          Aug          Sep          Oct          Nov          Dec         Year


                       Incremental Costs

                         Network Equipment
           426            Nodes                                  $3,000       $3,000       $3,000       $3,000         $3,000       $3,000       $3,000       $3,000       $3,000       $3,000       $3,000       $3,000      $36,000
           427            Repeaters                               $500         $500         $500         $500           $500         $500         $500         $500         $500         $500         $500         $500        $6,000
           428            Network Operation Center              $50,000       $5,000       $5,000       $5,000         $5,000       $5,000       $5,000       $5,000       $5,000       $5,000       $5,000       $5,000     $105,000
           429            Test Equipment / Other                 $7,500       $7,500       $7,500       $7,500         $7,500       $7,500       $7,500       $7,500       $7,500       $7,500       $7,500       $7,500      $90,000
           430              Total Network Equip                 $61,000      $16,000      $16,000      $16,000        $16,000      $16,000      $16,000      $16,000      $16,000      $16,000      $16,000      $16,000     $237,000

                         Office Equipment
           433 586        Computers                  $4,000     $12,000      $12,000      $16,000      $12,000        $12,000       $4,000      $12,000      $12,000           $0           $0       $4,000           $0      $96,000
           434            Phone                                      $0           $0      $25,000           $0             $0           $0           $0           $0           $0           $0           $0           $0      $25,000
           435            Copier, Fax, LAN, etc.                 $1,000       $1,000       $1,000       $1,000         $1,000       $1,000       $1,000       $1,000       $1,000       $1,000       $1,000       $1,000      $12,000
           436            Other                                  $7,500       $7,500       $7,500       $7,500         $7,500       $7,500       $7,500       $7,500       $7,500       $7,500       $7,500       $7,500      $90,000
           437               Sub-Total                          $20,500      $20,500      $49,500      $20,500        $20,500      $12,500      $20,500      $20,500       $8,500       $8,500      $12,500       $8,500     $223,000

           439 586       Furniture                   $2,000      $6,000       $6,000       $8,000       $6,000         $6,000       $2,000       $6,000       $6,000            $0           $0      $2,000            $0     $48,000

           441           Leasehold Improvements                       $0           $0           $0           $0             $0     $15,000            $0           $0           $0           $0           $0           $0     $15,000

           443           Total Incremental P P & E              $87,500      $42,500      $73,500      $42,500        $42,500      $45,500      $42,500      $42,500      $24,500      $24,500      $30,500      $24,500     $523,000


                       Cumulative Costs
                        PP&E
           450   430      Network Equipment                   $1,082,017   $1,098,017   $1,114,017   $1,130,017     $1,146,017   $1,162,017   $1,178,017   $1,194,017   $1,210,017   $1,226,017   $1,242,017   $1,258,017   $1,258,017
           451   437      Office Equipment                     $919,839     $940,339     $989,839    $1,010,339     $1,030,839   $1,043,339   $1,063,839   $1,084,339   $1,092,839   $1,101,339   $1,113,839   $1,122,339   $1,122,339
           452   439      Furniture                            $263,596     $269,596     $277,596     $283,596       $289,596     $291,596     $297,596     $303,596     $303,596     $303,596     $305,596     $305,596     $305,596
           453   441      Leasehold Improvements                 $39,145      $39,145      $39,145      $39,145        $39,145      $54,145      $54,145      $54,145      $54,145      $54,145      $54,145      $54,145      $54,145
           454              Total                             $2,304,597   $2,347,097   $2,420,597   $2,463,097     $2,505,597   $2,551,097   $2,593,597   $2,636,097   $2,660,597   $2,685,097   $2,715,597   $2,740,097   $2,740,097


A = This Row #   B = Row # of driver                                                                                                                                                                                             Page 8
Acme Company
                                                                                                                             Depreciation

                                                              life in
             A    B                                          months       Jan          Feb          Mar          Apr            May           Jun          Jul          Aug          Sep          Oct          Nov          Dec         Year


                       Equipment                                  48
           463          Beginning Monthly Rate                            $42,111      $43,809      $44,570      $45,934         $46,695      $47,455      $48,049      $48,809      $49,570      $50,080      $50,590      $51,184      $42,111
           464          Increase in Monthly Rate                           $1,698        $760        $1,365        $760            $760         $594         $760         $760         $510         $510         $594         $510        $9,583
           465          Decrease in Monthly Rate                               $0           $0           $0           $0              $0           $0           $0           $0           $0           $0           $0           $0           $0
           466          Current Period Depreciation                       $43,809      $44,570      $45,934      $46,695         $47,455      $48,049      $48,809      $49,570      $50,080      $50,590      $51,184      $51,695     $578,438
           467           Accumulated Depreciation                        $963,979    $1,008,548   $1,054,482   $1,101,177     $1,148,632    $1,196,680   $1,245,489   $1,295,059   $1,345,139   $1,395,729   $1,446,913   $1,498,608   $1,498,608


                       Furniture                                  84
           470           Beginning Monthly Rate                            $3,252       $3,324       $3,395       $3,490          $3,562       $3,633       $3,657       $3,728       $3,800       $3,800       $3,800       $3,824       $3,252
           471           Increase in Monthly Rate                             $71          $71          $95          $71             $71          $24          $71          $71           $0           $0          $24           $0        $571
           472           Decrease in Monthly Rate                              $0           $0           $0           $0              $0           $0           $0           $0           $0           $0           $0           $0           $0
           473           Current Period Depreciation                       $3,324       $3,395       $3,490       $3,562          $3,633       $3,657       $3,728       $3,800       $3,800       $3,800       $3,824       $3,824      $43,837
           474           Accumulated Depreciation                         $89,867      $93,262      $96,752     $100,314        $103,947     $107,604     $111,333     $115,133     $118,933     $122,733     $126,556     $130,380     $130,380


                       Leasehold                                  60
           477           Beginning Monthly Rate                              $910         $910         $910         $910           $910         $910        $1,160       $1,160       $1,160       $1,160       $1,160       $1,160        $910
           478           Increase in Monthly Rate                              $0           $0           $0           $0             $0         $250            $0           $0           $0           $0           $0           $0        $250
           479           Decrease in Monthly Rate                              $0           $0           $0           $0             $0            $0           $0           $0           $0           $0           $0           $0           $0
           480           Current Period Depreciation                         $910         $910         $910         $910           $910        $1,160       $1,160       $1,160       $1,160       $1,160       $1,160       $1,160      $12,666
           481           Accumulated Depreciation                         $20,506      $21,415      $22,325      $23,235         $24,144      $25,304      $26,464      $27,623      $28,783      $29,943      $31,102      $32,262      $32,262


                       Total Depreciation - All Categories
           484          Beginning Monthly Rate                            $46,273      $48,042      $48,874      $50,334         $51,166      $51,998      $52,865      $53,697      $54,529      $55,039      $55,550      $56,167      $46,273
           485          Increase in Monthly rate                           $1,769        $832        $1,460        $832            $832         $868         $832         $832         $510         $510         $618         $510       $10,405
           486          Decrease in Monthly rate                               $0           $0           $0           $0              $0           $0           $0           $0           $0           $0           $0           $0           $0
           487          Current Period Depreciation                       $48,042      $48,874      $50,334      $51,166         $51,998      $52,865      $53,697      $54,529      $55,039      $55,550      $56,167      $56,678     $634,941
           488           Accumulated Depreciation                       $1,074,351   $1,123,225   $1,173,559   $1,224,725     $1,276,723    $1,329,589   $1,383,286   $1,437,815   $1,492,854   $1,548,404   $1,604,572   $1,661,250   $1,661,250


A = This Row #   B = Row # of driver                                                                                                                                                                                                        Page 9
Acme Company
                                                                                                                       Other Costs of Sale


             A    B                                                       Jan          Feb          Mar          Apr          May            Jun          Jul          Aug          Sep          Oct          Nov          Dec          Year


                       COGS
           498   245    Vending - .Network 1                     $232    $243,600     $272,600     $336,400     $365,400     $406,000     $435,000       $464,000     $522,000     $551,000     $580,000     $609,000     $638,000     $5,423,000
           499   247    Vending - Network 3                      $160    $502,425     $562,238     $693,825     $753,638     $837,375     $897,188       $957,000    $1,076,625   $1,136,438   $1,196,250   $1,256,063   $1,315,875   $11,184,938
           500   260    Overnight Courier - Network 1            $400      $96,000      $96,000      $96,000      $96,000      $96,000      $96,000        $96,000      $96,000      $96,000      $96,000    $120,000     $120,000     $1,200,000
           501   262    Overnight Courier - Network 3            $375    $360,000     $360,000     $360,000     $360,000     $360,000     $360,000       $360,000     $360,000     $360,000     $360,000     $450,000     $450,000     $4,500,000
           502   265    Distribution - Network 1                 $283      $22,610      $22,610      $22,610      $22,610      $22,610      $22,610        $22,610      $22,610      $22,610      $22,610      $28,263      $28,263     $282,625
           503   267    Distribution - Network 3                 $216      $69,160      $69,160      $69,160      $69,160      $69,160      $69,160        $69,160      $69,160      $69,160      $69,160      $86,450      $86,450     $864,500
           504   270    Railroad, Utility, Alarm, etc. - Network $232
                                                                 1         $74,240      $88,160    $102,080     $116,000     $134,560     $153,120       $171,680     $190,240     $208,800     $227,360     $245,920     $264,480     $1,976,640
           505   272    Railroad, Utility, Alarm, etc. - Netwrok $160
                                                                 3       $204,160     $242,440     $280,720     $319,000     $370,040     $421,080       $472,120     $523,160     $574,200     $625,240     $676,280     $727,320     $5,435,760
           506   274    International                            $174    $138,985     $138,985     $138,985     $173,731     $173,731     $173,731       $260,597     $260,597     $260,597     $347,463     $347,463     $347,463     $2,762,327
           507   275    Other - Network 3                        $235           $0           $0           $0           $0           $0           $0             $0           $0           $0           $0           $0           $0            $0
           508   364    Transceivers                             $500       $4,000       $4,500       $5,500       $5,500       $6,500       $6,500         $7,500       $8,000       $8,500       $9,500       $9,500      $10,500       $86,000
           509   248    Vending, Monifit                          $83      $69,720      $78,020      $96,280    $104,580     $116,200     $124,500       $132,800     $149,400     $157,700     $166,000     $174,300     $182,600     $1,552,100
           510          ERC                                       $27    $112,500     $112,500     $112,500     $112,500     $112,500     $112,500       $112,500     $112,500     $112,500     $112,500     $112,500     $112,500     $1,350,000
           511          Other Hardware                                          $0           $0           $0           $0           $0           $0             $0           $0           $0           $0           $0           $0            $0
           512          Other                                                   $0           $0           $0           $0           $0           $0             $0           $0           $0           $0           $0           $0            $0
           513            Total                                         $1,897,400   $2,047,213   $2,314,060   $2,498,119   $2,704,676   $2,871,389     $3,125,967   $3,390,292   $3,557,504   $3,812,083   $4,115,738   $4,283,450   $36,617,889

                       3rd-Party Install Costs                   25%
           516 276       Transmitters                            $60     $123,000     $135,000     $156,000     $171,000     $187,500        $201,000    $222,000     $243,000     $256,500     $277,500     $297,000     $310,500     $2,580,000
           517           Other                                                 $0           $0           $0           $0           $0              $0          $0           $0           $0           $0           $0           $0             $0
           518             Total                                         $123,000     $135,000     $156,000     $171,000     $187,500        $201,000    $222,000     $243,000     $256,500     $277,500     $297,000     $310,500     $2,580,000

                       Network Operation/Maintenance
           521 341      Netywork 1 Fee                         $2.50      $71,193      $74,855      $79,180      $83,868      $89,055         $94,643    $100,630     $107,268     $114,305     $121,743     $129,730     $138,118     $1,204,585
           522 358      Network 3 Fee                                    $113,539     $130,488     $149,744     $170,981     $194,049        $218,623    $246,326     $276,346     $307,873     $342,529     $379,545     $418,068     $2,948,110
           523          Network 2 Site Rent                               $12,000      $12,000      $12,000      $12,000      $12,000         $12,000     $12,000      $12,000      $12,000      $12,000      $12,000      $12,000      $144,000
           524          Phone                                              $4,307       $4,407       $4,507       $4,607       $4,707          $4,807      $4,907       $5,007       $5,107       $5,207       $5,307       $5,407        $58,284
           525 327      3rd-Party Maintenance                  $0.15      $12,797      $14,147      $15,707      $17,417      $19,292         $21,302     $23,522      $25,952      $28,517      $31,292      $34,262      $37,367      $281,570
           526          Other                                                  $0           $0           $0           $0           $0              $0          $0           $0           $0           $0           $0           $0             $0
           527            Total                                          $213,835     $235,897     $261,137     $288,872     $319,103        $351,374    $387,384     $426,573     $467,801     $512,770     $560,844     $610,959     $4,636,549

                       Other SG&A Costs
           530 110      Taxes                                              $1,500       $1,500       $1,500       $1,500       $1,500          $1,500      $1,500       $1,500       $1,500       $1,500       $1,500       $1,500       $18,000
           531          Insurance                                          $7,000       $7,000       $7,000       $7,000       $7,000          $7,000      $7,000       $7,000       $7,000       $7,000       $7,000       $7,000       $84,000
           532          Other                                                  $0           $0           $0           $0           $0              $0          $0           $0           $0           $0           $0           $0            $0
           533            Total                                            $8,500       $8,500       $8,500       $8,500       $8,500          $8,500      $8,500       $8,500       $8,500       $8,500       $8,500       $8,500      $102,000


A = This Row #   B = Row # of driver                                                                                                                                                                                                       Page 10
Acme Company
                                                                                                                     Summary of Staff Divisions
                                                                                                               (This page summarizes the next 6 pages)

             A    B                                                    Jan           Feb           Mar            Apr           May           Jun            Jul          Aug           Sep           Oct           Nov           Dec           Year
                       ALL STAFF DIVISIONS
           541          Headcount                                            110           113           117            120           123           124           127           130           130           130           131           131            131
           542          Salaries                                      $542,656      $555,910      $571,713       $582,991      $595,913      $598,132      $609,954      $617,219      $617,219      $617,219      $619,630      $619,630      $7,148,187
           543          Other Compensation (relocation, etc)                 $0       $50,000       $10,000             $0            $0            $0            $0       $55,000            $0            $0            $0            $0      $115,000
           544          Commissions                                     $91,366       $99,262     $112,299       $122,205      $133,178      $142,191      $156,665      $170,336      $180,262      $195,393      $210,101      $220,911      $1,834,168
           545          Employee Benefits                      18%      $97,678     $104,564      $104,708       $104,938      $107,264      $107,664      $109,792      $117,399      $111,099      $111,099      $111,533      $111,533      $1,299,274
           546          Hiring Expenses                                 $12,000       $12,000       $16,000        $12,000       $12,000        $4,000       $12,000       $12,000            $0            $0        $4,000            $0        $96,000
           547          T&E                                             $96,750     $100,750      $101,750       $102,750      $105,750      $105,750      $109,750      $111,750      $111,750      $111,750      $112,750      $112,750      $1,284,000
           548          Office Rent                                     $43,723       $44,973       $46,640        $47,890       $49,140       $49,557       $50,807       $52,151       $52,151       $52,151       $52,568       $52,568      $594,319
           549          Telephone                                       $23,400       $24,000       $24,800        $25,400       $26,000       $26,200       $26,800       $27,400       $27,400       $27,400       $27,600       $27,600      $314,000
           550          Consulting Services                             $12,250       $12,250       $12,250        $12,250       $12,250       $12,250       $12,250       $12,250       $12,250       $12,250       $12,250       $12,250      $147,000
           551          Temporary Services                               $3,000        $3,000        $3,000         $3,000        $3,000        $3,000        $3,000        $3,000        $3,000        $3,000        $3,000        $3,000        $36,000
           552          Electronic Services                              $2,300        $2,300        $2,300         $2,300        $2,300        $2,300        $2,300        $2,300        $2,300        $2,300        $2,300        $2,300        $27,600
           553          Other Services                                   $1,550        $1,550        $1,550         $1,550        $1,550        $1,550        $1,550        $1,550        $1,550        $1,550        $1,550        $1,550        $18,600
           554          Maintenance & Repairs                            $3,675        $3,675        $3,675         $3,675        $3,675        $3,675        $3,675        $3,675        $3,675        $3,675        $3,675        $3,675        $44,100
           555          Misc Parts & Materials                           $2,525        $2,525        $2,525         $2,525        $2,525        $2,525        $2,525        $2,525        $2,525        $2,525        $2,525        $2,525        $30,300
           556          Test Equipment, Expensed                          $525          $525          $525           $525          $525          $525          $525          $525          $525          $525          $525          $525          $6,300
           557          Equipment Rent                                   $2,400        $2,400        $2,400         $2,400        $2,400        $2,400        $2,400        $2,400        $2,400        $3,400        $3,400        $3,400        $31,800
           558          Seminars & Training                              $1,550        $1,550        $1,550         $1,550        $1,550        $1,550        $1,550        $1,550        $1,550        $1,550        $1,550        $1,550        $18,600
           559          Literature                                       $1,050        $1,050        $1,050         $1,050        $1,050        $1,050        $1,050        $1,050        $1,050        $1,050        $1,050        $1,050        $12,600
           560          Software                                         $3,450        $3,450        $3,450         $3,450        $3,450        $3,450        $3,450        $3,450        $3,450        $3,450        $3,450        $3,450        $41,400
           561          Durable Supplies                                 $2,000        $2,000        $2,000         $2,000        $2,000        $2,000        $2,000        $2,000        $2,000        $2,000        $2,000        $2,000        $24,000
           562          Supplies                                         $7,150        $7,345        $7,605         $7,800        $7,995        $8,060        $8,255        $8,450        $8,450        $8,450        $8,515        $8,515        $96,590
           563          Postage/Freight/Courier                          $3,200        $3,250        $3,250         $3,250        $3,300        $3,300        $3,350        $3,400        $3,400        $3,400        $3,400        $3,400        $39,900
           564          Sales Promotion                                  $1,000        $1,000        $1,000         $1,000        $1,000        $1,000        $1,000        $1,000        $1,000        $1,000        $1,000        $1,000        $12,000
           565          Sales Literature                                 $7,500        $7,500        $7,500         $7,500        $7,500        $7,500        $7,500        $7,500        $7,500        $7,500        $7,500        $7,500        $90,000
           566          Market Research                                  $5,000        $5,000        $5,000         $5,000        $5,000        $5,000        $5,000        $5,000        $5,000        $5,000        $5,000        $5,000        $60,000
           567          Public Relations                                 $8,000        $8,000        $8,000         $8,000        $8,000        $8,000        $8,000        $8,000        $8,000        $8,000        $8,000        $8,000        $96,000
           568          Company Identity                                 $7,000        $7,000        $7,000         $7,000        $7,000        $7,000        $7,000        $7,000        $7,000        $7,000        $7,000        $7,000        $84,000
           569          Advertising / Direct Mail                       $25,000       $25,000       $25,000        $25,000       $25,000       $25,000       $25,000       $25,000       $25,000       $25,000       $25,000       $25,000      $300,000
           570          Trade Shows                                      $7,000        $7,000        $7,000         $7,000        $7,000        $7,000        $7,000        $7,000        $7,000        $7,000        $7,000        $7,000        $84,000
           571          Legal                                           $15,000       $15,000       $15,000        $15,000       $15,000       $15,000       $15,000       $15,000       $15,000       $15,000       $15,000       $15,000      $180,000
           572          Accounting                                           $0            $0        $1,500             $0            $0        $1,500            $0            $0        $1,500            $0            $0     $100,000       $104,500
           573          Board Member Expenses                            $7,000        $7,000        $7,000         $7,000        $7,000        $7,000        $7,000        $7,000        $7,000        $7,000        $7,000        $7,000        $84,000
           574          Miscellaneous                                   $18,900       $19,500       $20,300        $20,900       $21,500       $21,700       $22,300       $22,900       $22,900       $22,900       $23,100       $23,100      $260,000
           575            Total                                      $1,055,598    $1,140,329    $1,139,341     $1,148,899    $1,180,816    $1,186,829    $1,228,447    $1,316,780    $1,254,906    $1,269,537    $1,292,972    $1,399,783    $14,614,237
           576           Cross Check                                 $1,055,598    $1,140,329    $1,139,341     $1,148,899    $1,180,816    $1,186,829    $1,228,447    $1,316,780    $1,254,906    $1,269,537    $1,292,972    $1,399,783    $14,614,237


                       BREAKOUT BY DIVISION
           588   669      Operations                                  $184,019      $204,919      $219,246       $215,681      $220,978      $216,978      $236,186      $239,986      $228,186      $228,186      $236,913      $232,913      $2,664,190
           589   716      Engineering - Site A                        $143,620      $143,620      $143,620       $143,620      $143,620      $143,620      $143,620      $143,620      $143,620      $143,620      $143,620      $143,620      $1,723,436
           590   749      Engineering - Site B                          $93,921       $93,921       $93,921        $93,921       $93,921       $93,921       $93,921       $94,015       $94,015       $94,015       $94,015       $94,015     $1,127,522
           591   789      Marketing & Sales - Domestic                $297,530      $348,102      $327,380       $335,098      $361,893      $366,581      $389,347      $438,206      $414,145      $424,969      $439,027      $449,188      $4,591,466
           592   821      Marketing & Sales - International             $67,388       $63,648       $63,908        $66,095       $66,420       $66,745       $71,889       $72,377       $72,864       $78,171       $78,821       $79,470      $847,797
           593   856      Administration                              $269,120      $286,120      $291,267       $294,485      $293,985      $298,984      $293,484      $328,576      $302,076      $300,576      $300,576      $400,576      $3,659,826
           594                Total                                  $1,055,598    $1,140,329    $1,139,341     $1,148,899    $1,180,816    $1,186,829    $1,228,447    $1,316,780    $1,254,906    $1,269,537    $1,292,972    $1,399,783    $14,614,237


A = This Row #   B = Row # of driver                                                                                                                                                                                                               Page 11
Acme Company
                                                                                                                       Operations


             A    B                                                      Jan        Feb        Mar        Apr            May        Jun         Jul        Aug         Sep         Oct        Nov        Dec         Year


                       OPERATIONS

           646 873      Headcount                                              29         31         32         33             34         34          36         36          36          36         37         37           37
           647   934    Salaries                                        $100,467    $108,209   $112,147   $117,531      $120,425    $120,425   $126,734    $126,734   $126,734    $126,734    $129,145   $129,145   $1,444,428
           648          Other Compensation (relocation, etc)                  $0          $0    $10,000         $0            $0          $0         $0     $10,000         $0          $0          $0         $0      $20,000
           649   647    Employee Benefits                         18%    $18,084     $19,478    $21,986    $21,156       $21,676     $21,676    $22,812     $24,612    $22,812     $22,812     $23,246    $23,246    $263,597
           650   646    Hiring Expenses                        $4,000         $0      $8,000     $4,000     $4,000        $4,000          $0     $8,000          $0         $0          $0      $4,000         $0      $32,000
           651   646    T&E                                    $1,000    $29,000     $31,000    $32,000    $33,000       $34,000     $34,000    $36,000     $36,000    $36,000     $36,000     $37,000    $37,000    $411,000
           652   646    Office Rent                                      $12,083     $12,917    $13,333    $13,750       $14,167     $14,167    $15,000     $15,000    $15,000     $15,000     $15,417    $15,417    $171,250
           653   646    Telephone                                         $5,800      $6,200     $6,400     $6,600        $6,800      $6,800     $7,200      $7,200     $7,200      $7,200      $7,400     $7,400      $82,200
           654          Consulting Services                               $1,250      $1,250     $1,250     $1,250        $1,250      $1,250     $1,250      $1,250     $1,250      $1,250      $1,250     $1,250      $15,000
           655          Temporary Services                                $1,500      $1,500     $1,500     $1,500        $1,500      $1,500     $1,500      $1,500     $1,500      $1,500      $1,500     $1,500      $18,000
           656          Electronic Services                                $500        $500       $500       $500          $500        $500       $500        $500       $500        $500        $500       $500        $6,000
           657          Other Services                                     $400        $400       $400       $400          $400        $400       $400        $400       $400        $400        $400       $400        $4,800
           658          Maintenance & Repairs                             $3,000      $3,000     $3,000     $3,000        $3,000      $3,000     $3,000      $3,000     $3,000      $3,000      $3,000     $3,000      $36,000
           659          Misc Parts & Materials                             $600        $600       $600       $600          $600        $600       $600        $600       $600        $600        $600       $600        $7,200
           660          Test Equipment                                     $250        $250       $250       $250          $250        $250       $250        $250       $250        $250        $250       $250        $3,000
           661          Equipment Rent                                     $750        $750       $750       $750          $750        $750       $750        $750       $750        $750        $750       $750        $9,000
           662          Seminars & Training                                $300        $300       $300       $300          $300        $300       $300        $300       $300        $300        $300       $300        $3,600
           663          Literature                                         $100        $100       $100       $100          $100        $100       $100        $100       $100        $100        $100       $100        $1,200
           664          Software                                           $750        $750       $750       $750          $750        $750       $750        $750       $750        $750        $750       $750        $9,000
           665          Durable Supplies                                   $500        $500       $500       $500          $500        $500       $500        $500       $500        $500        $500       $500        $6,000
           666   646    Supplies                                 $65      $1,885      $2,015     $2,080     $2,145        $2,210      $2,210     $2,340      $2,340     $2,340      $2,340      $2,405     $2,405      $26,715
           667   646    Postage/Freight/Courier                           $1,000      $1,000     $1,000     $1,000        $1,000      $1,000     $1,000      $1,000     $1,000      $1,000      $1,000     $1,000      $12,000
           668   646    Miscellaneous                           $200      $5,800      $6,200     $6,400     $6,600        $6,800      $6,800     $7,200      $7,200     $7,200      $7,200      $7,400     $7,400      $82,200
           669            Total                                         $184,019    $204,919   $219,246   $215,681      $220,978    $216,978   $236,186    $239,986   $228,186    $228,186    $236,913   $232,913   $2,664,190


A = This Row #   B = Row # of driver                                                                                                                                                                                    Page 12
Acme Company
                                                                                                                Engineering - Site 1


             A    B                                                      Jan        Feb        Mar        Apr          May             Jun         Jul        Aug         Sep         Oct        Nov        Dec         Year


                       ENGINEERING - Site A

           679 884      Headcount                                              19         19         19         19            19             19          19         19          19          19         19         19           19
           680   945    Salaries                                        $100,672    $100,672   $100,672   $100,672    $100,672         $100,672   $100,672    $100,672   $100,672    $100,672    $100,672   $100,672   $1,208,064
           681          Other Compensation (relocation, etc)                  $0          $0         $0         $0          $0               $0         $0          $0         $0          $0          $0         $0           $0
           682   680    Employee Benefits                         18%    $18,121     $18,121    $18,121    $18,121     $18,121          $18,121    $18,121     $18,121    $18,121     $18,121     $18,121    $18,121    $217,452
           683   679    Hiring Expenses                        $4,000         $0          $0         $0         $0          $0               $0         $0          $0         $0          $0          $0         $0           $0
           684          T&E                                     $250      $4,750      $4,750     $4,750     $4,750      $4,750           $4,750     $4,750      $4,750     $4,750      $4,750      $4,750     $4,750      $57,000
           685   679    Office Rent                                       $7,917      $7,917     $7,917     $7,917      $7,917           $7,917     $7,917      $7,917     $7,917      $7,917      $7,917     $7,917      $95,000
           686   679    Telephone                               $200      $3,800      $3,800     $3,800     $3,800      $3,800           $3,800     $3,800      $3,800     $3,800      $3,800      $3,800     $3,800      $45,600
           687          Consulting Services                               $1,000      $1,000     $1,000     $1,000      $1,000           $1,000     $1,000      $1,000     $1,000      $1,000      $1,000     $1,000      $12,000
           688          Consulting Services - Alternative                     $0          $0         $0         $0          $0               $0         $0          $0         $0          $0          $0         $0           $0
           691          Consulting Services - Misc                            $0          $0         $0         $0          $0               $0         $0          $0         $0          $0          $0         $0           $0
           702          Temporary Services                                    $0          $0         $0         $0          $0               $0         $0          $0         $0          $0          $0         $0           $0
           703          Electronic Services                                $300        $300       $300       $300        $300             $300       $300        $300       $300        $300        $300       $300        $3,600
           704          Other Services                                     $300        $300       $300       $300        $300             $300       $300        $300       $300        $300        $300       $300        $3,600
           705          Maintenance & Repairs                              $250        $250       $250       $250        $250             $250       $250        $250       $250        $250        $250       $250        $3,000
           706          Misc Parts & Materials                             $750        $750       $750       $750        $750             $750       $750        $750       $750        $750        $750       $750        $9,000
           707          Test Equipment                                     $125        $125       $125       $125        $125             $125       $125        $125       $125        $125        $125       $125        $1,500
           708          Equipment Rent                                     $100        $100       $100       $100        $100             $100       $100        $100       $100        $100        $100       $100        $1,200
           709          Seminars & Training                                $350        $350       $350       $350        $350             $350       $350        $350       $350        $350        $350       $350        $4,200
           710          Literature                                         $300        $300       $300       $300        $300             $300       $300        $300       $300        $300        $300       $300        $3,600
           711          Software                                          $1,200      $1,200     $1,200     $1,200      $1,200           $1,200     $1,200      $1,200     $1,200      $1,200      $1,200     $1,200      $14,400
           712          Durable Supplies                                   $300        $300       $300       $300        $300             $300       $300        $300       $300        $300        $300       $300        $3,600
           713   679    Supplies                                 $65      $1,235      $1,235     $1,235     $1,235      $1,235           $1,235     $1,235      $1,235     $1,235      $1,235      $1,235     $1,235      $14,820
           714   679    Postage/Freight/Courier                            $250        $250       $250       $250        $250             $250       $250        $250       $250        $250        $250       $250        $3,000
           715   679    Miscellaneous                           $100      $1,900      $1,900     $1,900     $1,900      $1,900           $1,900     $1,900      $1,900     $1,900      $1,900      $1,900     $1,900      $22,800
           716            Total Costs                                   $143,620    $143,620   $143,620   $143,620    $143,620         $143,620   $143,620    $143,620   $143,620    $143,620    $143,620   $143,620   $1,723,436


A = This Row #   B = Row # of driver                                                                                                                                                                                       Page 13
Acme Company Financial Model

Weitere ähnliche Inhalte

Was ist angesagt?

Asta data spots_howmanytravelagents&agenciesarethere_slideshow
Asta data spots_howmanytravelagents&agenciesarethere_slideshowAsta data spots_howmanytravelagents&agenciesarethere_slideshow
Asta data spots_howmanytravelagents&agenciesarethere_slideshowAmerican Society of Travel Agents
 
bed bath&beyond 2003ar
bed bath&beyond 2003arbed bath&beyond 2003ar
bed bath&beyond 2003arfinance44
 
3q07_Supplement
3q07_Supplement3q07_Supplement
3q07_Supplementfinance27
 
coventry health care annual reports 2007
coventry health care annual reports 2007coventry health care annual reports 2007
coventry health care annual reports 2007finance27
 
South Carolina Tax Tables
South Carolina Tax TablesSouth Carolina Tax Tables
South Carolina Tax Tablestaxman taxman
 
DTE_4Q05supplemental
DTE_4Q05supplementalDTE_4Q05supplemental
DTE_4Q05supplementalfinance41
 
alltel 3Q06_InvestorSupplementa
alltel  3Q06_InvestorSupplementaalltel  3Q06_InvestorSupplementa
alltel 3Q06_InvestorSupplementafinance27
 
bed bath&beyond 2004ar
bed bath&beyond 2004arbed bath&beyond 2004ar
bed bath&beyond 2004arfinance44
 
alltel 2q 07_Supplement
alltel  2q 07_Supplementalltel  2q 07_Supplement
alltel 2q 07_Supplementfinance27
 
BBB2005Annual
BBB2005AnnualBBB2005Annual
BBB2005Annualfinance44
 
alltel 4q05supplement
alltel  4q05supplementalltel  4q05supplement
alltel 4q05supplementfinance27
 
Conta minjangos
Conta minjangosConta minjangos
Conta minjangosDaucus
 
alltel 2Q06_Supplement
alltel  2Q06_Supplementalltel  2Q06_Supplement
alltel 2Q06_Supplementfinance27
 

Was ist angesagt? (15)

Asta data spots_howmanytravelagents&agenciesarethere_slideshow
Asta data spots_howmanytravelagents&agenciesarethere_slideshowAsta data spots_howmanytravelagents&agenciesarethere_slideshow
Asta data spots_howmanytravelagents&agenciesarethere_slideshow
 
bed bath&beyond 2003ar
bed bath&beyond 2003arbed bath&beyond 2003ar
bed bath&beyond 2003ar
 
3q07_Supplement
3q07_Supplement3q07_Supplement
3q07_Supplement
 
coventry health care annual reports 2007
coventry health care annual reports 2007coventry health care annual reports 2007
coventry health care annual reports 2007
 
South Carolina Tax Tables
South Carolina Tax TablesSouth Carolina Tax Tables
South Carolina Tax Tables
 
DTE_4Q05supplemental
DTE_4Q05supplementalDTE_4Q05supplemental
DTE_4Q05supplemental
 
alltel 3Q06_InvestorSupplementa
alltel  3Q06_InvestorSupplementaalltel  3Q06_InvestorSupplementa
alltel 3Q06_InvestorSupplementa
 
bed bath&beyond 2004ar
bed bath&beyond 2004arbed bath&beyond 2004ar
bed bath&beyond 2004ar
 
alltel 2q 07_Supplement
alltel  2q 07_Supplementalltel  2q 07_Supplement
alltel 2q 07_Supplement
 
BBB2005Annual
BBB2005AnnualBBB2005Annual
BBB2005Annual
 
Anexo 1
Anexo 1Anexo 1
Anexo 1
 
alltel 4q05supplement
alltel  4q05supplementalltel  4q05supplement
alltel 4q05supplement
 
Conta minjangos
Conta minjangosConta minjangos
Conta minjangos
 
Toll_23Year
Toll_23YearToll_23Year
Toll_23Year
 
alltel 2Q06_Supplement
alltel  2Q06_Supplementalltel  2Q06_Supplement
alltel 2Q06_Supplement
 

Andere mochten auch

Bob Gmeindl - Acme Corporation Demo - 2016
Bob Gmeindl - Acme Corporation Demo - 2016Bob Gmeindl - Acme Corporation Demo - 2016
Bob Gmeindl - Acme Corporation Demo - 2016Bob Gmeindl
 
Managerial accounting term project workbook
Managerial accounting term project workbookManagerial accounting term project workbook
Managerial accounting term project workbookJesse Cadena
 
AIOU Old Paper Production and Operations Management (8509) Spring 2015
AIOU Old Paper Production and Operations Management (8509) Spring 2015AIOU Old Paper Production and Operations Management (8509) Spring 2015
AIOU Old Paper Production and Operations Management (8509) Spring 2015waQas ilYas
 
Objective questions and answers of financial management
Objective questions and answers of financial managementObjective questions and answers of financial management
Objective questions and answers of financial managementVineet Saini
 
financial_management_solved_problems
financial_management_solved_problemsfinancial_management_solved_problems
financial_management_solved_problemsEkta Doger
 
VENTURE CAPITAL FUND Financial Model
VENTURE CAPITAL FUND Financial ModelVENTURE CAPITAL FUND Financial Model
VENTURE CAPITAL FUND Financial ModelManuel Lacarte
 
The Near Future of CSS
The Near Future of CSSThe Near Future of CSS
The Near Future of CSSRachel Andrew
 
Classroom Management Tips for Kids and Adolescents
Classroom Management Tips for Kids and AdolescentsClassroom Management Tips for Kids and Adolescents
Classroom Management Tips for Kids and AdolescentsShelly Sanchez Terrell
 
The Buyer's Journey - by Chris Lema
The Buyer's Journey - by Chris LemaThe Buyer's Journey - by Chris Lema
The Buyer's Journey - by Chris LemaChris Lema
 

Andere mochten auch (9)

Bob Gmeindl - Acme Corporation Demo - 2016
Bob Gmeindl - Acme Corporation Demo - 2016Bob Gmeindl - Acme Corporation Demo - 2016
Bob Gmeindl - Acme Corporation Demo - 2016
 
Managerial accounting term project workbook
Managerial accounting term project workbookManagerial accounting term project workbook
Managerial accounting term project workbook
 
AIOU Old Paper Production and Operations Management (8509) Spring 2015
AIOU Old Paper Production and Operations Management (8509) Spring 2015AIOU Old Paper Production and Operations Management (8509) Spring 2015
AIOU Old Paper Production and Operations Management (8509) Spring 2015
 
Objective questions and answers of financial management
Objective questions and answers of financial managementObjective questions and answers of financial management
Objective questions and answers of financial management
 
financial_management_solved_problems
financial_management_solved_problemsfinancial_management_solved_problems
financial_management_solved_problems
 
VENTURE CAPITAL FUND Financial Model
VENTURE CAPITAL FUND Financial ModelVENTURE CAPITAL FUND Financial Model
VENTURE CAPITAL FUND Financial Model
 
The Near Future of CSS
The Near Future of CSSThe Near Future of CSS
The Near Future of CSS
 
Classroom Management Tips for Kids and Adolescents
Classroom Management Tips for Kids and AdolescentsClassroom Management Tips for Kids and Adolescents
Classroom Management Tips for Kids and Adolescents
 
The Buyer's Journey - by Chris Lema
The Buyer's Journey - by Chris LemaThe Buyer's Journey - by Chris Lema
The Buyer's Journey - by Chris Lema
 

Ähnlich wie Acme Company Financial Model

Financial Forecasting
Financial ForecastingFinancial Forecasting
Financial ForecastingJamariHodges1
 
Digital everywhere 2% growth with debt
Digital everywhere 2% growth with debtDigital everywhere 2% growth with debt
Digital everywhere 2% growth with debtBea Morales
 
Campus clothiers semmiannual financial projection
Campus clothiers semmiannual financial projectionCampus clothiers semmiannual financial projection
Campus clothiers semmiannual financial projectionbrittneytaylor
 
Financial Forecasting
Financial ForecastingFinancial Forecasting
Financial ForecastingTravonnLee
 
Copy Tested Of Imc09 Payback Analysis Jc 072209
Copy Tested  Of Imc09 Payback Analysis Jc 072209Copy Tested  Of Imc09 Payback Analysis Jc 072209
Copy Tested Of Imc09 Payback Analysis Jc 072209ccaywood
 
年金終值計算
年金終值計算年金終值計算
年金終值計算5045033
 
CalculationsLost Profit and Royalty Calculations2010201120122013Un.docx
CalculationsLost Profit and Royalty Calculations2010201120122013Un.docxCalculationsLost Profit and Royalty Calculations2010201120122013Un.docx
CalculationsLost Profit and Royalty Calculations2010201120122013Un.docxhumphrieskalyn
 
BBB2005Annual
BBB2005AnnualBBB2005Annual
BBB2005Annualfinance44
 
2021-2022 School Year Self-Organized.pdf
2021-2022 School Year Self-Organized.pdf2021-2022 School Year Self-Organized.pdf
2021-2022 School Year Self-Organized.pdfAshleyRados
 
39348363 google-earnings-slides-q3-2010
39348363 google-earnings-slides-q3-201039348363 google-earnings-slides-q3-2010
39348363 google-earnings-slides-q3-2010Pranav Bhatnagar
 
2010 q3 google_earnings_slides
2010 q3 google_earnings_slides2010 q3 google_earnings_slides
2010 q3 google_earnings_slidesrabier
 
Conta minjangos
Conta minjangosConta minjangos
Conta minjangosDaucus
 

Ähnlich wie Acme Company Financial Model (20)

Eden Grove Hotel Projections
Eden Grove Hotel ProjectionsEden Grove Hotel Projections
Eden Grove Hotel Projections
 
Financial Forecasting
Financial ForecastingFinancial Forecasting
Financial Forecasting
 
Digital everywhere 2% growth with debt
Digital everywhere 2% growth with debtDigital everywhere 2% growth with debt
Digital everywhere 2% growth with debt
 
Campus clothiers semmiannual financial projection
Campus clothiers semmiannual financial projectionCampus clothiers semmiannual financial projection
Campus clothiers semmiannual financial projection
 
3 d pie chart
3 d pie chart3 d pie chart
3 d pie chart
 
Financial Forecasting
Financial ForecastingFinancial Forecasting
Financial Forecasting
 
Dcf
DcfDcf
Dcf
 
proforma sample
proforma sampleproforma sample
proforma sample
 
Copy Tested Of Imc09 Payback Analysis Jc 072209
Copy Tested  Of Imc09 Payback Analysis Jc 072209Copy Tested  Of Imc09 Payback Analysis Jc 072209
Copy Tested Of Imc09 Payback Analysis Jc 072209
 
Estrera chap3 lab3
Estrera chap3 lab3Estrera chap3 lab3
Estrera chap3 lab3
 
Exhibits - Copy
Exhibits - CopyExhibits - Copy
Exhibits - Copy
 
Teacher Concessions
Teacher ConcessionsTeacher Concessions
Teacher Concessions
 
年金終值計算
年金終值計算年金終值計算
年金終值計算
 
CalculationsLost Profit and Royalty Calculations2010201120122013Un.docx
CalculationsLost Profit and Royalty Calculations2010201120122013Un.docxCalculationsLost Profit and Royalty Calculations2010201120122013Un.docx
CalculationsLost Profit and Royalty Calculations2010201120122013Un.docx
 
Profit blueprint
Profit blueprintProfit blueprint
Profit blueprint
 
BBB2005Annual
BBB2005AnnualBBB2005Annual
BBB2005Annual
 
2021-2022 School Year Self-Organized.pdf
2021-2022 School Year Self-Organized.pdf2021-2022 School Year Self-Organized.pdf
2021-2022 School Year Self-Organized.pdf
 
39348363 google-earnings-slides-q3-2010
39348363 google-earnings-slides-q3-201039348363 google-earnings-slides-q3-2010
39348363 google-earnings-slides-q3-2010
 
2010 q3 google_earnings_slides
2010 q3 google_earnings_slides2010 q3 google_earnings_slides
2010 q3 google_earnings_slides
 
Conta minjangos
Conta minjangosConta minjangos
Conta minjangos
 

Kürzlich hochgeladen

NO1 WorldWide Genuine vashikaran specialist Vashikaran baba near Lahore Vashi...
NO1 WorldWide Genuine vashikaran specialist Vashikaran baba near Lahore Vashi...NO1 WorldWide Genuine vashikaran specialist Vashikaran baba near Lahore Vashi...
NO1 WorldWide Genuine vashikaran specialist Vashikaran baba near Lahore Vashi...Amil baba
 
Financial Leverage Definition, Advantages, and Disadvantages
Financial Leverage Definition, Advantages, and DisadvantagesFinancial Leverage Definition, Advantages, and Disadvantages
Financial Leverage Definition, Advantages, and Disadvantagesjayjaymabutot13
 
Bladex 1Q24 Earning Results Presentation
Bladex 1Q24 Earning Results PresentationBladex 1Q24 Earning Results Presentation
Bladex 1Q24 Earning Results PresentationBladex
 
Vp Girls near me Delhi Call Now or WhatsApp
Vp Girls near me Delhi Call Now or WhatsAppVp Girls near me Delhi Call Now or WhatsApp
Vp Girls near me Delhi Call Now or WhatsAppmiss dipika
 
原版1:1复刻堪萨斯大学毕业证KU毕业证留信学历认证
原版1:1复刻堪萨斯大学毕业证KU毕业证留信学历认证原版1:1复刻堪萨斯大学毕业证KU毕业证留信学历认证
原版1:1复刻堪萨斯大学毕业证KU毕业证留信学历认证jdkhjh
 
Stock Market Brief Deck FOR 4/17 video.pdf
Stock Market Brief Deck FOR 4/17 video.pdfStock Market Brief Deck FOR 4/17 video.pdf
Stock Market Brief Deck FOR 4/17 video.pdfMichael Silva
 
NO1 Certified Amil Baba In Lahore Kala Jadu In Lahore Best Amil In Lahore Ami...
NO1 Certified Amil Baba In Lahore Kala Jadu In Lahore Best Amil In Lahore Ami...NO1 Certified Amil Baba In Lahore Kala Jadu In Lahore Best Amil In Lahore Ami...
NO1 Certified Amil Baba In Lahore Kala Jadu In Lahore Best Amil In Lahore Ami...Amil baba
 
letter-from-the-chair-to-the-fca-relating-to-british-steel-pensions-scheme-15...
letter-from-the-chair-to-the-fca-relating-to-british-steel-pensions-scheme-15...letter-from-the-chair-to-the-fca-relating-to-british-steel-pensions-scheme-15...
letter-from-the-chair-to-the-fca-relating-to-british-steel-pensions-scheme-15...Henry Tapper
 
Current Economic situation of Pakistan .pptx
Current Economic situation of Pakistan .pptxCurrent Economic situation of Pakistan .pptx
Current Economic situation of Pakistan .pptxuzma244191
 
Economic Risk Factor Update: April 2024 [SlideShare]
Economic Risk Factor Update: April 2024 [SlideShare]Economic Risk Factor Update: April 2024 [SlideShare]
Economic Risk Factor Update: April 2024 [SlideShare]Commonwealth
 
2024 Q1 Crypto Industry Report | CoinGecko
2024 Q1 Crypto Industry Report | CoinGecko2024 Q1 Crypto Industry Report | CoinGecko
2024 Q1 Crypto Industry Report | CoinGeckoCoinGecko
 
BPPG response - Options for Defined Benefit schemes - 19Apr24.pdf
BPPG response - Options for Defined Benefit schemes - 19Apr24.pdfBPPG response - Options for Defined Benefit schemes - 19Apr24.pdf
BPPG response - Options for Defined Benefit schemes - 19Apr24.pdfHenry Tapper
 
NO1 WorldWide Love marriage specialist baba ji Amil Baba Kala ilam powerful v...
NO1 WorldWide Love marriage specialist baba ji Amil Baba Kala ilam powerful v...NO1 WorldWide Love marriage specialist baba ji Amil Baba Kala ilam powerful v...
NO1 WorldWide Love marriage specialist baba ji Amil Baba Kala ilam powerful v...Amil baba
 
212MTAMount Durham University Bachelor's Diploma in Technology
212MTAMount Durham University Bachelor's Diploma in Technology212MTAMount Durham University Bachelor's Diploma in Technology
212MTAMount Durham University Bachelor's Diploma in Technologyz xss
 
Call Girls Near Me WhatsApp:+91-9833363713
Call Girls Near Me WhatsApp:+91-9833363713Call Girls Near Me WhatsApp:+91-9833363713
Call Girls Near Me WhatsApp:+91-9833363713Sonam Pathan
 
(办理学位证)加拿大萨省大学毕业证成绩单原版一比一
(办理学位证)加拿大萨省大学毕业证成绩单原版一比一(办理学位证)加拿大萨省大学毕业证成绩单原版一比一
(办理学位证)加拿大萨省大学毕业证成绩单原版一比一S SDS
 
Amil Baba In Pakistan amil baba in Lahore amil baba in Islamabad amil baba in...
Amil Baba In Pakistan amil baba in Lahore amil baba in Islamabad amil baba in...Amil Baba In Pakistan amil baba in Lahore amil baba in Islamabad amil baba in...
Amil Baba In Pakistan amil baba in Lahore amil baba in Islamabad amil baba in...amilabibi1
 
The Triple Threat | Article on Global Resession | Harsh Kumar
The Triple Threat | Article on Global Resession | Harsh KumarThe Triple Threat | Article on Global Resession | Harsh Kumar
The Triple Threat | Article on Global Resession | Harsh KumarHarsh Kumar
 
call girls in Nand Nagri (DELHI) 🔝 >༒9953330565🔝 genuine Escort Service 🔝✔️✔️
call girls in  Nand Nagri (DELHI) 🔝 >༒9953330565🔝 genuine Escort Service 🔝✔️✔️call girls in  Nand Nagri (DELHI) 🔝 >༒9953330565🔝 genuine Escort Service 🔝✔️✔️
call girls in Nand Nagri (DELHI) 🔝 >༒9953330565🔝 genuine Escort Service 🔝✔️✔️9953056974 Low Rate Call Girls In Saket, Delhi NCR
 
AfRESFullPaper22018EmpiricalPerformanceofRealEstateInvestmentTrustsandShareho...
AfRESFullPaper22018EmpiricalPerformanceofRealEstateInvestmentTrustsandShareho...AfRESFullPaper22018EmpiricalPerformanceofRealEstateInvestmentTrustsandShareho...
AfRESFullPaper22018EmpiricalPerformanceofRealEstateInvestmentTrustsandShareho...yordanosyohannes2
 

Kürzlich hochgeladen (20)

NO1 WorldWide Genuine vashikaran specialist Vashikaran baba near Lahore Vashi...
NO1 WorldWide Genuine vashikaran specialist Vashikaran baba near Lahore Vashi...NO1 WorldWide Genuine vashikaran specialist Vashikaran baba near Lahore Vashi...
NO1 WorldWide Genuine vashikaran specialist Vashikaran baba near Lahore Vashi...
 
Financial Leverage Definition, Advantages, and Disadvantages
Financial Leverage Definition, Advantages, and DisadvantagesFinancial Leverage Definition, Advantages, and Disadvantages
Financial Leverage Definition, Advantages, and Disadvantages
 
Bladex 1Q24 Earning Results Presentation
Bladex 1Q24 Earning Results PresentationBladex 1Q24 Earning Results Presentation
Bladex 1Q24 Earning Results Presentation
 
Vp Girls near me Delhi Call Now or WhatsApp
Vp Girls near me Delhi Call Now or WhatsAppVp Girls near me Delhi Call Now or WhatsApp
Vp Girls near me Delhi Call Now or WhatsApp
 
原版1:1复刻堪萨斯大学毕业证KU毕业证留信学历认证
原版1:1复刻堪萨斯大学毕业证KU毕业证留信学历认证原版1:1复刻堪萨斯大学毕业证KU毕业证留信学历认证
原版1:1复刻堪萨斯大学毕业证KU毕业证留信学历认证
 
Stock Market Brief Deck FOR 4/17 video.pdf
Stock Market Brief Deck FOR 4/17 video.pdfStock Market Brief Deck FOR 4/17 video.pdf
Stock Market Brief Deck FOR 4/17 video.pdf
 
NO1 Certified Amil Baba In Lahore Kala Jadu In Lahore Best Amil In Lahore Ami...
NO1 Certified Amil Baba In Lahore Kala Jadu In Lahore Best Amil In Lahore Ami...NO1 Certified Amil Baba In Lahore Kala Jadu In Lahore Best Amil In Lahore Ami...
NO1 Certified Amil Baba In Lahore Kala Jadu In Lahore Best Amil In Lahore Ami...
 
letter-from-the-chair-to-the-fca-relating-to-british-steel-pensions-scheme-15...
letter-from-the-chair-to-the-fca-relating-to-british-steel-pensions-scheme-15...letter-from-the-chair-to-the-fca-relating-to-british-steel-pensions-scheme-15...
letter-from-the-chair-to-the-fca-relating-to-british-steel-pensions-scheme-15...
 
Current Economic situation of Pakistan .pptx
Current Economic situation of Pakistan .pptxCurrent Economic situation of Pakistan .pptx
Current Economic situation of Pakistan .pptx
 
Economic Risk Factor Update: April 2024 [SlideShare]
Economic Risk Factor Update: April 2024 [SlideShare]Economic Risk Factor Update: April 2024 [SlideShare]
Economic Risk Factor Update: April 2024 [SlideShare]
 
2024 Q1 Crypto Industry Report | CoinGecko
2024 Q1 Crypto Industry Report | CoinGecko2024 Q1 Crypto Industry Report | CoinGecko
2024 Q1 Crypto Industry Report | CoinGecko
 
BPPG response - Options for Defined Benefit schemes - 19Apr24.pdf
BPPG response - Options for Defined Benefit schemes - 19Apr24.pdfBPPG response - Options for Defined Benefit schemes - 19Apr24.pdf
BPPG response - Options for Defined Benefit schemes - 19Apr24.pdf
 
NO1 WorldWide Love marriage specialist baba ji Amil Baba Kala ilam powerful v...
NO1 WorldWide Love marriage specialist baba ji Amil Baba Kala ilam powerful v...NO1 WorldWide Love marriage specialist baba ji Amil Baba Kala ilam powerful v...
NO1 WorldWide Love marriage specialist baba ji Amil Baba Kala ilam powerful v...
 
212MTAMount Durham University Bachelor's Diploma in Technology
212MTAMount Durham University Bachelor's Diploma in Technology212MTAMount Durham University Bachelor's Diploma in Technology
212MTAMount Durham University Bachelor's Diploma in Technology
 
Call Girls Near Me WhatsApp:+91-9833363713
Call Girls Near Me WhatsApp:+91-9833363713Call Girls Near Me WhatsApp:+91-9833363713
Call Girls Near Me WhatsApp:+91-9833363713
 
(办理学位证)加拿大萨省大学毕业证成绩单原版一比一
(办理学位证)加拿大萨省大学毕业证成绩单原版一比一(办理学位证)加拿大萨省大学毕业证成绩单原版一比一
(办理学位证)加拿大萨省大学毕业证成绩单原版一比一
 
Amil Baba In Pakistan amil baba in Lahore amil baba in Islamabad amil baba in...
Amil Baba In Pakistan amil baba in Lahore amil baba in Islamabad amil baba in...Amil Baba In Pakistan amil baba in Lahore amil baba in Islamabad amil baba in...
Amil Baba In Pakistan amil baba in Lahore amil baba in Islamabad amil baba in...
 
The Triple Threat | Article on Global Resession | Harsh Kumar
The Triple Threat | Article on Global Resession | Harsh KumarThe Triple Threat | Article on Global Resession | Harsh Kumar
The Triple Threat | Article on Global Resession | Harsh Kumar
 
call girls in Nand Nagri (DELHI) 🔝 >༒9953330565🔝 genuine Escort Service 🔝✔️✔️
call girls in  Nand Nagri (DELHI) 🔝 >༒9953330565🔝 genuine Escort Service 🔝✔️✔️call girls in  Nand Nagri (DELHI) 🔝 >༒9953330565🔝 genuine Escort Service 🔝✔️✔️
call girls in Nand Nagri (DELHI) 🔝 >༒9953330565🔝 genuine Escort Service 🔝✔️✔️
 
AfRESFullPaper22018EmpiricalPerformanceofRealEstateInvestmentTrustsandShareho...
AfRESFullPaper22018EmpiricalPerformanceofRealEstateInvestmentTrustsandShareho...AfRESFullPaper22018EmpiricalPerformanceofRealEstateInvestmentTrustsandShareho...
AfRESFullPaper22018EmpiricalPerformanceofRealEstateInvestmentTrustsandShareho...
 

Acme Company Financial Model

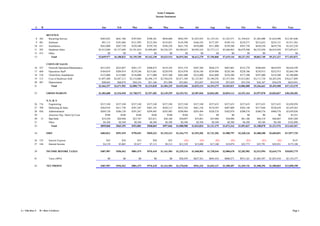
  • 1. Acme Company Income Statement A B Jan Feb Mar Apr May Jun Jul Aug Sep Oct Nov Dec Year REVENUE 8 382 Recurring Service $583,022 $641,706 $707,045 $780,101 $858,888 $942,593 $1,033,925 $1,135,161 $1,243,571 $1,359,631 $1,485,008 $1,616,996 $12,387,646 9 401 Software $91,115 $101,686 $121,995 $123,304 $143,851 $145,398 $166,183 $177,587 $189,110 $210,371 $212,632 $234,131 $1,917,363 10 411 Installation $263,000 $287,750 $328,500 $359,750 $394,250 $421,750 $470,000 $511,000 $539,500 $587,750 $630,250 $659,750 $5,453,250 11 395 Hardware Sales $2,912,840 $3,157,690 $3,591,810 $3,899,085 $4,236,525 $4,509,625 $4,942,163 $5,373,113 $5,646,963 $6,079,500 $6,535,850 $6,810,450 $57,695,613 12 413 Other $0 $0 $0 $0 $0 $0 $0 $0 $0 $0 $0 $0 $0 13 Total $3,849,977 $4,188,832 $4,749,350 $5,162,240 $5,633,514 $6,019,366 $6,612,270 $7,196,860 $7,619,144 $8,237,252 $8,863,740 $9,321,327 $77,453,872 COSTS OF SALES 16 527 Network Operation/Maintenance $213,835 $235,897 $261,137 $288,872 $319,103 $351,374 $387,384 $426,573 $467,801 $512,770 $560,844 $610,959 $4,636,549 17 669 Operations Staff $184,019 $204,919 $219,246 $215,681 $220,978 $216,978 $236,186 $239,986 $228,186 $228,186 $236,913 $232,913 $2,664,190 18 518 Third-Party Installations $123,000 $135,000 $156,000 $171,000 $187,500 $201,000 $222,000 $243,000 $256,500 $277,500 $297,000 $310,500 $2,580,000 19 513 Cost of Hardware Sold $1,897,400 $2,047,213 $2,314,060 $2,498,119 $2,704,676 $2,871,389 $3,125,967 $3,390,292 $3,557,504 $3,812,083 $4,115,738 $4,283,450 $36,617,889 20 487 Depreciation $48,042 $48,874 $50,334 $51,166 $51,998 $52,865 $53,697 $54,529 $55,039 $55,550 $56,167 $56,678 $634,941 21 Total $2,466,297 $2,671,902 $3,000,778 $3,224,838 $3,484,255 $3,693,606 $4,025,234 $4,354,379 $4,565,031 $4,886,088 $5,266,662 $5,494,500 $47,133,570 23 GROSS MARGIN $1,383,680 $1,516,930 $1,748,572 $1,937,402 $2,149,259 $2,325,761 $2,587,036 $2,842,481 $3,054,113 $3,351,164 $3,597,078 $3,826,827 $30,320,302 S, G, & A 26 716 Engineering $237,540 $237,540 $237,540 $237,540 $237,540 $237,540 $237,540 $237,635 $237,635 $237,635 $237,635 $237,635 $2,850,958 27 789 Marketing & Sales $364,918 $411,750 $391,287 $401,193 $428,313 $433,326 $461,236 $510,583 $487,009 $503,140 $517,848 $528,658 $5,439,263 28 856 Administration $269,120 $286,120 $291,267 $294,485 $293,985 $298,984 $293,484 $328,576 $302,076 $300,576 $300,576 $400,576 $3,659,826 29 Amortize Org / Start-Up Costs $540 $540 $540 $540 $540 $540 $11 $0 $0 $0 $0 $0 $3,251 30 13 Bad Debt $19,250 $20,944 $23,747 $25,811 $28,168 $30,097 $33,061 $35,984 $38,096 $41,186 $44,319 $46,607 $387,269 31 Other $8,500 $8,500 $8,500 $8,500 $8,500 $8,500 $8,500 $8,500 $8,500 $8,500 $8,500 $8,500 $102,000 32 Total $899,868 $965,395 $952,881 $968,069 $997,046 $1,008,988 $1,033,834 $1,121,279 $1,073,316 $1,091,037 $1,108,878 $1,221,976 $12,442,567 34 EBIT $483,812 $551,535 $795,691 $969,333 $1,152,213 $1,316,773 $1,553,202 $1,721,202 $1,980,797 $2,260,126 $2,488,200 $2,604,851 $17,877,735 36 125 Interest Expense $43 $38 $33 $28 $22 ($2) ($2) ($2) ($2) ($2) ($2) ($2) $147 37 146 Interest Income $4,139 $5,065 $5,817 $7,113 $9,313 $12,339 $15,698 $17,340 $19,879 $22,773 $25,791 $29,921 $175,188 39 INCOME BEFORE TAXES $487,907 $556,562 $801,475 $976,418 $1,161,504 $1,329,114 $1,568,903 $1,738,544 $2,000,678 $2,282,902 $2,513,994 $2,634,774 $18,052,775 41 Taxes (40%) $0 $0 $0 $0 $0 $58,459 $627,561 $695,418 $800,271 $913,161 $1,005,597 $1,053,910 $5,154,377 43 NET PROFIT $487,907 $556,562 $801,475 $976,418 $1,161,504 $1,270,656 $941,342 $1,043,127 $1,200,407 $1,369,741 $1,508,396 $1,580,865 $12,898,398 A = This Row # B = Row # of driver Page 1
  • 2. Acme Company Balance Sheet A B Jan Feb Mar Apr May Jun Jul Aug Sep Oct Nov Dec Year ASSETS Current 99 184 Cash / Short Term Investments $1,350,633 $1,551,238 $1,896,857 $2,483,517 $3,290,316 $4,186,048 $4,623,913 $5,300,955 $6,072,905 $6,877,658 $7,978,987 $8,924,966 $8,924,966 100 13 Receivables $2,830,256 $3,078,556 $3,497,875 $3,797,418 $4,144,939 $4,420,663 $4,859,767 $5,286,002 $5,585,618 $6,037,561 $6,487,274 $6,810,217 $6,810,217 101 Partners Notes Subscribed $0 $0 $0 $0 $0 $0 $0 $0 $0 $0 $0 $0 $0 102 513 Inventory $3,070,819 $3,471,090 $3,747,178 $4,057,014 $4,307,083 $4,688,950 $5,085,438 $5,336,257 $5,718,124 $6,173,606 $6,425,175 $7,447,021 $7,447,021 103 Prepaid Expenses $41,000 $38,000 $35,000 $32,000 $29,000 $26,000 $23,000 $20,000 $17,000 $50,000 $47,000 $44,000 $44,000 104 Other $144,027 $144,527 $145,027 $145,527 $146,027 $146,527 $147,027 $147,527 $148,027 $148,527 $149,027 $149,527 $149,527 105 Total $7,436,735 $8,283,412 $9,321,937 $10,515,476 $11,917,365 $13,468,189 $14,739,145 $16,090,740 $17,541,673 $19,287,353 $21,087,463 $23,375,730 $23,375,730 Fixed 108 454 PP&E $2,304,597 $2,347,097 $2,420,597 $2,463,097 $2,505,597 $2,551,097 $2,593,597 $2,636,097 $2,660,597 $2,685,097 $2,715,597 $2,740,097 $2,740,097 109 488 Less Accum Depreciation ($1,074,351) ($1,123,225) ($1,173,559) ($1,224,725) ($1,276,723) ($1,329,589) ($1,383,286) ($1,437,815) ($1,492,854) ($1,548,404) ($1,604,572) ($1,661,250) ($1,661,250) 110 Net $1,230,246 $1,223,872 $1,247,038 $1,238,372 $1,228,874 $1,221,508 $1,210,311 $1,198,282 $1,167,743 $1,136,693 $1,111,025 $1,078,847 $1,078,847 Other 113 Investments $0 $0 $0 $0 $0 $0 $0 $0 $0 $0 $0 $0 $0 114 172 Organizational / Start-Up Costs $2,711 $2,171 $1,631 $1,091 $551 $11 $0 $0 $0 $0 $0 $0 $0 115 Total $2,711 $2,171 $1,631 $1,091 $551 $11 $0 $0 $0 $0 $0 $0 $0 117 TOTAL ASSETS $8,669,692 $9,509,454 $10,570,606 $11,754,939 $13,146,790 $14,689,708 $15,949,456 $17,289,022 $18,709,416 $20,424,046 $22,198,488 $24,454,578 $24,454,578 LIABILITIES 121 Accounts Payable $1,749,090 $1,950,271 $2,074,003 $2,193,062 $2,311,955 $2,493,717 $2,700,995 $2,857,711 $2,979,559 $3,209,744 $3,331,177 $3,903,553 $3,903,553 122 Accounts Payable - ABC Company $515,143 $562,225 $645,270 $692,878 $758,225 $811,373 $865,920 $949,618 $1,004,715 $1,060,713 $1,145,913 $1,202,860 $1,202,860 123 Taxes/Benefits Payable $513,238 $548,685 $602,102 $643,878 $690,518 $730,359 $786,940 $842,966 $886,007 $944,714 $1,004,127 $1,050,029 $1,050,029 124 Unearned Revenue $0 $0 $0 $0 $0 $0 $0 $0 $0 $0 $0 $0 $0 125 Equipment Lease $4,328 $3,818 $3,300 $2,773 $2,238 ($249) ($249) ($249) ($249) ($249) ($249) ($249) ($249) 126 Convertible Debentures plus interest $0 $0 $0 $0 $0 $0 $0 $0 $0 $0 $0 $0 $0 127 Total $2,781,798 $3,064,999 $3,324,675 $3,532,590 $3,762,937 $4,035,199 $4,353,606 $4,650,046 $4,870,032 $5,214,921 $5,480,967 $6,156,192 $6,156,192 CAPITAL 131 Capital (Paid & Subscribed) $16,223,356 $16,223,356 $16,223,356 $16,223,356 $16,223,356 $16,223,356 $16,223,356 $16,223,356 $16,223,356 $16,223,356 $16,223,356 $16,223,356 $16,223,356 132 179 Capital Receivable $0 $0 $0 $0 $0 $0 $0 $0 $0 $0 $0 $0 $0 133 43 Capital Allocations - Prior Years ($10,823,369) ($10,823,369) ($10,823,369) ($10,823,369) ($10,823,369) ($10,823,369) ($10,823,369) ($10,823,369) ($10,823,369) ($10,823,369) ($10,823,369) ($10,823,369) ($10,823,369) 134 43 Retained Earnings - Current Year $487,907 $1,044,468 $1,845,944 $2,822,362 $3,983,866 $5,254,521 $6,195,863 $7,238,989 $8,439,396 $9,809,138 $11,317,534 $12,898,398 $12,898,398 135 Total $5,887,894 $6,444,456 $7,245,931 $8,222,349 $9,383,853 $10,654,509 $11,595,850 $12,638,977 $13,839,383 $15,209,125 $16,717,521 $18,298,386 $18,298,386 137 TOTAL LIABILITIES & CAPITAL $8,669,692 $9,509,454 $10,570,606 $11,754,939 $13,146,790 $14,689,708 $15,949,456 $17,289,022 $18,709,416 $20,424,046 $22,198,488 $24,454,578 $24,454,578 A = This Row # B = Row # of driver Page 2
  • 3. Acme Company Cash Flow A B Jan Feb Mar Apr May Jun Jul Aug Sep Oct Nov Dec Year 146 BEGINNING CASH $1,103,641 $1,350,633 $1,551,238 $1,896,857 $2,483,517 $3,290,316 $4,186,048 $4,623,913 $5,300,955 $6,072,905 $6,877,658 $7,978,987 $1,103,641 148 NET PROFIT/LOSS $487,907 $556,562 $801,475 $976,418 $1,161,504 $1,270,656 $941,342 $1,043,127 $1,200,407 $1,369,741 $1,508,396 $1,580,865 $12,898,398 NON-CASH EXPENSES 151 20 Depreciation $48,042 $48,874 $50,334 $51,166 $51,998 $52,865 $53,697 $54,529 $55,039 $55,550 $56,167 $56,678 $634,941 152 29 Amortize Org / Start-Up Costs $540 $540 $540 $540 $540 $540 $11 $0 $0 $0 $0 $0 $3,251 153 Other $0 $0 $0 $0 $0 $0 $0 $0 $0 $0 $0 $0 $0 154 Total $48,582 $49,414 $50,874 $51,706 $52,538 $53,405 $53,708 $54,529 $55,039 $55,550 $56,167 $56,678 $638,192 WORKING CAP CHANGES 157 121 Accounts Payable $293,954 $201,181 $123,732 $119,059 $118,893 $181,762 $207,278 $156,716 $121,848 $230,184 $121,433 $572,376 $2,448,416 158 122 Accounts Payable - ABC Company ($460,438) $47,083 $83,045 $47,608 $65,348 $53,148 $54,548 $83,698 $55,098 $55,998 $85,200 $56,948 $227,280 159 123 Taxes/Benefits Payable ($8,706) $35,447 $53,417 $41,776 $46,641 $39,840 $56,582 $56,025 $43,041 $58,707 $59,414 $45,901 $528,085 160 124 Unearned Revenue $0 $0 $0 $0 $0 $0 $0 $0 $0 $0 $0 $0 $0 161 126 Other Liabilities $0 $0 $0 $0 $0 $0 $0 $0 $0 $0 $0 $0 $0 162 100 Accounts Receivable $195,913 ($248,301) ($419,319) ($299,543) ($347,520) ($275,725) ($439,104) ($426,235) ($299,616) ($451,944) ($449,712) ($322,943) ($3,784,047) 163 102 Inventory ($224,719) ($400,271) ($276,088) ($309,836) ($250,069) ($381,867) ($396,488) ($250,819) ($381,867) ($455,483) ($251,569) ($1,021,846) ($4,600,921) 164 103 Prepaid Expenses $3,000 $3,000 $3,000 $3,000 $3,000 $3,000 $3,000 $3,000 $3,000 ($33,000) $3,000 $3,000 $0 165 104 Other Assets ($500) ($500) ($500) ($500) ($500) ($500) ($500) ($500) ($500) ($500) ($500) ($500) ($6,000) 166 Total ($201,495) ($362,361) ($432,713) ($398,437) ($364,208) ($380,342) ($514,684) ($378,114) ($458,997) ($596,037) ($432,735) ($667,064) ($5,187,187) CASH PROVIDED BY/(USED FOR) INVESTMENT ACTIVITIES 170 443 Capital Expenditures ($87,500) ($42,500) ($73,500) ($42,500) ($42,500) ($45,500) ($42,500) ($42,500) ($24,500) ($24,500) ($30,500) ($24,500) ($523,000) 171 113 Investments, International $0 $0 $0 $0 $0 $0 $0 $0 $0 $0 $0 $0 $0 172 Organizational / Start-Up Costs $0 $0 $0 $0 $0 $0 $0 $0 $0 $0 $0 $0 $0 173 Total ($87,500) ($42,500) ($73,500) ($42,500) ($42,500) ($45,500) ($42,500) ($42,500) ($24,500) ($24,500) ($30,500) ($24,500) ($523,000) CASH PROVIDED BY/(USED FOR) FINANCING ACTIVITIES 177 Equity Additions - Committed $0 $0 $0 $0 $0 $0 $0 $0 $0 $0 $0 $0 $0 178 Equity Additions - New Money $0 $0 $0 $0 $0 $0 $0 $0 $0 $0 $0 $0 $0 179 Financing Receivable $0 $0 $0 $0 $0 $0 $0 $0 $0 $0 $0 $0 $0 180 Lease/Debt Additions $0 $0 $0 $0 $0 $0 $0 $0 $0 $0 $0 $0 $0 181 Lease/Debt Retirements ($502) ($510) ($518) ($527) ($535) ($2,487) $0 $0 $0 $0 $0 $0 ($5,079) 182 Total ($502) ($510) ($518) ($527) ($535) ($2,487) $0 $0 $0 $0 $0 $0 ($5,079) 184 ENDING CASH BALANCE $1,350,633 $1,551,238 $1,896,857 $2,483,517 $3,290,316 $4,186,048 $4,623,913 $5,300,955 $6,072,905 $6,877,658 $7,978,987 $8,924,966 $8,924,966 A = This Row # B = Row # of driver Page 3
  • 4. Acme Company Incremental Installations A B Jan Feb Mar Apr May Jun Jul Aug Sep Oct Nov Dec Year Vending, Cold Drink 245 Network 1 20% 600 700 800 900 1,000 1,100 1,200 1,300 1,400 1,500 1,600 1,700 13,800 246 Network 2 5% 150 175 200 225 250 275 300 325 350 375 400 425 3,450 247 Network 3 75% 2,250 2,625 3,000 3,375 3,750 4,125 4,500 4,875 5,250 5,625 6,000 6,375 51,750 248 Sub-Total 3,000 3,500 4,000 4,500 5,000 5,500 6,000 6,500 7,000 7,500 8,000 8,500 69,000 Vending, Snack Food 250 Network 1 20% 200 200 300 300 300 300 300 400 400 400 400 400 3,900 251 Network 2 5% 50 50 75 75 75 75 75 100 100 100 100 100 975 252 Network 3 75% 750 750 1,125 1,125 1,125 1,125 1,125 1,500 1,500 1,500 1,500 1,500 14,625 253 Sub-Total 1,000 1,000 1,500 1,500 1,500 1,500 1,500 2,000 2,000 2,000 2,000 2,000 19,500 Vending, Other 255 Network 1 20% 40 40 60 60 100 100 100 100 100 100 100 100 1,000 256 Network 2 5% 10 10 15 15 25 25 25 25 25 25 25 25 250 257 Network 3 75% 150 150 225 225 375 375 375 375 375 375 375 375 3,750 258 Sub-Total 200 200 300 300 500 500 500 500 500 500 500 500 5,000 Overnight Courier 260 Network 1 15% 180 180 180 180 180 180 180 180 180 180 225 225 2,250 261 Network 2 5% 60 60 60 60 60 60 60 60 60 60 75 75 750 262 Network 3 80% 960 960 960 960 960 960 960 960 960 960 1,200 1,200 12,000 263 Sub-Total 1,200 1,200 1,200 1,200 1,200 1,200 1,200 1,200 1,200 1,200 1,500 1,500 15,000 Distribution 265 Network 1 15% 60 60 60 60 60 60 60 60 60 60 75 75 750 266 Network 2 5% 20 20 20 20 20 20 20 20 20 20 25 25 250 267 Network 3 80% 320 320 320 320 320 320 320 320 320 320 400 400 4,000 268 Sub-Total 400 400 400 400 400 400 400 400 400 400 500 500 5,000 Railroad, Utility, Alarm, etc. 270 Network 1 15% 240 285 330 375 435 495 555 615 675 735 795 855 6,390 271 Network 2 5% 80 95 110 125 145 165 185 205 225 245 265 285 2,130 272 Network 3 80% 1,280 1,520 1,760 2,000 2,320 2,640 2,960 3,280 3,600 3,920 4,240 4,560 34,080 273 Sub-Total 1,600 1,900 2,200 2,500 2,900 3,300 3,700 4,100 4,500 4,900 5,300 5,700 42,600 274 International 800 800 800 1,000 1,000 1,000 1,500 1,500 1,500 2,000 2,000 2,000 15,900 275 Other 0 0 0 0 0 0 0 0 0 0 0 0 0 276 TOTAL NEW INSTALLATIONS 8,200 9,000 10,400 11,400 12,500 13,400 14,800 16,200 17,100 18,500 19,800 20,700 172,000 A = This Row # B = Row # of driver Page 4
  • 5. Acme Company Cumulative Installs by Industry A B Jan Feb Mar Apr May Jun Jul Aug Sep Oct Nov Dec Year Vending, Cold Drink 284 245 Network 1 10,705 11,405 12,205 13,105 14,105 15,205 16,405 17,705 19,105 20,605 22,205 23,905 23,905 285 246 Network 2 8,300 8,475 8,675 8,900 9,150 9,425 9,725 10,050 10,400 10,775 11,175 11,600 11,600 286 247 Network 3 13,000 15,625 18,625 22,000 25,750 29,875 34,375 39,250 44,500 50,125 56,125 62,500 62,500 287 Sub-Total 32,005 35,505 39,505 44,005 49,005 54,505 60,505 67,005 74,005 81,505 89,505 98,005 98,005 288 Market Size 2,947,118 289 Market Penetration 3.3% Vending, Snack Food 291 250 Network 1 2,800 3,000 3,300 3,600 3,900 4,200 4,500 4,900 5,300 5,700 6,100 6,500 6,500 292 251 Network 2 700 750 825 900 975 1,050 1,125 1,225 1,325 1,425 1,525 1,625 1,625 293 252 Network 3 4,500 5,250 6,375 7,500 8,625 9,750 10,875 12,375 13,875 15,375 16,875 18,375 18,375 294 Sub-Total 8,000 9,000 10,500 12,000 13,500 15,000 16,500 18,500 20,500 22,500 24,500 26,500 26,500 295 Market Size 1,077,443 296 Market Penetration 2.5% Vending, Other 298 255 Network 1 440 480 540 600 700 800 900 1,000 1,100 1,200 1,300 1,400 1,400 299 256 Network 2 110 120 135 150 175 200 225 250 275 300 325 350 350 300 257 Network 3 650 800 1,025 1,250 1,625 2,000 2,375 2,750 3,125 3,500 3,875 4,250 4,250 301 Sub-Total 1,200 1,400 1,700 2,000 2,500 3,000 3,500 4,000 4,500 5,000 5,500 6,000 6,000 302 Market Size 1,331,361 303 Market Penetration 0.5% Overnight Courier 305 260 Network 1 9,032 9,212 9,392 9,572 9,752 9,932 10,112 10,292 10,472 10,652 10,877 11,102 11,102 306 261 Network 2 1,193 1,253 1,313 1,373 1,433 1,493 1,553 1,613 1,673 1,733 1,808 1,883 1,883 307 262 Network 3 9,020 9,980 10,940 11,900 12,860 13,820 14,780 15,740 16,700 17,660 18,860 20,060 20,060 308 Sub-Total 19,245 20,445 21,645 22,845 24,045 25,245 26,445 27,645 28,845 30,045 31,545 33,045 33,045 309 Market Size 165,000 310 Market Penetration 20.0% Distribution 312 265 Network 1 1,780 1,840 1,900 1,960 2,020 2,080 2,140 2,200 2,260 2,320 2,395 2,470 2,470 313 266 Network 2 145 165 185 205 225 245 265 285 305 325 350 375 375 314 267 Network 3 1,445 1,765 2,085 2,405 2,725 3,045 3,365 3,685 4,005 4,325 4,725 5,125 5,125 315 Sub-Total 3,370 3,770 4,170 4,570 4,970 5,370 5,770 6,170 6,570 6,970 7,470 7,970 7,970 Market Size Market Penetration #DIV/0! Railroad, Utility, Alarm, etc. 319 270 Network 1 3,720 4,005 4,335 4,710 5,145 5,640 6,195 6,810 7,485 8,220 9,015 9,870 9,870 320 271 Network 2 936 1,031 1,141 1,266 1,411 1,576 1,761 1,966 2,191 2,436 2,701 2,986 2,986 321 272 Network 3 8,535 10,055 11,815 13,815 16,135 18,775 21,735 25,015 28,615 32,535 36,775 41,335 41,335 322 Sub-Total 13,191 15,091 17,291 19,791 22,691 25,991 29,691 33,791 38,291 43,191 48,491 54,191 54,191 323 Market Size 247,294,981 324 Market Penetration 0.0% 325 274 International, Alternative 8,300 9,100 9,900 10,900 11,900 12,900 14,400 15,900 17,400 19,400 21,400 23,400 23,400 326 275 Other, Alternative 0 0 0 0 0 0 0 0 0 0 0 0 0 327 Total - All Industries 85,311 94,311 104,711 116,111 128,611 142,011 156,811 173,011 190,111 208,611 228,411 249,111 249,111 A = This Row # B = Row # of driver Page 5
  • 6. Acme Company Cumulative Installs by Network A B Jan Feb Mar Apr May Jun Jul Aug Sep Oct Nov Dec Year Network 1 335 245 Vending, Cold Drink 10,705 11,405 12,205 13,105 14,105 15,205 16,405 17,705 19,105 20,605 22,205 23,905 23,905 336 250 Vending, Snack Food 2,800 3,000 3,300 3,600 3,900 4,200 4,500 4,900 5,300 5,700 6,100 6,500 6,500 337 255 Vending, Other 440 480 540 600 700 800 900 1,000 1,100 1,200 1,300 1,400 1,400 338 260 Overnight Courier 9,032 9,212 9,392 9,572 9,752 9,932 10,112 10,292 10,472 10,652 10,877 11,102 11,102 339 265 Distribution 1,780 1,840 1,900 1,960 2,020 2,080 2,140 2,200 2,260 2,320 2,395 2,470 2,470 340 270 Railroad, Utility, Alarm, etc. 3,720 4,005 4,335 4,710 5,145 5,640 6,195 6,810 7,485 8,220 9,015 9,870 9,870 341 Sub-Total 28,477 29,942 31,672 33,547 35,622 37,857 40,252 42,907 45,722 48,697 51,892 55,247 55,247 Network 2 343 246 Vending, Cold Drink 8,300 8,475 8,675 8,900 9,150 9,425 9,725 10,050 10,400 10,775 11,175 11,600 11,600 344 251 Vending, Snack Food 700 750 825 900 975 1,050 1,125 1,225 1,325 1,425 1,525 1,625 1,625 345 256 Vending, Other 110 120 135 150 175 200 225 250 275 300 325 350 350 346 261 Overnight Courier 1,193 1,253 1,313 1,373 1,433 1,493 1,553 1,613 1,673 1,733 1,808 1,883 1,883 347 266 Distribution 145 165 185 205 225 245 265 285 305 325 350 375 375 348 271 Railroad, Utility, Alarm, etc. 936 1,031 1,141 1,266 1,411 1,576 1,761 1,966 2,191 2,436 2,701 2,986 2,986 349 Sub-Total 11,384 11,794 12,274 12,794 13,369 13,989 14,654 15,389 16,169 16,994 17,884 18,819 18,819 Network 3 351 247 Vending, Cold Drink 13,000 15,625 18,625 22,000 25,750 29,875 34,375 39,250 44,500 50,125 56,125 62,500 62,500 352 252 Vending, Snack Food 4,500 5,250 6,375 7,500 8,625 9,750 10,875 12,375 13,875 15,375 16,875 18,375 18,375 353 257 Vending, Other 650 800 1,025 1,250 1,625 2,000 2,375 2,750 3,125 3,500 3,875 4,250 4,250 354 262 Overnight Courier 9,020 9,980 10,940 11,900 12,860 13,820 14,780 15,740 16,700 17,660 18,860 20,060 20,060 355 267 Distribution 1,445 1,765 2,085 2,405 2,725 3,045 3,365 3,685 4,005 4,325 4,725 5,125 5,125 356 272 Railroad, Utility, Alarm, etc. 8,535 10,055 11,815 13,815 16,135 18,775 21,735 25,015 28,615 32,535 36,775 41,335 41,335 357 275 Other 0 0 0 0 0 0 0 0 0 0 0 0 0 358 Sub-Total 37,150 43,475 50,865 58,870 67,720 77,265 87,505 98,815 110,820 123,520 137,235 151,645 151,645 359 274 International 8,300 9,100 9,900 10,900 11,900 12,900 14,400 15,900 17,400 19,400 21,400 23,400 23,400 360 Total - All Networks 85,311 94,311 104,711 116,111 128,611 142,011 156,811 173,011 190,111 208,611 228,411 249,111 249,111 Transceivers/Software 364 Incremental 8 9 11 11 13 13 15 16 17 19 19 21 172 365 Cumulative (1 per 1000 Devices) 85 94 105 116 129 142 157 173 190 209 228 249 249 A = This Row # B = Row # of driver Page 6
  • 7. Acme Company Revenue Projections A B Rate Jan Feb Mar Apr May Jun Jul Aug Sep Oct Nov Dec Year Service Revenue 373 284 Vending, Cold Drink $5.42 $165,185 $182,783 $203,090 $226,103 $251,825 $280,253 $311,390 $345,233 $381,785 $421,043 $463,010 $507,683 $3,739,382 374 291 Vending, Snack Food $9.03 $67,688 $76,713 $87,994 $101,531 $115,069 $128,606 $142,144 $157,938 $175,988 $194,038 $212,088 $230,138 $1,689,931 375 298 Vending, Other $10.83 $0 $0 $0 $0 $0 $0 $0 $0 $0 $0 $0 $0 $0 376 305 Overnight Courier $9.48 $176,685 $188,056 $199,428 $210,799 $222,171 $233,542 $244,914 $256,285 $267,657 $279,028 $291,821 $306,035 $2,876,421 377 312 Distribution $5.42 $17,166 $19,332 $21,498 $23,664 $25,830 $27,996 $30,162 $32,328 $34,494 $36,660 $39,096 $41,804 $350,026 378 319 Railroad, Utility, Alarm, etc. $5.42 $67,097 $76,574 $87,674 $100,400 $115,020 $131,807 $150,759 $171,878 $195,162 $220,613 $248,229 $278,012 $1,843,223 379 325 International $10.83 $85,557 $94,221 $102,885 $112,632 $123,462 $134,292 $147,830 $164,075 $180,320 $199,272 $220,932 $242,592 $1,808,069 380 326 Other $10.00 $0 $0 $0 $0 $0 $0 $0 $0 $0 $0 $0 $0 $0 381 365 Transceivers $45.00 $3,645 $4,028 $4,478 $4,973 $5,513 $6,098 $6,728 $7,425 $8,168 $8,978 $9,833 $10,733 $80,595 382 Total $583,022 $641,706 $707,045 $780,101 $858,888 $942,593 $1,033,925 $1,135,161 $1,243,571 $1,359,631 $1,485,008 $1,616,996 $12,387,646 Hardware Sales 385 245 Vending $290 $1,218,000 $1,363,000 $1,682,000 $1,827,000 $2,030,000 $2,175,000 $2,320,000 $2,610,000 $2,755,000 $2,900,000 $3,045,000 $3,190,000 $27,115,000 386 248 Vending, Monifit $121 $101,640 $113,740 $140,360 $152,460 $169,400 $181,500 $193,600 $217,800 $229,900 $242,000 $254,100 $266,200 $2,262,700 387 260 Overnight Courier $500 $600,000 $600,000 $600,000 $600,000 $600,000 $600,000 $600,000 $600,000 $600,000 $600,000 $750,000 $750,000 $7,500,000 388 265 Distribution $333 $133,000 $133,000 $133,000 $133,000 $133,000 $133,000 $133,000 $133,000 $133,000 $133,000 $166,250 $166,250 $1,662,500 389 270 Railroad, Utility, Alarm, etc. $290 $464,000 $551,000 $638,000 $725,000 $841,000 $957,000 $1,073,000 $1,189,000 $1,305,000 $1,421,000 $1,537,000 $1,653,000 $12,354,000 390 275 Other $428 $0 $0 $0 $0 $0 $0 $0 $0 $0 $0 $0 $0 $0 391 274 International $316 $252,700 $252,700 $252,700 $315,875 $315,875 $315,875 $473,813 $473,813 $473,813 $631,750 $631,750 $631,750 $5,022,413 392 364 Transceivers $750 $6,000 $6,750 $8,250 $8,250 $9,750 $9,750 $11,250 $12,000 $12,750 $14,250 $14,250 $15,750 $129,000 393 ERC $33 $137,500 $137,500 $137,500 $137,500 $137,500 $137,500 $137,500 $137,500 $137,500 $137,500 $137,500 $137,500 $1,650,000 394 Other $0 $0 $0 $0 $0 $0 $0 $0 $0 $0 $0 $0 $0 395 Total $2,912,840 $3,157,690 $3,591,810 $3,899,085 $4,236,525 $4,509,625 $4,942,163 $5,373,113 $5,646,963 $6,079,500 $6,535,850 $6,810,450 $57,695,613 Software 398 364 Primary License Fees $9,500 $76,000 $85,500 $104,500 $104,500 $123,500 $123,500 $142,500 $152,000 $161,500 $180,500 $180,500 $199,500 $1,634,000 399 Other License Fees $5,000 $5,000 $5,000 $5,000 $5,000 $5,000 $5,000 $5,000 $5,000 $5,000 $5,000 $5,000 $5,000 $60,000 400 Maintenance Fees $119 $10,115 $11,186 $12,495 $13,804 $15,351 $16,898 $18,683 $20,587 $22,610 $24,871 $27,132 $29,631 $223,363 401 Total $91,115 $101,686 $121,995 $123,304 $143,851 $145,398 $166,183 $177,587 $189,110 $210,371 $212,632 $234,131 $1,917,363 Installations 25% 404 248 Vending $100 $105,000 $117,500 $145,000 $157,500 $175,000 $187,500 $200,000 $225,000 $237,500 $250,000 $262,500 $275,000 $2,337,500 405 263 Overnight Courier $150 $45,000 $45,000 $45,000 $45,000 $45,000 $45,000 $45,000 $45,000 $45,000 $45,000 $56,250 $56,250 $562,500 406 272 Distribution $150 $15,000 $15,000 $15,000 $15,000 $15,000 $15,000 $15,000 $15,000 $15,000 $15,000 $18,750 $18,750 $187,500 407 273 Railroad, Utility, Alarm, etc. $150 $60,000 $71,250 $82,500 $93,750 $108,750 $123,750 $138,750 $153,750 $168,750 $183,750 $198,750 $213,750 $1,597,500 408 274 International $150 $30,000 $30,000 $30,000 $37,500 $37,500 $37,500 $56,250 $56,250 $56,250 $75,000 $75,000 $75,000 $596,250 409 275 Other $150 $0 $0 $0 $0 $0 $0 $0 $0 $0 $0 $0 $0 $0 410 364 Transceivers/Software $1,000 $8,000 $9,000 $11,000 $11,000 $13,000 $13,000 $15,000 $16,000 $17,000 $19,000 $19,000 $21,000 $172,000 411 Total $263,000 $287,750 $328,500 $359,750 $394,250 $421,750 $470,000 $511,000 $539,500 $587,750 $630,250 $659,750 $5,453,250 413 Other $0 $0 $0 $0 $0 $0 $0 $0 $0 $0 $0 $0 $0 415 Total Revenue $3,849,977 $4,188,832 $4,749,350 $5,162,240 $5,633,514 $6,019,366 $6,612,270 $7,196,860 $7,619,144 $8,237,252 $8,863,740 $9,321,327 $77,453,872 A = This Row # B = Row # of driver Page 7
  • 8. Acme Company Assets A B Jan Feb Mar Apr May Jun Jul Aug Sep Oct Nov Dec Year Incremental Costs Network Equipment 426 Nodes $3,000 $3,000 $3,000 $3,000 $3,000 $3,000 $3,000 $3,000 $3,000 $3,000 $3,000 $3,000 $36,000 427 Repeaters $500 $500 $500 $500 $500 $500 $500 $500 $500 $500 $500 $500 $6,000 428 Network Operation Center $50,000 $5,000 $5,000 $5,000 $5,000 $5,000 $5,000 $5,000 $5,000 $5,000 $5,000 $5,000 $105,000 429 Test Equipment / Other $7,500 $7,500 $7,500 $7,500 $7,500 $7,500 $7,500 $7,500 $7,500 $7,500 $7,500 $7,500 $90,000 430 Total Network Equip $61,000 $16,000 $16,000 $16,000 $16,000 $16,000 $16,000 $16,000 $16,000 $16,000 $16,000 $16,000 $237,000 Office Equipment 433 586 Computers $4,000 $12,000 $12,000 $16,000 $12,000 $12,000 $4,000 $12,000 $12,000 $0 $0 $4,000 $0 $96,000 434 Phone $0 $0 $25,000 $0 $0 $0 $0 $0 $0 $0 $0 $0 $25,000 435 Copier, Fax, LAN, etc. $1,000 $1,000 $1,000 $1,000 $1,000 $1,000 $1,000 $1,000 $1,000 $1,000 $1,000 $1,000 $12,000 436 Other $7,500 $7,500 $7,500 $7,500 $7,500 $7,500 $7,500 $7,500 $7,500 $7,500 $7,500 $7,500 $90,000 437 Sub-Total $20,500 $20,500 $49,500 $20,500 $20,500 $12,500 $20,500 $20,500 $8,500 $8,500 $12,500 $8,500 $223,000 439 586 Furniture $2,000 $6,000 $6,000 $8,000 $6,000 $6,000 $2,000 $6,000 $6,000 $0 $0 $2,000 $0 $48,000 441 Leasehold Improvements $0 $0 $0 $0 $0 $15,000 $0 $0 $0 $0 $0 $0 $15,000 443 Total Incremental P P & E $87,500 $42,500 $73,500 $42,500 $42,500 $45,500 $42,500 $42,500 $24,500 $24,500 $30,500 $24,500 $523,000 Cumulative Costs PP&E 450 430 Network Equipment $1,082,017 $1,098,017 $1,114,017 $1,130,017 $1,146,017 $1,162,017 $1,178,017 $1,194,017 $1,210,017 $1,226,017 $1,242,017 $1,258,017 $1,258,017 451 437 Office Equipment $919,839 $940,339 $989,839 $1,010,339 $1,030,839 $1,043,339 $1,063,839 $1,084,339 $1,092,839 $1,101,339 $1,113,839 $1,122,339 $1,122,339 452 439 Furniture $263,596 $269,596 $277,596 $283,596 $289,596 $291,596 $297,596 $303,596 $303,596 $303,596 $305,596 $305,596 $305,596 453 441 Leasehold Improvements $39,145 $39,145 $39,145 $39,145 $39,145 $54,145 $54,145 $54,145 $54,145 $54,145 $54,145 $54,145 $54,145 454 Total $2,304,597 $2,347,097 $2,420,597 $2,463,097 $2,505,597 $2,551,097 $2,593,597 $2,636,097 $2,660,597 $2,685,097 $2,715,597 $2,740,097 $2,740,097 A = This Row # B = Row # of driver Page 8
  • 9. Acme Company Depreciation life in A B months Jan Feb Mar Apr May Jun Jul Aug Sep Oct Nov Dec Year Equipment 48 463 Beginning Monthly Rate $42,111 $43,809 $44,570 $45,934 $46,695 $47,455 $48,049 $48,809 $49,570 $50,080 $50,590 $51,184 $42,111 464 Increase in Monthly Rate $1,698 $760 $1,365 $760 $760 $594 $760 $760 $510 $510 $594 $510 $9,583 465 Decrease in Monthly Rate $0 $0 $0 $0 $0 $0 $0 $0 $0 $0 $0 $0 $0 466 Current Period Depreciation $43,809 $44,570 $45,934 $46,695 $47,455 $48,049 $48,809 $49,570 $50,080 $50,590 $51,184 $51,695 $578,438 467 Accumulated Depreciation $963,979 $1,008,548 $1,054,482 $1,101,177 $1,148,632 $1,196,680 $1,245,489 $1,295,059 $1,345,139 $1,395,729 $1,446,913 $1,498,608 $1,498,608 Furniture 84 470 Beginning Monthly Rate $3,252 $3,324 $3,395 $3,490 $3,562 $3,633 $3,657 $3,728 $3,800 $3,800 $3,800 $3,824 $3,252 471 Increase in Monthly Rate $71 $71 $95 $71 $71 $24 $71 $71 $0 $0 $24 $0 $571 472 Decrease in Monthly Rate $0 $0 $0 $0 $0 $0 $0 $0 $0 $0 $0 $0 $0 473 Current Period Depreciation $3,324 $3,395 $3,490 $3,562 $3,633 $3,657 $3,728 $3,800 $3,800 $3,800 $3,824 $3,824 $43,837 474 Accumulated Depreciation $89,867 $93,262 $96,752 $100,314 $103,947 $107,604 $111,333 $115,133 $118,933 $122,733 $126,556 $130,380 $130,380 Leasehold 60 477 Beginning Monthly Rate $910 $910 $910 $910 $910 $910 $1,160 $1,160 $1,160 $1,160 $1,160 $1,160 $910 478 Increase in Monthly Rate $0 $0 $0 $0 $0 $250 $0 $0 $0 $0 $0 $0 $250 479 Decrease in Monthly Rate $0 $0 $0 $0 $0 $0 $0 $0 $0 $0 $0 $0 $0 480 Current Period Depreciation $910 $910 $910 $910 $910 $1,160 $1,160 $1,160 $1,160 $1,160 $1,160 $1,160 $12,666 481 Accumulated Depreciation $20,506 $21,415 $22,325 $23,235 $24,144 $25,304 $26,464 $27,623 $28,783 $29,943 $31,102 $32,262 $32,262 Total Depreciation - All Categories 484 Beginning Monthly Rate $46,273 $48,042 $48,874 $50,334 $51,166 $51,998 $52,865 $53,697 $54,529 $55,039 $55,550 $56,167 $46,273 485 Increase in Monthly rate $1,769 $832 $1,460 $832 $832 $868 $832 $832 $510 $510 $618 $510 $10,405 486 Decrease in Monthly rate $0 $0 $0 $0 $0 $0 $0 $0 $0 $0 $0 $0 $0 487 Current Period Depreciation $48,042 $48,874 $50,334 $51,166 $51,998 $52,865 $53,697 $54,529 $55,039 $55,550 $56,167 $56,678 $634,941 488 Accumulated Depreciation $1,074,351 $1,123,225 $1,173,559 $1,224,725 $1,276,723 $1,329,589 $1,383,286 $1,437,815 $1,492,854 $1,548,404 $1,604,572 $1,661,250 $1,661,250 A = This Row # B = Row # of driver Page 9
  • 10. Acme Company Other Costs of Sale A B Jan Feb Mar Apr May Jun Jul Aug Sep Oct Nov Dec Year COGS 498 245 Vending - .Network 1 $232 $243,600 $272,600 $336,400 $365,400 $406,000 $435,000 $464,000 $522,000 $551,000 $580,000 $609,000 $638,000 $5,423,000 499 247 Vending - Network 3 $160 $502,425 $562,238 $693,825 $753,638 $837,375 $897,188 $957,000 $1,076,625 $1,136,438 $1,196,250 $1,256,063 $1,315,875 $11,184,938 500 260 Overnight Courier - Network 1 $400 $96,000 $96,000 $96,000 $96,000 $96,000 $96,000 $96,000 $96,000 $96,000 $96,000 $120,000 $120,000 $1,200,000 501 262 Overnight Courier - Network 3 $375 $360,000 $360,000 $360,000 $360,000 $360,000 $360,000 $360,000 $360,000 $360,000 $360,000 $450,000 $450,000 $4,500,000 502 265 Distribution - Network 1 $283 $22,610 $22,610 $22,610 $22,610 $22,610 $22,610 $22,610 $22,610 $22,610 $22,610 $28,263 $28,263 $282,625 503 267 Distribution - Network 3 $216 $69,160 $69,160 $69,160 $69,160 $69,160 $69,160 $69,160 $69,160 $69,160 $69,160 $86,450 $86,450 $864,500 504 270 Railroad, Utility, Alarm, etc. - Network $232 1 $74,240 $88,160 $102,080 $116,000 $134,560 $153,120 $171,680 $190,240 $208,800 $227,360 $245,920 $264,480 $1,976,640 505 272 Railroad, Utility, Alarm, etc. - Netwrok $160 3 $204,160 $242,440 $280,720 $319,000 $370,040 $421,080 $472,120 $523,160 $574,200 $625,240 $676,280 $727,320 $5,435,760 506 274 International $174 $138,985 $138,985 $138,985 $173,731 $173,731 $173,731 $260,597 $260,597 $260,597 $347,463 $347,463 $347,463 $2,762,327 507 275 Other - Network 3 $235 $0 $0 $0 $0 $0 $0 $0 $0 $0 $0 $0 $0 $0 508 364 Transceivers $500 $4,000 $4,500 $5,500 $5,500 $6,500 $6,500 $7,500 $8,000 $8,500 $9,500 $9,500 $10,500 $86,000 509 248 Vending, Monifit $83 $69,720 $78,020 $96,280 $104,580 $116,200 $124,500 $132,800 $149,400 $157,700 $166,000 $174,300 $182,600 $1,552,100 510 ERC $27 $112,500 $112,500 $112,500 $112,500 $112,500 $112,500 $112,500 $112,500 $112,500 $112,500 $112,500 $112,500 $1,350,000 511 Other Hardware $0 $0 $0 $0 $0 $0 $0 $0 $0 $0 $0 $0 $0 512 Other $0 $0 $0 $0 $0 $0 $0 $0 $0 $0 $0 $0 $0 513 Total $1,897,400 $2,047,213 $2,314,060 $2,498,119 $2,704,676 $2,871,389 $3,125,967 $3,390,292 $3,557,504 $3,812,083 $4,115,738 $4,283,450 $36,617,889 3rd-Party Install Costs 25% 516 276 Transmitters $60 $123,000 $135,000 $156,000 $171,000 $187,500 $201,000 $222,000 $243,000 $256,500 $277,500 $297,000 $310,500 $2,580,000 517 Other $0 $0 $0 $0 $0 $0 $0 $0 $0 $0 $0 $0 $0 518 Total $123,000 $135,000 $156,000 $171,000 $187,500 $201,000 $222,000 $243,000 $256,500 $277,500 $297,000 $310,500 $2,580,000 Network Operation/Maintenance 521 341 Netywork 1 Fee $2.50 $71,193 $74,855 $79,180 $83,868 $89,055 $94,643 $100,630 $107,268 $114,305 $121,743 $129,730 $138,118 $1,204,585 522 358 Network 3 Fee $113,539 $130,488 $149,744 $170,981 $194,049 $218,623 $246,326 $276,346 $307,873 $342,529 $379,545 $418,068 $2,948,110 523 Network 2 Site Rent $12,000 $12,000 $12,000 $12,000 $12,000 $12,000 $12,000 $12,000 $12,000 $12,000 $12,000 $12,000 $144,000 524 Phone $4,307 $4,407 $4,507 $4,607 $4,707 $4,807 $4,907 $5,007 $5,107 $5,207 $5,307 $5,407 $58,284 525 327 3rd-Party Maintenance $0.15 $12,797 $14,147 $15,707 $17,417 $19,292 $21,302 $23,522 $25,952 $28,517 $31,292 $34,262 $37,367 $281,570 526 Other $0 $0 $0 $0 $0 $0 $0 $0 $0 $0 $0 $0 $0 527 Total $213,835 $235,897 $261,137 $288,872 $319,103 $351,374 $387,384 $426,573 $467,801 $512,770 $560,844 $610,959 $4,636,549 Other SG&A Costs 530 110 Taxes $1,500 $1,500 $1,500 $1,500 $1,500 $1,500 $1,500 $1,500 $1,500 $1,500 $1,500 $1,500 $18,000 531 Insurance $7,000 $7,000 $7,000 $7,000 $7,000 $7,000 $7,000 $7,000 $7,000 $7,000 $7,000 $7,000 $84,000 532 Other $0 $0 $0 $0 $0 $0 $0 $0 $0 $0 $0 $0 $0 533 Total $8,500 $8,500 $8,500 $8,500 $8,500 $8,500 $8,500 $8,500 $8,500 $8,500 $8,500 $8,500 $102,000 A = This Row # B = Row # of driver Page 10
  • 11. Acme Company Summary of Staff Divisions (This page summarizes the next 6 pages) A B Jan Feb Mar Apr May Jun Jul Aug Sep Oct Nov Dec Year ALL STAFF DIVISIONS 541 Headcount 110 113 117 120 123 124 127 130 130 130 131 131 131 542 Salaries $542,656 $555,910 $571,713 $582,991 $595,913 $598,132 $609,954 $617,219 $617,219 $617,219 $619,630 $619,630 $7,148,187 543 Other Compensation (relocation, etc) $0 $50,000 $10,000 $0 $0 $0 $0 $55,000 $0 $0 $0 $0 $115,000 544 Commissions $91,366 $99,262 $112,299 $122,205 $133,178 $142,191 $156,665 $170,336 $180,262 $195,393 $210,101 $220,911 $1,834,168 545 Employee Benefits 18% $97,678 $104,564 $104,708 $104,938 $107,264 $107,664 $109,792 $117,399 $111,099 $111,099 $111,533 $111,533 $1,299,274 546 Hiring Expenses $12,000 $12,000 $16,000 $12,000 $12,000 $4,000 $12,000 $12,000 $0 $0 $4,000 $0 $96,000 547 T&E $96,750 $100,750 $101,750 $102,750 $105,750 $105,750 $109,750 $111,750 $111,750 $111,750 $112,750 $112,750 $1,284,000 548 Office Rent $43,723 $44,973 $46,640 $47,890 $49,140 $49,557 $50,807 $52,151 $52,151 $52,151 $52,568 $52,568 $594,319 549 Telephone $23,400 $24,000 $24,800 $25,400 $26,000 $26,200 $26,800 $27,400 $27,400 $27,400 $27,600 $27,600 $314,000 550 Consulting Services $12,250 $12,250 $12,250 $12,250 $12,250 $12,250 $12,250 $12,250 $12,250 $12,250 $12,250 $12,250 $147,000 551 Temporary Services $3,000 $3,000 $3,000 $3,000 $3,000 $3,000 $3,000 $3,000 $3,000 $3,000 $3,000 $3,000 $36,000 552 Electronic Services $2,300 $2,300 $2,300 $2,300 $2,300 $2,300 $2,300 $2,300 $2,300 $2,300 $2,300 $2,300 $27,600 553 Other Services $1,550 $1,550 $1,550 $1,550 $1,550 $1,550 $1,550 $1,550 $1,550 $1,550 $1,550 $1,550 $18,600 554 Maintenance & Repairs $3,675 $3,675 $3,675 $3,675 $3,675 $3,675 $3,675 $3,675 $3,675 $3,675 $3,675 $3,675 $44,100 555 Misc Parts & Materials $2,525 $2,525 $2,525 $2,525 $2,525 $2,525 $2,525 $2,525 $2,525 $2,525 $2,525 $2,525 $30,300 556 Test Equipment, Expensed $525 $525 $525 $525 $525 $525 $525 $525 $525 $525 $525 $525 $6,300 557 Equipment Rent $2,400 $2,400 $2,400 $2,400 $2,400 $2,400 $2,400 $2,400 $2,400 $3,400 $3,400 $3,400 $31,800 558 Seminars & Training $1,550 $1,550 $1,550 $1,550 $1,550 $1,550 $1,550 $1,550 $1,550 $1,550 $1,550 $1,550 $18,600 559 Literature $1,050 $1,050 $1,050 $1,050 $1,050 $1,050 $1,050 $1,050 $1,050 $1,050 $1,050 $1,050 $12,600 560 Software $3,450 $3,450 $3,450 $3,450 $3,450 $3,450 $3,450 $3,450 $3,450 $3,450 $3,450 $3,450 $41,400 561 Durable Supplies $2,000 $2,000 $2,000 $2,000 $2,000 $2,000 $2,000 $2,000 $2,000 $2,000 $2,000 $2,000 $24,000 562 Supplies $7,150 $7,345 $7,605 $7,800 $7,995 $8,060 $8,255 $8,450 $8,450 $8,450 $8,515 $8,515 $96,590 563 Postage/Freight/Courier $3,200 $3,250 $3,250 $3,250 $3,300 $3,300 $3,350 $3,400 $3,400 $3,400 $3,400 $3,400 $39,900 564 Sales Promotion $1,000 $1,000 $1,000 $1,000 $1,000 $1,000 $1,000 $1,000 $1,000 $1,000 $1,000 $1,000 $12,000 565 Sales Literature $7,500 $7,500 $7,500 $7,500 $7,500 $7,500 $7,500 $7,500 $7,500 $7,500 $7,500 $7,500 $90,000 566 Market Research $5,000 $5,000 $5,000 $5,000 $5,000 $5,000 $5,000 $5,000 $5,000 $5,000 $5,000 $5,000 $60,000 567 Public Relations $8,000 $8,000 $8,000 $8,000 $8,000 $8,000 $8,000 $8,000 $8,000 $8,000 $8,000 $8,000 $96,000 568 Company Identity $7,000 $7,000 $7,000 $7,000 $7,000 $7,000 $7,000 $7,000 $7,000 $7,000 $7,000 $7,000 $84,000 569 Advertising / Direct Mail $25,000 $25,000 $25,000 $25,000 $25,000 $25,000 $25,000 $25,000 $25,000 $25,000 $25,000 $25,000 $300,000 570 Trade Shows $7,000 $7,000 $7,000 $7,000 $7,000 $7,000 $7,000 $7,000 $7,000 $7,000 $7,000 $7,000 $84,000 571 Legal $15,000 $15,000 $15,000 $15,000 $15,000 $15,000 $15,000 $15,000 $15,000 $15,000 $15,000 $15,000 $180,000 572 Accounting $0 $0 $1,500 $0 $0 $1,500 $0 $0 $1,500 $0 $0 $100,000 $104,500 573 Board Member Expenses $7,000 $7,000 $7,000 $7,000 $7,000 $7,000 $7,000 $7,000 $7,000 $7,000 $7,000 $7,000 $84,000 574 Miscellaneous $18,900 $19,500 $20,300 $20,900 $21,500 $21,700 $22,300 $22,900 $22,900 $22,900 $23,100 $23,100 $260,000 575 Total $1,055,598 $1,140,329 $1,139,341 $1,148,899 $1,180,816 $1,186,829 $1,228,447 $1,316,780 $1,254,906 $1,269,537 $1,292,972 $1,399,783 $14,614,237 576 Cross Check $1,055,598 $1,140,329 $1,139,341 $1,148,899 $1,180,816 $1,186,829 $1,228,447 $1,316,780 $1,254,906 $1,269,537 $1,292,972 $1,399,783 $14,614,237 BREAKOUT BY DIVISION 588 669 Operations $184,019 $204,919 $219,246 $215,681 $220,978 $216,978 $236,186 $239,986 $228,186 $228,186 $236,913 $232,913 $2,664,190 589 716 Engineering - Site A $143,620 $143,620 $143,620 $143,620 $143,620 $143,620 $143,620 $143,620 $143,620 $143,620 $143,620 $143,620 $1,723,436 590 749 Engineering - Site B $93,921 $93,921 $93,921 $93,921 $93,921 $93,921 $93,921 $94,015 $94,015 $94,015 $94,015 $94,015 $1,127,522 591 789 Marketing & Sales - Domestic $297,530 $348,102 $327,380 $335,098 $361,893 $366,581 $389,347 $438,206 $414,145 $424,969 $439,027 $449,188 $4,591,466 592 821 Marketing & Sales - International $67,388 $63,648 $63,908 $66,095 $66,420 $66,745 $71,889 $72,377 $72,864 $78,171 $78,821 $79,470 $847,797 593 856 Administration $269,120 $286,120 $291,267 $294,485 $293,985 $298,984 $293,484 $328,576 $302,076 $300,576 $300,576 $400,576 $3,659,826 594 Total $1,055,598 $1,140,329 $1,139,341 $1,148,899 $1,180,816 $1,186,829 $1,228,447 $1,316,780 $1,254,906 $1,269,537 $1,292,972 $1,399,783 $14,614,237 A = This Row # B = Row # of driver Page 11
  • 12. Acme Company Operations A B Jan Feb Mar Apr May Jun Jul Aug Sep Oct Nov Dec Year OPERATIONS 646 873 Headcount 29 31 32 33 34 34 36 36 36 36 37 37 37 647 934 Salaries $100,467 $108,209 $112,147 $117,531 $120,425 $120,425 $126,734 $126,734 $126,734 $126,734 $129,145 $129,145 $1,444,428 648 Other Compensation (relocation, etc) $0 $0 $10,000 $0 $0 $0 $0 $10,000 $0 $0 $0 $0 $20,000 649 647 Employee Benefits 18% $18,084 $19,478 $21,986 $21,156 $21,676 $21,676 $22,812 $24,612 $22,812 $22,812 $23,246 $23,246 $263,597 650 646 Hiring Expenses $4,000 $0 $8,000 $4,000 $4,000 $4,000 $0 $8,000 $0 $0 $0 $4,000 $0 $32,000 651 646 T&E $1,000 $29,000 $31,000 $32,000 $33,000 $34,000 $34,000 $36,000 $36,000 $36,000 $36,000 $37,000 $37,000 $411,000 652 646 Office Rent $12,083 $12,917 $13,333 $13,750 $14,167 $14,167 $15,000 $15,000 $15,000 $15,000 $15,417 $15,417 $171,250 653 646 Telephone $5,800 $6,200 $6,400 $6,600 $6,800 $6,800 $7,200 $7,200 $7,200 $7,200 $7,400 $7,400 $82,200 654 Consulting Services $1,250 $1,250 $1,250 $1,250 $1,250 $1,250 $1,250 $1,250 $1,250 $1,250 $1,250 $1,250 $15,000 655 Temporary Services $1,500 $1,500 $1,500 $1,500 $1,500 $1,500 $1,500 $1,500 $1,500 $1,500 $1,500 $1,500 $18,000 656 Electronic Services $500 $500 $500 $500 $500 $500 $500 $500 $500 $500 $500 $500 $6,000 657 Other Services $400 $400 $400 $400 $400 $400 $400 $400 $400 $400 $400 $400 $4,800 658 Maintenance & Repairs $3,000 $3,000 $3,000 $3,000 $3,000 $3,000 $3,000 $3,000 $3,000 $3,000 $3,000 $3,000 $36,000 659 Misc Parts & Materials $600 $600 $600 $600 $600 $600 $600 $600 $600 $600 $600 $600 $7,200 660 Test Equipment $250 $250 $250 $250 $250 $250 $250 $250 $250 $250 $250 $250 $3,000 661 Equipment Rent $750 $750 $750 $750 $750 $750 $750 $750 $750 $750 $750 $750 $9,000 662 Seminars & Training $300 $300 $300 $300 $300 $300 $300 $300 $300 $300 $300 $300 $3,600 663 Literature $100 $100 $100 $100 $100 $100 $100 $100 $100 $100 $100 $100 $1,200 664 Software $750 $750 $750 $750 $750 $750 $750 $750 $750 $750 $750 $750 $9,000 665 Durable Supplies $500 $500 $500 $500 $500 $500 $500 $500 $500 $500 $500 $500 $6,000 666 646 Supplies $65 $1,885 $2,015 $2,080 $2,145 $2,210 $2,210 $2,340 $2,340 $2,340 $2,340 $2,405 $2,405 $26,715 667 646 Postage/Freight/Courier $1,000 $1,000 $1,000 $1,000 $1,000 $1,000 $1,000 $1,000 $1,000 $1,000 $1,000 $1,000 $12,000 668 646 Miscellaneous $200 $5,800 $6,200 $6,400 $6,600 $6,800 $6,800 $7,200 $7,200 $7,200 $7,200 $7,400 $7,400 $82,200 669 Total $184,019 $204,919 $219,246 $215,681 $220,978 $216,978 $236,186 $239,986 $228,186 $228,186 $236,913 $232,913 $2,664,190 A = This Row # B = Row # of driver Page 12
  • 13. Acme Company Engineering - Site 1 A B Jan Feb Mar Apr May Jun Jul Aug Sep Oct Nov Dec Year ENGINEERING - Site A 679 884 Headcount 19 19 19 19 19 19 19 19 19 19 19 19 19 680 945 Salaries $100,672 $100,672 $100,672 $100,672 $100,672 $100,672 $100,672 $100,672 $100,672 $100,672 $100,672 $100,672 $1,208,064 681 Other Compensation (relocation, etc) $0 $0 $0 $0 $0 $0 $0 $0 $0 $0 $0 $0 $0 682 680 Employee Benefits 18% $18,121 $18,121 $18,121 $18,121 $18,121 $18,121 $18,121 $18,121 $18,121 $18,121 $18,121 $18,121 $217,452 683 679 Hiring Expenses $4,000 $0 $0 $0 $0 $0 $0 $0 $0 $0 $0 $0 $0 $0 684 T&E $250 $4,750 $4,750 $4,750 $4,750 $4,750 $4,750 $4,750 $4,750 $4,750 $4,750 $4,750 $4,750 $57,000 685 679 Office Rent $7,917 $7,917 $7,917 $7,917 $7,917 $7,917 $7,917 $7,917 $7,917 $7,917 $7,917 $7,917 $95,000 686 679 Telephone $200 $3,800 $3,800 $3,800 $3,800 $3,800 $3,800 $3,800 $3,800 $3,800 $3,800 $3,800 $3,800 $45,600 687 Consulting Services $1,000 $1,000 $1,000 $1,000 $1,000 $1,000 $1,000 $1,000 $1,000 $1,000 $1,000 $1,000 $12,000 688 Consulting Services - Alternative $0 $0 $0 $0 $0 $0 $0 $0 $0 $0 $0 $0 $0 691 Consulting Services - Misc $0 $0 $0 $0 $0 $0 $0 $0 $0 $0 $0 $0 $0 702 Temporary Services $0 $0 $0 $0 $0 $0 $0 $0 $0 $0 $0 $0 $0 703 Electronic Services $300 $300 $300 $300 $300 $300 $300 $300 $300 $300 $300 $300 $3,600 704 Other Services $300 $300 $300 $300 $300 $300 $300 $300 $300 $300 $300 $300 $3,600 705 Maintenance & Repairs $250 $250 $250 $250 $250 $250 $250 $250 $250 $250 $250 $250 $3,000 706 Misc Parts & Materials $750 $750 $750 $750 $750 $750 $750 $750 $750 $750 $750 $750 $9,000 707 Test Equipment $125 $125 $125 $125 $125 $125 $125 $125 $125 $125 $125 $125 $1,500 708 Equipment Rent $100 $100 $100 $100 $100 $100 $100 $100 $100 $100 $100 $100 $1,200 709 Seminars & Training $350 $350 $350 $350 $350 $350 $350 $350 $350 $350 $350 $350 $4,200 710 Literature $300 $300 $300 $300 $300 $300 $300 $300 $300 $300 $300 $300 $3,600 711 Software $1,200 $1,200 $1,200 $1,200 $1,200 $1,200 $1,200 $1,200 $1,200 $1,200 $1,200 $1,200 $14,400 712 Durable Supplies $300 $300 $300 $300 $300 $300 $300 $300 $300 $300 $300 $300 $3,600 713 679 Supplies $65 $1,235 $1,235 $1,235 $1,235 $1,235 $1,235 $1,235 $1,235 $1,235 $1,235 $1,235 $1,235 $14,820 714 679 Postage/Freight/Courier $250 $250 $250 $250 $250 $250 $250 $250 $250 $250 $250 $250 $3,000 715 679 Miscellaneous $100 $1,900 $1,900 $1,900 $1,900 $1,900 $1,900 $1,900 $1,900 $1,900 $1,900 $1,900 $1,900 $22,800 716 Total Costs $143,620 $143,620 $143,620 $143,620 $143,620 $143,620 $143,620 $143,620 $143,620 $143,620 $143,620 $143,620 $1,723,436 A = This Row # B = Row # of driver Page 13