BP Energy Outlook 2035 - Middle East region insights 2014
•
0 gefällt mir•845 views

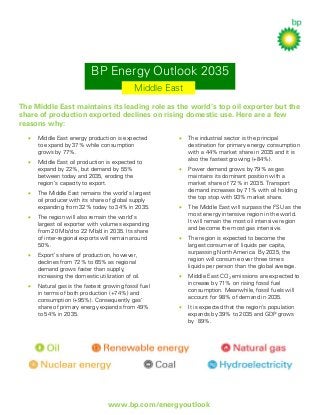
Regional insights for Middle East from BP's Energy Outlook 2035 published in 2014. The Middle East maintains its leading role as the world’s top oil exporter but the share of production exported declines on rising domestic use.

Empfohlen
Weitere ähnliche Inhalte
Mehr von bp
Mehr von bp (20)
BP Energy Outlook 2035 - Middle East region insights 2014
- 1. BP Energy Outlook 2035 Middle East The Middle East maintains its leading role as the world’s top oil exporter but the share of production exported declines on rising domestic use. Here are a few reasons why: • Middle East energy production is expected to expand by 37% while consumption grows by 77%. • Middle East oil production is expected to expand by 22%, but demand by 55% between today and 2035, eroding the region’s capacity to export. • • • • The Middle East remains the world’s largest oil producer with its share of global supply expanding from 32% today to 34% in 2035. The region will also remain the world’s largest oil exporter with volumes expanding from 20 Mb/d to 22 Mb/d in 2035. Its share of inter-regional exports will remain around 50%. Export’s share of production, however, declines from 72% to 65% as regional demand grows faster than supply, increasing the domestic utilization of oil. Natural gas is the fastest growing fossil fuel in terms of both production (+74%) and consumption (+95%). Consequently gas’ share of primary energy expands from 49% to 54% in 2035. • The industrial sector is the principal destination for primary energy consumption with a 44% market share in 2035 and it is also the fastest growing (+84%). • Power demand grows by 79% as gas maintains its dominant position with a market share of 72% in 2035. Transport demand increases by 71% with oil holding the top stop with 93% market share. • The Middle East will surpass the FSU as the most energy intensive region in the world. It will remain the most oil intensive region and become the most gas intensive. • The region is expected to become the largest consumer of liquids per capita, surpassing North America. By 2035, the region will consume over three times liquids per person than the global average. • Middle East CO2 emissions are expected to increase by 71% on rising fossil fuel consumption. Meanwhile, fossil fuels will account for 98% of demand in 2035. • It is expected that the region’s population expands by 39% to 2035 and GDP grows by 89%. www.bp.com/energyoutlook