BP Energy Outlook 2035 - India country insights 2014
•
0 gefällt mir•1,131 views

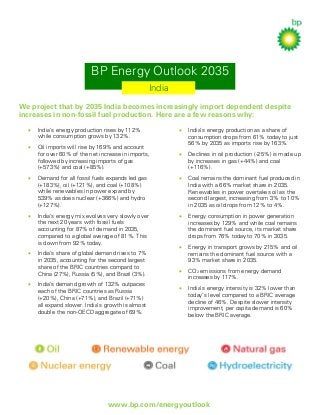
Country insights for India from BP's Energy Outlook 2035 published in 2014. We project that by 2035 India becomes increasingly import dependent despite increases in non-fossil fuel production.

Empfohlen
Weitere ähnliche Inhalte
Mehr von bp
Mehr von bp (20)
BP Energy Outlook 2035 - India country insights 2014
- 1. BP Energy Outlook 2035 India We project that by 2035 India becomes increasingly import dependent despite increases in non-fossil fuel production. Here are a few reasons why: • India’s energy production rises by 112% while consumption grows by 132%. • Oil imports will rise by 169% and account for over 60% of the net increase in imports, followed by increasing imports of gas (+573%) and coal (+85%). • India’s energy production as a share of consumption drops from 61% today to just 56% by 2035 as imports rise by 163%. • Declines in oil production (-25%) is made up by increases in gas (+44%) and coal (+116%). • Demand for all fossil fuels expands led gas (+183%), oil (+121%), and coal (+108%) while renewables in power expand by 539% as does nuclear (+366%) and hydro (+127%). • Coal remains the dominant fuel produced in India with a 66% market share in 2035. Renewables in power overtakes oil as the second largest, increasing from 3% to 10% in 2035 as oil drops from 12% to 4%. • India’s energy mix evolves very slowly over the next 20 years with fossil fuels accounting for 87% of demand in 2035, compared to a global average of 81%. This is down from 92% today. • Energy consumption in power generation increases by 129% and while coal remains the dominant fuel source, its market share drops from 76% today to 70% in 3035. • Energy in transport grows by 215% and oil remains the dominant fuel source with a 93% market share in 2035. • CO2 emissions from energy demand increases by 117%. • India’s energy intensity is 32% lower than today’s level compared to a BRIC average decline of 46%. Despite slower intensity improvement, per capita demand is 60% below the BRIC average. • • India’s share of global demand rises to 7% in 2035, accounting for the second largest share of the BRIC countries compard to China (27%), Russia (5%), and Brazil (3%). India’s demand growth of 132% outpaces each of the BRIC countries as Russia (+20%), China (+71%), and Brazil (+71%) all expand slower. India’s growth is almost double the non-OECD aggregate of 69%. www.bp.com/energyoutlook