PK04:Methods for the analyzes of soil biodiversity data: determining soil biological quality indicators.
•
1 gefällt mir•436 views

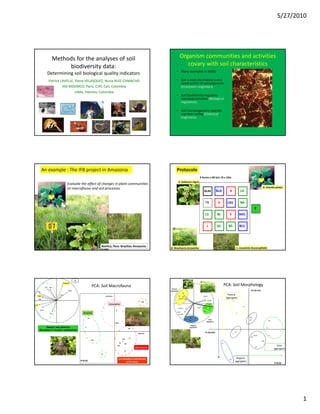
a presentation by Prof. Patrick Lavelle on the Methods for the analyzes of soil biodiversity data: determining soil biological quality indicators.

Empfohlen
Empfohlen
Weitere ähnliche Inhalte
Andere mochten auch
Andere mochten auch (20)
Mehr von CSM _BGBD biodiversity
Mehr von CSM _BGBD biodiversity (20)
Kürzlich hochgeladen
Kürzlich hochgeladen (20)
PK04:Methods for the analyzes of soil biodiversity data: determining soil biological quality indicators.
- 1. 5/27/2010 Methods for the analyses of soil Organism communities and activities biodiversity data: covary with soil characteristics • Many examples in BGBD Determining soil biological quality indicators Patrick LAVELLE, Elena VELASQUEZ, Nuria RUIZ‐CAMACHO • Soil is both the habitat and a construction of soil organisms IRD‐BIOEMCO, Paris; CIAT, Cali, Colombia (Ecosystem engineers) UNAL, Palmira, Colombia UNAL Palmira Colombia • Soil biodiversity regulates microbial activities (Biological regulation) • Soil microorganisms operate nutrient cycling (Chemical engineers) An example : The IFB project in Amazonia Protocole 3 Farms x 48 lots 10 x 10m S: Solanum nigris Evaluate the effect of changes in plant communities on macrofauna and soil processes A: Arachis pintoi BLAS BLAS BLA B LA TB A LAS BA T LS BL S BAS L AS BS BLS Benfica, Para: Brazilian Amazonia B: Brachiaria brizantha L: Leucaena leucocephala 1 ‐1 1 ‐1 Isoptera Chi Ara PCA: Soil Macrofauna PCA: Soil Morphology Physical Gas Hem aggregates F2 (18.1%) Fp Ewm Col.l Fg Physical F2(15.8%) piedra Dipl amm aggregates carbón S BAS For Leucaena raíz LS L hojas Rm madera Rp Col.a B T Rg tallos Iso Arachis semillas inv L Bp BLS AS Bm Bg Root BL Bg BS aggregates BLAS Biogenic Density and diversity A BS aggregates Te Increased in Arachis combinations T F1 (34.8%) AS F1(28.5%) A BLAS B BLA LS BLA LAS S BAS BL LA BA BLS Root Brachiaria BA aggregates Te LA Low abundance and diversity Biogenic LAS P<0.01 In Brachiaria aggregates P<0.01 1
- 2. 5/27/2010 Co‐inertia between Morphology and Macrofauna What is soil biological quality ? Coinertia analysis p < 0.01 Biogenic aggregates Bp • Biodiversity ? Bm Root aggregates Col.l Iso TER Chi inv EWM • Ability of soil organisms Rg Rp raíces Hem madera to participate in ES Bg semillas Isop Rm carbón hojas provision? piedras Fg ANTS – Chemical engineers Fp tallos – Biological regulators Col.a Ara Fm – Ecosystem engineers Gas Dipl Physical aggregates Source: Soil Biodiversity: functions, threats and tools for policy makers; EU, 2009 What do organisms and their activities tell Assessing Biota link to soil quality us about soil integrity and function?? • Microbial indicators – Enzyme activities – Biomass – Community composition • Faunal indicators – Communities – Indicator species – Activities (Soil morphology) Conceptual Model l1 Ecosystem Organisms in an auto organised soil system services Building indicators of soil quality Soil catenas Structures Created • The shopping list • BISQ , Breure et al., 2003 Soil horizon approach Biogenic • The concept of minimal structures data set BIODIVERSITY communities at different scales Intermediate Ecosystem aggregates • The Benchmark approach STRUCTURES Indicators of Ecosystem Services • (reference soil) Microbial Community aggregates of Ecos. Eng. PROCESSES at different scales Ecosystem ES Organisms engineer • The Numerical approach Microfoodwebs Indicators must be multidisciplinary and syntetic • (no reference) Microorganisms after Lavelle et al., 2004, in Wall (ed). 2
- 3. Slide 11 l1 garder?? lavelle, 25/01/2005
- 4. 5/27/2010 The Synthetic Indicator of Soil Quality (GISQ) Velasquez, E., Lavelle , P., and Andrade, M. (2007). GIQS: a multifunctional indicator of soil quality. Principle Soil Biol. Biochem. 39, 3066‐3080. Evaluates from 0.1 to 1.0 : 1. SENSITIVE VARIABLES: Physical quality Organic matter stocks Select from a non limited list the ones that discriminate sites (multivariate analysis) 2. FORMULA : Build a formula based on Chemical fertility respective weights of the selected variables 3. READ : variations from 0.1 to 1.0 for readibility Aggregation and morphology Biodiversity macrofauna Example: Macrofauna at 21 sites of Nicaragua Velasquez et al., 2007 Past F2(16.3%) ‐6 6.7 3.7 GISQ formula for sub indicators HG ‐3 Macrofauna SI = F1 load * Σ(Variable load F1 * Variable value) + F2 load Σ(Variable load F2 * Variable value) 1 Ort -1 1 Iso F2(16.3%) -1 Dipt.l Variables with loading > 50% of the highest value; reduced from 0 to 1 CP2 Macrofauna Dicty Col.l Pastures Lombri Lom hor F1(29.6%) Coffee Plant Plant. MC1 MP1 PAS1 earthw Dicty Iso Diplo Chi Derm Formic Ter Ort Col.a Col.l Hem Dipt.l Ara Gas Hom Derm Col.a F1 1269 4 441 -5 1520 -264 538 60 4 1490 1196 121 508 939 955 678 1520/2= 760 Hem Diplo Chi Hom CP1 PAS3 F2 0 515 2301 -214 -299 -16 21 -419 2868 -158 219 -135 1975 -428 -259 -165 2868/2= 1434 Gas Ter F1(16.3%) PAS5 Ara MIX2 PAS 6 PAS4 MC4 MP4 FW1 ERO PAS2 MC3 MP3 MIX1 SF MC2 MP2 MC5 MP5 I macrofauna i = F1%[1269 (Ewm i) + 1520(Chi i) + 1490 (Cola i) + 1196 Col l i) + 939 Ara i + 955 Gas] +F2%[ 2301 Iso i + 2868 Ort i + 1975 Dipl i] FW2 Fallow Maize Reduced from 0.1 to 1.0 Variable loadings earthw Dicty Iso Diplo Chi Derm Formic Ter Ort Col.a Col.l Hem Dipt.l Ara Gas Hom F1 1269 4 441 -5 1520 -264 538 60 4 1490 1196 121 508 939 955 678 1520/2= 760 F2 0 515 2301 -214 -299 -16 21 -419 2868 -158 219 -135 1975 -428 -259 -165 2868/2= 1434 Fenêtre 4 Mosaïque agricole mixte GISQ – Morvan (France) General GISQ Fau Phy Chimi Morpho MO 0.57 0.77 0.65 0.40 401 0.38 0.53 0.47 0.80 0.27 402 0.71 0.28 0.58 0.63 0.39 403 1.00 0.90 0.57 0.68 0.27 404 0.59 0.48 0.10 0.62 0.51 405 0.29 0.86 0.54 0.61 0.31 0.34 0.74 0.71 0.67 406 0.61 0.31 0.58 0.66 0.26 407 0.40 0.31 0.60 0.78 0.40 408 0.68 0.84 0.61 0.90 0.34 409 0.54 0.54 0.68 0.53 0.29 410 0.31 0.83 0.68 0.59 0.29 411 0.33 0.93 0.40 0.63 0.26 0.59 0.41 0.27 0.34 412 0.28 0.82 0.53 0.61 0.30 Sub indicators used as variables general indicator 413 0.23 0.89 0.54 0.65 0.26 414 0.23 0.77 0.50 0.57 0.26 Nicaragua example: 415 416 0.36 0.30 0.39 0.15 0.53 0.45 0.67 0.72 0.42 0.31 0.32 0.32 0.58 0.65 IGQS= 1.2*Fauna –1.2*Morphology + 0.5*Physic +1.4* OM + 1.9*Chemical 3
- 5. 5/27/2010 The Indicator Value Method Indicator species of soil quality (Dufrêne et Legendre, 1997) • Objective: INDVAL= Aij X Bij X 100 – Identify species that are indicator of certain ragnes of values of SQ Specificity Fidelity – Develop participative Aij= Nindividualsij/Nindividualsi Bij= Nsitesij/Nsitesj approaches for validation – Use as indicator of ES IndVal = 100% when species i are observed in all sites production of only one site group. 13 SubIndicateurs An example from MEXICO GISQ average Gradient of soil quality Indicator earthworm species of soil qualities in Earthworms the AMAZ Brazilian sites Indicator Species F2(16.1%) Maize ORGANIC SOIL BIODIV PHYSICAL CHEMICAL Group Indicator value Pasture EARTHWORM sp. MATTER MORPHO average Pontoscolex corethrurus 40.05 A C 1 0.81 2 0.49 Pontoscolex (P.) corethrurus p < 0.02 p < 0.02 3 0.31 5 4 0.55 C C 5 0.56 Andiorrhinus (Andiorrhinus) sp p < 0.08 p<0.07 6 0.69 1 7 0.29 C 8 0.62 8 p < 0.01 Ocnerodrilidae 9 0.74 C C 1 Diplothecodrilus sp2 p<0.10 p<0.07 -1 1 Sub_Colembolos -1 Rhinodrilus sp1 Sub-OM Sub_Ants Gen. Nov 2 Diplothecodrilus sp3 Sub-chemical F1(20.1%) 2 A Sub-physical Kaxdrilus parcus 74.16 P. (Pontoscolex.) sp p<0.03 Kaxdrilus sylvicola 26.45 Gen. Nov. 2 Ramiellona sp. 1 45.62 Sub_Termites 6 4 Forest 3 7 Andiorrhinus sp2 Sub_earworms Sub_Diplopodos B Sub_Nematodes Acanthodrilidae sp p < 0.06 Sub_BFN C Sub-<macrofauna Sub_HFM Enchytraeidae p<0.09 9 Sub_Chilopodos Higher biodiversity A : 0.1‐0.4 A : 0.4‐0.7 A : 0.7‐1.0 P<0.01 THANK YOU !!! Characteristics Microbial decomposers Biological regulators Ecosystem engineers Protists, nematodes, mites, Ants, termites, earthworms, Main Organisms Bacteria, fungi springtails (Collembola) plants roots Organic matter decomposition, Creation and maintenance of regulation of microbial soil habitats; transformation of Organic matter decomposition, community dynamics, faecal physical state of both biotic mineralisation + nutrients Function pellet structures, and abiotic material, release, pest control, toxic mineralisation, nutrient accumulation of organic compounds degradation availability regulation matter, compaction of soil, de‐ (indirect), litter transformation compaction of soil 2‐200 µm (protists) 0.5‐5 µm (bacteria) 0.1‐5 cm (ants) 500 µm (nematodes) Body size 2‐10 µm (fungal hyphae 0.3‐7 cm (termites) 0.5‐2 mm (mites) diameter) 0.5‐20 cm (earthworms) 0.2‐6 mm (springtails) 9 6 10 cells/g of soil (bacteria) 10 g/soil (protists) 2 3 2 10 meters/g of soil (fungal 10‐50 g/soil (nematodes) 10 ‐10 m /soil (ants) Density in soil hyphae) 103‐105 per m2 /soil(mites) 10‐102 m2/soil (earthworms) 2 4 2 10 ‐10 m /soil (springtails) cm (protists) Tens of meters (nematodes) T f t ( t d ) cm‐m (ants, termites, ( t t it Scale of spatial From 1 to 10²µ Hundred of meters (springtails, earthworms) aggregation termites) From mm to hundred of meters (protists) 1 to 100m (earthworms) Scale of active and µm (active); no limt (passive) From mm to m (protists) up to 1000m social insects passive dispersion From mm to meters (springtail and mites) 100µ to a few mm Scale of resources 1 to 10²µ (bacteria) (nematodes) same scales use µm‐ meters (fungal hyphae) mm to cm (mites, springtails) Intermediate (through Ability to change Highly restricted to micro formation of small and fragile the physical High environments organic biogenic structures) + environment litter fragmentation Resistance to the High (Protist, nematodes) environmental High (cysts, spores) Low Intermediate (meso‐fauna) stresses Source: Soil Biodiversity: functions, threats and tools for policy makers; EU, 2009 4
- 6. 5/27/2010 Biotic Index of Soil Quality Ruiz Camacho et al., 2009 n IBQS = Σ ln (Di+1)×Si i=1 where: Di= average abundance of the indicator taxon i Si= indicator l Si i di t value of th t f the taxon i 0<IBQS<20 Organic variables: organic C, total N, C:N THANK YOU!! Chemical variables: pH, CEC, Na+, K+, Mg++, Ca++, P2O5 Physical variables: % sand, % clay, % silt , NIRS Biological variables: 110 macro-invertebrates taxa, respirometry El FBO mejora significativamente la estructura del suelo F2(17.4%) 4.1 -5.6 4.5 -3.4 MO Rápida descomposición Convencional T4 Mejora la estructura Físicos del suelo 1 F1(29.4%) T2 lP -1 1 -1 mP T3 sP leaf seed T1 FBO MO shoot Lenta descomposición stone lB lR inv mB sR root sB mR Biogénicos Raíz P<0.05 97 10596 82 77 6952 104 57565199 120 2.2 Biotic Index of Soil Quality 1 8658 108 22 95 76107 -2.4 1.8 -2.7 125 145 61 84 25 54 116 74 2 71 67 92 28 106 72 26 16 27 139 n 48 8 23 98 62 41 32 24 93103 121 134 144 20 IBQS = Σ ln (Di+1)×Si 123 60 135 140 124 137 138 102 i=1 122 21 42 127 133 59 79 55 147 14345 44 6 150 F1: 48% 153126 39 5 3 111 100128 65 114 4 117 14143 132 1527336 112 90 142 where: Di= average abundance of the indicator taxon i 101136 149 115 63 94 1 Si= indicator l Si i di t value of th t f the taxon i 34 29 70 35 11 18 40 64 91 118 146 83 38 17 30 10 19 47 0<IBQS<20 15 13 151 14 33 9 68 148 75 119 12 89 81 129 88 85 31 37 8087 130 Organic variables: organic C, total N, C:N 49 113 50 Chemical variables: pH, CEC, Na+, K+, Mg++, Ca++, P2O5 53 78 109 7 Physical variables: % sand, % clay, % silt , NIRS 110 46 66 131 Biological variables: 110 macro-invertebrates taxa, respirometry F2: 24% Figure 1b: Distribution of soil macro‐invertebrates on co‐inertia axis F1 and F2 5
- 7. 5/27/2010 F2 1.5 C/N 0.42 -1.8 1.5 -0.36 0.43 F5 -2.1 -0.4 Silt C9 C1 C8 C7 C2 C5C3 C10 Clay C4 C6 F1: 48% F4 F3 C11 F1: 48% P5 Na WHC H pH C13 Organic C P6 C12 P1 CEC RV: 0.7 Total N Sand P2O5 (Olsen) Ca Mg K F1 p<0.001 F2: 24% P2 Figure 1c: Distribution of soil physico‐chemical parameters on co‐inertia axis 1 and 2. WHC: Water Holding Capacity F2: 24% Figure 1a: Co‐inertia analysis. Sites ordination depending on soil physico‐chemical parameters (circles for fields, squares for grasslands and triangle for forests) and on soil macro‐invertebrates populations (end of the arrows). Landscape: an example in French Guyana C10 C9 C8 • Three 1 Km²landsacpe windows C3 C7 C12 F5 • Sp richness measured at C4 P5 C13 F4 P2 C5 P6 F3 P1 regularly spaced points on a grid, in 16 Orders C6 C11 F2 C2 F1 C1 • TSBF methodology; 1 Figure 2: Typology of sites described by soil physico‐chemical parameters sample every 200m •Microbial decomposer activity Due to the high number of soil biodiversity functions, various methods have been developed to cover soil functional diversity. Mo 取样地描述 •Soil decomposition rates through measuring the rate of organic residue consumption •Soil respiration rate through measuring the CO2 production •Soil nitrification rate performed by specialised bacteria •Soil enzymatic activity Yingde Guangzhou 英德 (24°N, 113°E) 为亚热带气候,土壤类型为由第四季红土进化而来的酸性粘土 . 6