
Empfohlen
Weitere ähnliche Inhalte
Was ist angesagt?
Was ist angesagt? (20)
Andere mochten auch
Ähnlich wie The Magic Number
Ähnlich wie The Magic Number (8)
The Magic Number
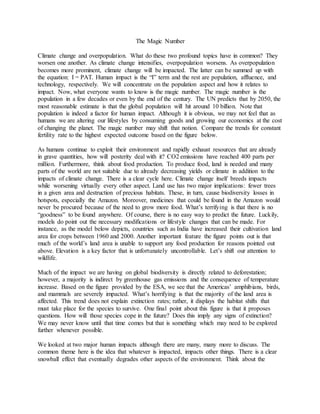
- 1. The Magic Number Climate change and overpopulation. What do these two profound topics have in common? They worsen one another. As climate change intensifies, overpopulation worsens. As overpopulation becomes more prominent, climate change will be impacted. The latter can be summed up with the equation: I = PAT. Human impact is the “I” term and the rest are population, affluence, and technology, respectively. We will concentrate on the population aspect and how it relates to impact. Now, what everyone wants to know is the magic number. The magic number is the population in a few decades or even by the end of the century. The UN predicts that by 2050, the most reasonable estimate is that the global population will hit around 10 billion. Note that population is indeed a factor for human impact. Although it is obvious, we may not feel that as humans we are altering our lifestyles by consuming goods and growing our economics at the cost of changing the planet. The magic number may shift that notion. Compare the trends for constant fertility rate to the highest expected outcome based on the figure below. As humans continue to exploit their environment and rapidly exhaust resources that are already in grave quantities, how will posterity deal with it? CO2 emissions have reached 400 parts per million. Furthermore, think about food production. To produce food, land is needed and many parts of the world are not suitable due to already decreasing yields or climate in addition to the impacts of climate change. There is a clear cycle here. Climate change itself breeds impacts while worsening virtually every other aspect. Land use has two major implications: fewer trees in a given area and destruction of precious habitats. These, in turn, cause biodiversity losses in hotspots, especially the Amazon. Moreover, medicines that could be found in the Amazon would never be procured because of the need to grow more food. What’s terrifying is that there is no “goodness” to be found anywhere. Of course, there is no easy way to predict the future. Luckily, models do point out the necessary modifications or lifestyle changes that can be made. For instance, as the model below depicts, countries such as India have increased their cultivation land area for crops between 1960 and 2000. Another important feature the figure points out is that much of the world’s land area is unable to support any food production for reasons pointed out above. Elevation is a key factor that is unfortunately uncontrollable. Let’s shift our attention to wildlife. Much of the impact we are having on global biodiversity is directly related to deforestation; however, a majority is indirect by greenhouse gas emissions and the consequence of temperature increase. Based on the figure provided by the ESA, we see that the Americas’ amphibians, birds, and mammals are severely impacted. What’s horrifying is that the majority of the land area is affected. This trend does not explain extinction rates; rather, it displays the habitat shifts that must take place for the species to survive. One final point about this figure is that it proposes questions. How will those species cope in the future? Does this imply any signs of extinction? We may never know until that time comes but that is something which may need to be explored further whenever possible. We looked at two major human impacts although there are many, many more to discuss. The common theme here is the idea that whatever is impacted, impacts other things. There is a clear snowball effect that eventually degrades other aspects of the environment. Think about the
- 2. relationship between population and affluence, population and technology, and the three as a whole. Will manipulating I=PAT somehow solve our most threatening problems?