MEP Plans in Construction of Building and Industrial Projects 2024
Portfolio planning
1. • The Portfolio Planning
Companies with multiple product line or business units must ask themselves how various
product and business units should be managed to boost overall corporate performance
1) How much of the time and money should be spent on the best products and business units
to ensure that they continue to be successful.
2) How much of the time and money should be spend developing new costly products most
of which will never be successful
In portfolio analysis top management assumes the role of an internal banker and its product
lines or business units as a series of investment. Two of the most popular approaches fare
the BCG growth share matrix and GE business screen. This concept can also be used to
choose strategies as mentioned in earlier section.
The Boston consulting group business matrix: The main objective of the Boston consulting
group (BCG) technique is to help senior managers identify the cash flow requirements
of the different businesses in their portfolio. The BCG approach involves 3 main steps. (1)
dividing a company into strategic business units (SBU’s) and assessing the long term
prospects of each (2) comparing SBU’s against each others by means of a matrix that
indicates the relative prospects of each and (3) developing strategic objectives with
respect to each SBU.
2. Defining and evaluating Strategic Business Units
According to BCG a company must create an SBU
for each economically distinct business area that it
competes in. When top management identify SBUs
their objective is to divide a company into strategic
entities that are relevant for planning purposes.
Normally a company defines its SBU’s in terms of
the product markets they are competing in. Having
defined SBUs top managers then assess each
according to two criteria (1) SBUs relative market
share (2) the growth rate of the SBUs industry.
3. (1) Relative market share:The objective when
identifying an SBU’s relative market share is to
check whether it can be considered as a weakness or
strength.
(Relative market share =
SBUs market share
________________
Market share held up target
rival in the industry
4. According to the Boston Consulting group market share
gives a company cost advantage from economies of scale
and learning effects. An SBU with relative market share
greater than 1.0 is assumed to be down the experience curve
and therefore to have a significant cost advantage over
its rival. (if the above is less than a disadvantageous
position.)
(2) Growth rate
The objective when assessing industry growth rate is to
determine whether industry conditions offer opportunities
for expansion or whether they threaten the SBU. The growth
rate of an SBU’s industry is assessed according to whether it
is faster or slower than the growth rate of the economy as a
whole. BCG’s position is that high growth industry offer
5. a more favorable competitive environment and
better long term prospectus than slow growth
industries.
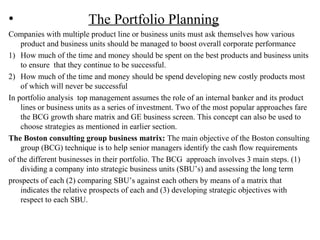
Comparing strategic Business units
The next step of BCG approach is comparing
SBU’s against each other by means of matrix based
on two dimensions. Relative market share and high
growth. The fig. Provides an example of such a
matrix.
6. Cell 4
Dogs
High Relative market share Low
High
Low
Industry
growth rate
Cell 1
Stars
Cell 3
Cash cows
Cell 2
Question marks
7. The horizontal dimension measures relative market share. The
vertical dimension measures industry growth rate. Each circle
represents an SBC. The centre of circle represents the position of that
SBU on the two dimensions of a matrix. The size of each circle is
proportion to the sales revenue generated by each business in the
company’s portfolio. The bigger the circle the larger is the size of an
SBU relative to total corporate revenue.
The matrix is divided into four cells. SBU’s in cell 1 are defined as
stars in cell 2 as question marks in cell 3 as cash cows and in cell 4 as
Dogs. BCG argues that these different types of SBUs have different
long term prospects and different implications for cash flows
8. • Stars
The leading SBUs in a company’s portfolio are the stars. They have
a
high relative market share and are based in high growth industries.
They have both competitive strength and opportunities for
expansion.
Thus they offer long-term profit and growth industries.
Question Marks
SBUs that are relatively weak in competitive terms i.e.; they have
low relative market share-are question marks. However they are
based in high-growth industries and thus may offer opportunities for
long term profit and growth. A question mark can become a star if
nurtured properly. To become a market leader, the question mark
requires substantial injection of cash; it is cash hungry. The
corporate head office has to decide whether a particular question
mark has the potential to become a star and is therefore worth the
capital investment necessary to achieve stardom.
9. Cash Cows
SBUs that have a high market share in low growth
industries and a strong competitive position in mature
industries are cash cows. Their competitive strength
comes from being farthest down the experience curve. They
are the cost leaders in their industries. BCG argues that this
position enables such SBUs to remain very profitable.
However low growth implies a lack of opportunities for
future expansion. As a consequence BCG argues that the
capital investment requirements of cash flows are not
substational and thus they are depicted as generating a
strong positive cash cows.
10. Dogs
SBUs that are in low growth industries but have a
low market share are dogs. They have a weak
competitive position in unattractive industries and
viewed as offering few benefits to a company.
BCG suggest that such SBUs are unlikely to
generate much in the way of a positive cash flow
and indeed may become cash dogs. For
offering few prospects for future growth,
dogs may require substantial capital investment
just
to maintain their low market share.
11. Strategic implications
The objective of the BCG portfolio matrix is to identify
how corporate cash resources can best be used to
maximize a company’s future growth and profitability.
Recommendations: (1) cash surplus from any cash cow
should be used to support the development of selected
question marks and to nurture stars. The long term
objective is to consolidate the position of stars and to turn
favored question marks into stars; thus making the
company’s portfolio more attractive.
12. (2)Question marks with the weakest or most uncertain long
term prospectus should be divested to reduce demands on
company’s cash resources.
(3) The company should exit from any industry where the
SBU is a dog
(4) If a company lacks sufficient cash flows from stars or
cows, it should consider a questions for
divestments to build a more balanced portfolio. A portfolio
should contain enough stars and question marks to ensure a
healthy growth and profit for the company and enough cash
cows to support the investment requirements of the stars
and question marks.
13. Limitations
The use of highs and lows to form 4 categories is too
simplistic.
The link between market share and profitability is
questionable low share business also can be profitable.
Growth rate is only one aspect of industry attractiveness.
Similarly market share is only one aspect of overall
competitive position.
Product line or business units are considered only in
relation to one competitor , the market leader. Small
competitor with fast growing market share are ignored.
.
14. GENERAL ELECTRIC
BUSINESS SCREEN
General electric with the assistance of the Mckinsay and
company consulting firm developed a more complicated
matrix.
• Building on the BCG matrix, the General Electric Business
Screen is an extension of the portfolio idea with a more
stakeholder oriented approach . Like BCG Matrix GE
Business Screen examines the organisations portfolio of
products along two dimensions Industry attractiveness
(External factor evaluation) and Competive positions .The
business screen simply divides each axis into 3 general
categories Low, Medium and High for industry
attractiveness and week ,average and strong for
competitive positions.
• As shown this creates a nine cell matrix
16. The size of each cycle represent the size of the
relevant market rather than the size of the company’s
business .The dark brown shaded part of the circle
represent that business’s market share. Thus the GE
company’s clutch Business operates in a moderate
size market and enjoys 30% market share.
17. Each business is rated in terms of two dimensions
Industry attractiveness (market attractiveness
-/External factor evaluation) and business strength
(competitive strength).These two factors makes
excellent marketing sense for rating a business
.Companies are successful to the extent that they
enter attractive markets and posses the required
competitive strength (business strength )to succeed in
those markets.
18. To measure these dimensions we can use the
EFE (External factor evaluation) and
competitive strength evaluation studied earlier
for each portfolio. Factors underlying market
attractiveness & competitive positions ie GE
Multifactor portfolio Model for hydraulic
pumps .
A GE portfolio of Business is shown below
Sample calculation of external factor evaluation
and competitive strength evaluation is given
below
20. Some suggested strategies for portfolios (or SBU) when its position comes in each cell
is given below
Protect position
•Invest to grow at maximum
digestible rate
•Concentrate effort on
maintaining strength
Invest to build
•Challenge for leardership
•Build selectively on strength
•Reinforce vulnerable areas
Build selectively
•Specialize around
Limited strength
•Seek ways to overcome
Weakness
•With draw if indications of sustainable
Growth are lacking
Build selectively
•Invest heavily in most
Attractive segments
•Build up ability to
counter
competitions
•Emphasis profitability
By raising productivity
Selectivity /manage for
earnings
•Protect existing program
•Concentrate investments
In segments where profitability is
good and risk
are relatively low
Limited expansion for
Harvest
•Look for ways to expand
Without high risk , other wise
,minimise investment and rationale
operations
Protect and refocus
•Manage for current
Earnings
•Concentrate on
attractive
•Defend strengths
Manage for earnings
•Protect positions in most
Profitable segments
•Upgrade product line
•Minimize investment
Divest
•Sell at time that will
Maximixe cash value
•Cut fixed costs and avoid
Investment meanwhile
21. International Portfolio Analysis
To add international strategic planning, portfolio analysis
can be applied to international markets. Two factors, form
the average of the matrix.
1.A country’s attractiveness composed of its market size, the
market rate growth the extent and type of government
regulations and economic and political factors.
2A products competitive strength is composed of its market
share, product fit, contribution margin and market support
22. Advantages and limitations of portfolio analysis
Portfolio analysis is commonly used in strategy formulations because it offers following
advantages.
1. It encourages top management to evaluate each of the corporate business individuality and
to set objectives and allocate resources for each.
2. It stimulates the use of externally oriented date to supplement management judgment.
3. It raises the issue of cash flow availability for use in expansion and growth.
4. Its graphic depiction facilitates communication.
Portfolio analysis does however have some very real limitations that have caused some
companies to reduce the use of this approach.
1. It is not easy to define product/market segment.
2. It suggests the use of standard strategies that can mis opportunities or be in practical.
3. It provides an illusion of scientific rigor when in reality positions are based on subjective
judgment.
4. Its value –ladder terms like cash cow, Dog etc. can lead to self fulfilling prophecies
5. It is not always clear what makes an industry attractive or where a product is with life cycle.
6. Naively following the prescriptions of a portfolio model may actually reduce corporate
profit if they are used in appropriately
23. Note: Strategic Business Unit (SBU)
A Strategic Business Unit is a significant organization segment that is analyzed to develop organizational
strategy aimed at generating future business or revenue.
Definition:
An organizational entity of the company that is given the responsibility to serve the particular demands
of one business area and therefore has its own mission, objectives and business strategy is the subject
of corporate level strategy.
Characteristics
• SBU is the subject of business level strategy while the entire corporation is the subject of corporate
level strategy.
• A business unit within the overall corporate identity which is distinguishable from other business
because it serves a defined external market where management can conduct strategic planning in
relation to product and market.
• When companies become really large, they are best thought of as being composed of a number of
businesses (or SBUs)
• It can encompass an entire company, or can simply be a smaller part of of a company set up to perform
a specific task.
• It has its own business strategy, objectives and competitors and these will often be different from those
of the parent company.
• It could be a company division, a single product, or a complete product line.
• In smaller organizations, it might be the entire company.
• Are a single business (or collection of business), have their own competitors and a manger accountable
for operations, and can be independently planned for.
• It has a manger who is accountable for its operation.
• It is an area that can be independently planned for within the organization.