Cardiac Output, Venous Return, and Their Regulation
A hands on guide to ultrafiltration1
1. Application Note
To Place an Order or Receive
Technical Assistance
+98-21-22024327-8 Ext 612
Arash Abed
Mobile: 09128911277
Email: abed@mabnateyf.com
A Hands-On Guide to Ultrafiltration/Diafiltration
Optimization using Pellicon® Cassettes
In ultrafiltration (UF) tangential flow filtration (TFF) systems,
operating parameter selection will have far reaching impact
as the process is scaled to full-scale manufacturing levels.
While there are many factors that contribute to final system
design, several key parameters should be optimized early in
the process development phase. The goal is to develop a
robust process with the following success criteria: superior
product quality, consistent and high product yield, repro-ducible
process flux and time, and a cleaning regime that
allows extended membrane reuse.
The following basic experiments should be considered
during development of processing methodology:
Optimization
– Impact of transmembrane pressure (TMP) and
feed flow on process flux and retention
– Impact of product concentration and buffer conditions
on process flux and retention
– Impact of diavolumes on buffer exchange and
contaminant removal
Paper design and full process simulation with chosen
processing parameters
Typically, the first three experiments are performed
sequentially to bracket process performance and obtain
data for analysis. This information is then combined with
actual manufacturing considerations (batch volume, process
time, etc.) to design a process simulation. The purpose of a
process simulation is to duplicate the entire manufacturing
process in a scale-down format, to confirm sizing, and to
assess preliminary product quality and yield. The intent is
to develop an optimized process, on the bench, that will
efficiently scale-up to meet full-scale manufacturing
expectations.
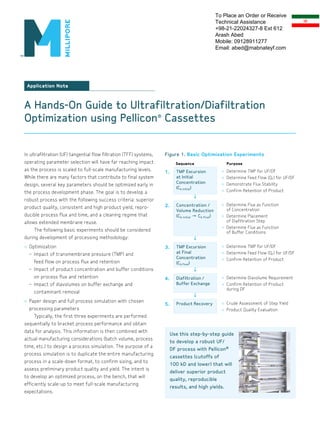
Figure 1. Basic Optimization Experiments
Sequence Purpose
1. TMP Excursion
at Initial
Concentration
(Cb initial)
Determine TMP for UF/DF
Determine Feed Flow (QF) for UF/DF
Demonstrate Flux Stability
Confirm Retention of Product
↓
2. Concentration /
Volume Reduction
(Cb initial → Cb final)
Determine Flux as Function
of Concentration
Determine Placement
of Diafiltration Step
Determine Flux as Function
of Buffer Conditions
↓
3. TMP Excursion
at Final
Concentration
(Cb final)
Determine TMP for UF/DF
Determine Feed Flow (QF) for UF/DF
Confirm Retention of Product
↓
4. Diafiltration /
Buffer Exchange
Determine Diavolume Requirement
Confirm Retention of Product
during DF
↓
5. Product Recovery Crude Assessment of Step Yield
Product Quality Evaluation
Use this step-by-step guide
to develop a robust UF/
DF process with Pellicon®
cassettes (cutoffs of
100 kD and lower) that will
deliver superior product
quality, reproducible
results, and high yields.
2. 2
The following are step-by-step protocols for basic
optimization experiments.
Set-up and Installation Procedure
Refer to the Maintenance Procedures for Pellicon and
Pellicon 2 Cassette Filters (P17512) or the Pellicon 3 Filters
Installation and User Guide (AN1065EN00) when performing
actual set-up and installation of Pellicon cassettes.
1. Assemble the TFF system as shown in Figure 2.
2. Install the Pellicon cassette(s) (Pellicon 2 Mini with 0.1 m2
membrane area, Pellicon 3 with 0.11 m2 membrane area)
in the appropriate Pellicon holder.
3. Flush the system with water, clean with the appropriate
cleaning agent (per appropriate maintenance guide), and
flush again.
Equilibration Procedure
1. Add 3 L/m2 of the appropriate buffer to the feed tank.
Example: 0.1 m2 membrane area x 3 L/m2 = 0.3 L buffer
2. Direct the retentate and permeate to a waste container.
3. Start the feed pump and achieve the following conditions
by partially closing the retentate valve and adjusting the
pump speed:
– Feed flow of 5 L/min/m2
– Retentate pressure of 2 – 15 psi (0.14 – 1.03 bar)
to achieve approximately 30% conversion
4. When half the buffer has been flushed, put the system
in total recycle mode1 and recirculate for 10 minutes;
verify that the pH and conductivity in the system have
been equilibrated to the level of the starting buffer.
5. Direct the retentate and permeate to a waste container.
6. When the feed tank level reaches the minimum level,
open the retentate valve fully and stop the feed pump
to prevent the introduction of air into the system.
Part 1. TMP Excursion
at Ini tia l Con cen tration
1. Add sufficient volume of product to the feed reservoir
such that final volume or concentration target can be
reached or slightly exceeded (approximately 1 – 1.5 L
of final product at final concentration per m2).
Example: if Cinitial = 10 g/L and Cretentate = 80 g/L,
then the concentration factor is 8X. If the minimum
achievable final volume for 0.1 m2 is 0.1 L, calculate the
required initial volume:
Vinitial = Vminimum x VCF = 0.1 L x 8X = 0.8 L
2. Open the retentate valve fully and configure system in
total recycle mode.
3. Start the feed pump and achieve the following
conditions by partially closing the retentate valve
and adjusting the pump speed:
– Recommended feed flow (QF) rate for
the membrane device, typically 5 L/min/m2
for Pellicon 2 and 3 cassettes
– Minimal TMP, typically 2 – 5 psi (0.14 – 0.34 bar)
for more open membranes and 10 psi (0.69 bar)
for tighter membranes.
Tight membranes
(1 kD, 5 kD, etc.)
Can use large TMP increases since
optimum is typically > 30 psi
Open membranes
(50 kD, 100 kD, etc.)
Can use small TMP increases since
optimum is typically < 10 psi
4. Recirculate the product for 10 – 15 minutes and
ensure that stable process flux is achieved 2 .
5. Record temperatures, pressures, and flows; sample
feed and permeate for product retention 3 .
6. Increase TMP by 5 – 10 psid (0.34 – 0.69 bar) by
manipulating the retentate valve while keeping the feed
flow constant. For more open membranes increase
by 2 – 5 psid (0.14 – 0.34 bar). Repeat steps 4 and 5.
7. Repeat step 6 until flux begins to level off 4 ;
typically 4 – 6 TMP values are evaluated in total.
8. Open the retentate valve fully and allow system to
continue in a total recycle.
9. Increase or decrease the feed flow by 2 – 3 L/min/m2
and repeat steps 4 through 8. If desired, a third feed
flow rate can be investigated.
10. Plot the data as shown in Figure 3.
Figure 2. Schematic of a TFF System
?^^]
MZgd
K^m^gmZm^
OZeo^
IK
?bemkZmbhg
JK
J?
?^^] Fh]ne^
Infi
JI
I?
II
=bZ_bemkZmbhg
;n__^k K^m^gmZm^
I^kf^Zm^
?^^]
3. 3
MFIqnklbhgZmMph?^^]?ehpl
?^^]?enq6.E(fbg(f+
?^^]¼I6+)ilb]
Optimum Point
MFI6+.ilb]
C_61/EFA
Optimum Point
MFI6,)ilb]
C_6*.)EFA
?^^]?enq6.E(fbg(f+
?^^]¼I6+)ilb]
Table 1. Membrane Area vs. Pump Feed Rate (Figure 3)
Q1 = 5 L/min/m2 Q2 = 3 L/min/m2 Q1/Q2
A [m2] Volume / Time / 150 LMH Volume / Time / 86 LMH 0.57
QF [L/min] (5 L/min/m2) x Volume / Time / 150 LMH (3 L/min/m2) x Volume / Time / 86 LMH 0.95
Calculations
The appropriate combination of feed flow rate and TMP
will maximize flux while minimizing the impact of pumping
and shear on the product. The appropriate combination of
these two parameters will also minimize processing time
and/or membrane area. To calculate the optimum feed flow,
compare the required membrane area with the required
pump rate at each of the two feed flow conditions, as
shown in Table 1.
Membrane Area [m2] =
Process Volume [L] / (Flux [LMH] x Process Time [h])
In Figure 3:
AreaQ1 = 0.57 x AreaQ2
Pump feed rate [L/min] =
Feed flux [L/min/m2] x Area [m2]
In Figure 3:
Pump feed rateQ1 = 0.95 x Pump feed rateQ2
In this example it is advantageous to run at the higher
feed flow, Q1, since it only requires 57% of the membrane
area used at the lower feed flow rate at almost the
identical pump feed rate.
Note:
• Anticipated final volume of over-concentrated product
must exceed minimum working volume of membrane
system at selected feed flow rate (QF); avoid
introduction of air and maintain uniform mixing
at end of volume reduction.
• Move from least to greatest fouling conditions:
– Do not test into pressure-independent regime
(past the knee of the flux vs. TMP curve) 4
– Avoid exceeding 30 – 40% conversion ratios
• Check hysteresis if possible by returning the system
to the initial conditions and taking a final flux
measurement; compare initial flux performance
to final flux performance at initial conditions.
• Ensure that choice of TMP and feed flow have
corresponding retention values that are acceptable
( 0.998) at both initial and final product
concentration and in each buffer 5 .
• There is often very little performance difference
versus feed flow rate at low product concentration.
However, at the higher concentrations that will be
investigated in Parts 2 and 3, the benefits of different
feed flow rates should become more pronounced.
Figure 3. TMP Excursion at Two Feed Flows
+))
*/)
*+)
1)
-)
)
MFI!ilb]
?enq!EFA
) *) +) ,) -) .)
?^^]?enq6,E(fbg(f+
?^^]¼I6*)ilb]
?^^]?enq6,E(fbg(f+
?^^]¼I6*)ilb]
4. 4
Part 2. Con cen tration
1. Use the product from Part 1 in the starting buffer.
Based on desired final product concentration factor,
add additional feed volume as needed to ensure
sufficient volume at end of concentration 6.
2. Sample feed to confirm product concentration.
3. Put the system in total recycle.
4. Start the feed pump and achieve the optimum TMP and
feed flow as determined in Part 1 by partially closing
the retentate valve and adjusting the pump speed.
5. Direct the permeate to a separate container to
concentrate product and reduce volume.
6. Record temperatures, pressures, and flows throughout
the concentration; sample feed and permeate for
product retention 7.
7. Concentrate slightly beyond desired final product
concentration.
8. Repeat the TMP excursion outlined in Part 1 to
determine optimum TMP at the final concentration in
the starting buffer.
9. Diafilter with one diavolume to get product into final
buffer and dilute with final buffer back to initial
concentration.
10. Repeat the TMP excursion to determine the optimum
TMP at the initial concentration in the final buffer.
11. Repeat Part 2 steps 2 – 7 once in final buffer using the
optimum TMP as determined above.
12. Plot the data as shown in Figure 4, remembering
to apply a temperature correction in the flux
calculations8.
Calculations
The tradeoff between flux and diafiltration buffer volume
create an optimum bulk concentration at which to perform
diafiltration; this can be calculated using the DF optimiza-tion
Plotting the DF optimization parameter as a function of
product concentration yields the optimum concentrations
for diafiltration in both the starting and final buffers, as
shown in Figure 5.
))
))
))
))
))
))
))
))
)
Figure 4. Flux vs. Concentration
?enq!EFA
?enqol'hg^gmkZmbhg
LmZkmbg`
;n__^k
=bZ_bemkZmbhg
;n__^k
)'* * *) *)) *)))
Ikh]nmhg^gmkZmbhgT`(EV
parameter at each data point:
DF Optimization Parameter =
*)))
1))
/))
-))
+))
)
=?HimbfbsZmbhgIZkZf^m^k
Concentration [g/L] x Flux [LMH]
LmZkmbg`;n__^k
him6+2')`(E
=?HimbfbsZmbhg
?bgZe;n__^k
him6..')`(E
LmZkmbg`
;n__^k
Optimum
Cb for DF
) +) -) /) 1) *)) *+)
Ikh]nmhg^gmkZmbhgT`(EV
LmZkmbg`;n__^k
=bZ_bemkZmbhg;n__^k
?bgZe;n__^k
him6..')`(E
LmZkmbg`;n__^k
him6+2')`(E
=bZ_bemkZmbhg
;n__^k
Figure 5. DF Optimization
There is an alternative approach that may be used to
calculate the optimum concentration at which to perform
diafiltration (Copt). It assumes that the product is completely
retained and that the passage of the permeating species is
constant.
If the flux versus concentration data is plotted as
shown in Figure 4, then the gel concentration, Cg, is the
concentration at which the permeate flux reaches zero
(example: ~ 80 g/L in the starting buffer, ~110 g/L in the
final buffer). The optimum concentration at which to
perform diafiltration is then calculated as9:
Copt [g/L] = Cg [g/L] / e
In Figure 4:
Starting buffer Copt = 80 / 2.71828 = 29.4 g/L
Final buffer Copt = 110 / 2.71828 = 40.5 g/L
The Cg/e method can only be used when the flux vs.
concentration data allows for accurate extrapolation
to zero flux.
5. 5
Note:
• Ensure enough feed material and appropriate system
working volume in order to achieve the final
concentration.
• Based on the results of the additional TMP excursions
performed in Part 2, the TMPs used for concentration
in both the starting and final buffers should be
changed and the concentration should be repeated
to obtain more accurate data.
– If the optimum TMP for the dilute solution occurs
in the pressure-independent region (past the knee
of the curve) for the concentrated solution, then
the TMP should be decreased to the lowest
optimum value.
– If the optimum TMP for the dilute solution occurs
within the pressure-dependent region (before the
knee of the curve) for the concentrated solution,
then the TMP may be increased to the highest
optimum value to further optimize the flux and
reduce the processing time.
• Optimum concentration for diafiltration will be
different for each buffer; choose an average or
the most conservative.
– Restrictions on buffer usage or minimum
recirculation volume often dictate the
concentration at which diafiltration occurs.
– If the required final concentration is significantly
less than the optimum concentration for
diafiltration, over concentration followed by dilution
is a possible option, although rarely chosen. It
should only be considered in cases where
diafiltration buffer is limited and the product is
stable at the higher concentrations.
Part 3. TMP Excursion at Fina l
Con cen tration
1. Use the product from Part 2 at the final concentration in
the final buffer.
2. Repeat steps 2 – 10 of Part 1.
Calculations
Reference Part 1.
Note
Reference Part 1 and Part 2 notes.
6. 6
Part 4. Diafi ltration
1. Use the product from Part 3 at the optimum
concentration for diafiltration; dilute as needed using
the final buffer.
2. Configure the system for constant volume diafiltration.
3. Start the feed pump and achieve the optimum TMP and
feed flow as determined in Part 1 and Part 3.
4. Diafilter the product with the chosen number of
diavolumes:
– Choose the number of diavolumes based on the
product purity specifications (if known, see calculation
below) and add a safety factor of 2 diavolumes, or
– Use 3 – 5 diavolumes as an initial estimate
for upstream UF/DF steps, or
– Use 7 – 12 diavolumes as an initial estimate for
final formulation UF/DF steps
5. Record temperatures, pressures, and flows at every
diavolume; sample feed and permeate for both product
retention, and retention and concentration of the
contaminant of interest.
6. Plot the data as shown in Figure 6.
Calculations
The percentage of the original contaminant in the retentate
at each diavolume can be calculated from the retention
values using the following:
Remaining Contaminant [%] =
100 x e (Retention – 1) x N
where N is the number of diavolumes.
However, since contaminant concentration is being
directly measured in each feed sample throughout diafiltration,
plot these concentrations as a percentage of the
original and use the above equation to plot several lines of
theoretical retention, as shown in Figure 6. This plot will
help demonstrate the contaminant removal at various
retentions.
Select the whole number of diavolumes based on the
acceptable contaminant levels for the product; always add
2 – 3 diavolumes as a 10-fold safety factor for critical
diafiltration steps, such as final formulation. For upstream
steps, add 1 – 2 diavolumes. If the goal of diafiltration is not
to wash out a contaminant but rather to reach a target pH
or conductivity, then the measurement of that quality can
be plotted against the number of diavolumes instead.
Note:
• If it appears necessary to diafilter past ~14
diavolumes, any dead-legs or poor mixing areas in the
system will increase the apparent retention of the
contaminant and make further removal difficult.
• Ensure that choice of TMP and feed flow have
corresponding product retention values that are
acceptable ( 0.998) throughout diafiltration.
Figure 6. Contaminant Removal vs. Diavolumes
*))
*)
*
)'*
)')*
)'))*
hgmZfbgZgmK^mZbg^]
Th_hkb`bgZeV
hgmZfbfZgmK^fhoZeol'=bZohenf^l
) . *) *.
=bZohenf^l
K6)'-
K6)'+
K6)
7. 7
Part 5. Prod uct Re covery
There are various methods for product recovery at
large-scale.10 However, at small-scale, sufficient product
recovery can be achieved by manually tilting the system and
breaking the piping at low-points to drain the product.
Samples of the final retentate should then be analyzed for
product concentration and quality.
1. After the product has been drained from the system,
add one system volume of diafiltration buffer to the
feed tank.
2. Recirculate at the selected feed flow rate with
the retentate valve fully open for 10 minutes.
3. Recover the buffer in a separate container using the
same methods that were used to recover the product.
Samples of this buffer rinse should be analyzed for
product concentration.
4. After the product is recovered, the system should be
cleaned with the appropriate solutions.11
Calculations
Ideally, the total product mass recovered in the retentate,
permeate, and buffer flush as well as unrecoverable holdup
volume should equal the total mass of product in the feed.
If the total product mass recovered is less than the initial
product mass, it is typically due to adsorption and/or
solubility losses during processing.12 However, it is impor-tant
to perform a mass balance and calculate total yield to
ensure optimum process parameters.
Note:
• All calculations are estimates; during these
optimization steps, the product has undergone more
processing than normal. Product degradation and yield
may be slightly affected. For a true indication of
processing on product quality, perform the entire
optimized process using fresh feed and new
membranes.
• Product can be very viscous when recovered and may
affect assays; perform serial dilutions for more
accurate assay results.
• Actual yield and mass balance percentages should be
close to 100% and/or theoretical yield. If significant
losses occur, process parameters (including membrane
type) may have to be changed and then re-optimized.
• In a robust process, adsorption and solubility losses
should be very low.
Actual Yield [%] =
100 x (Vretentate [L] x Cretentate [g/L]) / (Vinitial [L] x Cinitial [g/L])
Mass Balance [%] =
100 x {(Vretentate [L] x Cretentate [g/L]) + (Vpermeate [L] x Cpermeate [g/L]) + (Vrinse [L] x Crinse [g/L])} / (Vinitial [L] x Cinitial [g/L])
The theoretical yield can also be calculated based on the
membrane retention and compared to the actual yield.
Theoretical Yield [%] = 100 x e (Retention – 1)(N + lnX)
where N = number of diavolumes and X = concentration
factor.
8. 8
Pape r Desi gn and
Process Sim ulation
The optimization parameters obtained from the previous
experiments can be combined to design a full process
simulation: concentration, diafiltration, (concentration,) and
recovery. If time permits, a process simulation should be
run immediately following the optimization work, and should
employ the following:
• New set of cassettes; same membrane type,
same cassette path length
• Fresh feedstock
• Fresh buffer(s)
• Optimized process parameters
• See detailed process simulation calculations below.
After performing the process simulation, the system
should be cleaned with the appropriate solution according
to Millipore recommendations.11 If possible, the process
should be rerun using the cleaned membranes to determine
the effectiveness of the cleaning cycle and the consistency
of membrane performance from run-to-run. If the cleaning
cycle does not prove effective, the cleaning parameters or
cleaning solutions will need to be changed and the cleaning
cycle will have to be tested again.
Calculations
The membrane area can be optimized to allow the entire
process (both concentration and diafiltration) to be
completed in the specified timeframe (3 – 4 hours is
recommended). The average flux for each concentration
and diafiltration step can be estimated from the optimiza-tion
data and combined with the desired volumes to be
processed. The approximate required membrane area can
then be calculated for both manufacturing scale and
scale-down runs.
Assume an example process scenario (this would have
been determined by optimization data, DF parameter, etc.):
• 2.9X Concentration:
10 g/L to 29 g/L; flux decreases from 150 LMH to 80 LMH
• 7X Diafiltration:
29 g/L; flux increases from 80 LMH to 85 LMH
• 3.4X Concentration:
29 g/L to 100 g/L; flux decreases from 85 LMH to 20 LMH
• Desired process time is 4 hours
Manufacturing scale volumes as determined by the
customer:
• Feed volume = 5000 L
• Retentate volume at end of 2.9X concentration =
5000 L/2.9 = 1724 L
• Permeate volume removed during 2.9X concentration =
5000 L – 1724 L = 3276 L
• 7X Diafiltration buffer volume = 7 x 1724 L = 12,068 L
• Retentate volume at end of 3.4X Concentration =
1724 L/3.4 = 507 L
• Permeate volume removed during 3.4X concentration =
1724 L – 507 L = 1217 L
9. 9
Average process flux for concentration step:13
Javg = Jfinal + 0.33 (Jinitial – Jfinal) = Jinitial x 0.33 + Jfinal x 0.67
For 2.9X concentration:
Javg = 150 LMH x 0.33 + 80 LMH x 0.67 = 103 LMH
For 3.4X concentration:
Javg = 85 LMH x 0.33 + 20 LMH x 0.67 = 41 LMH
Average process flux for diafiltration step:
For diafiltration the average flux can be estimated as the
initial and final process flux during the diafiltration step.
Required area:
Area = [(Permeate volume/Average flux) Concentration + (Permeate volume/Average flux) Diafiltration + … ] / Time
In this example:
Area = [(3,276 L/103 LMH) + (12,068 L/83 LMH) + (1,217 L/41 LMH)] / 4 hours = 51.6 m2
Add 20% safety factor:
Area = 62 m2
To perform a scale-down process simulation, the same
volume to area ratio is used and scaled based on either the
feed volume that can be used for the simulation or the area
of the desired filtration device. For example, if the process
is to be performed on one Pellicon 2 Mini cassette (with an
area of 0.1 m2), then the required feed volume will be:
Scale-down feed volume =
0.1 m2 x (5000 L/62 m2) = 8 L
Instead, if there is a specific volume of feedstock to
process (example: 25 L), then the required membrane
area will be:
Scale-down membrane area =
25 L x (62 m2/5000 L) = 0.3 m2
The process parameters, including Pellicon device type,
should be consistent between scales, allowing the process
to be completed in a similar timeframe with similar fluxes,
pressures and loadings. The concentration factors, number
of diavolumes and feed quality should be kept consistent at
all scales to ensure robust scalability. However, to demon-strate
process robustness and repeatability, the process
should be tested at pilot scale before proceeding to
manufacturing.
10. 10
Defini tions
Transmembrane Pressure (TMP)
The average applied pressure from the feed to the
permeate side of the membrane.
TMP [bar] = [(PF + PR)/2] - PP
Pressure Drop (ΔP)
The difference in pressure along the feed channel of the
membrane from inlet to outlet.
ΔP [bar] = PF – PR
Conversion Ratio (CR)
The fraction of the feed side flow that passes through the
membrane to the permeate.
CR [–] = QP / QF
Apparent Sieving (Sapp)
The fraction of a particular protein that passes through the
membrane to the permeate stream based on the measurable
protein concentrations in the feed and permeate streams.
A sieving coefficient can be calculated for each protein
in a feedstock.
Sapp [–] = (Concentration in permeate, CP) /
(Concentration in feed, Cb)
Intrinsic Sieving (Si)
The fraction of a particular protein that passes through
the membrane to the permeate stream. However, it is based
on the protein concentration at the membrane surface.
Although it cannot be directly measured, it provides a
better understanding of the membrane’s inherent separa-tion
characteristics.
[–] = (Concentration in permeate, CP) /
Si
(Concentration at membrane wall, Cw)
Retention (R)
The fraction of a particular protein that is retained by the
membrane. It can also be calculated as either apparent or
intrinsic retention. Retention is often also called rejection.
Rapp [–] = 1 – Sapp or Ri = 1 – Si
Permeate Flux ( Jf )
The permeate flow rate normalized for the area of
membrane (m2) through which it is passing.
Mass Flux (Jm )
The mass flow of protein through the membrane normalized
for the area of membrane (m2) through which it is passing.
Jm [g m–2 h–1] = QP x CP / area
Volume Concentration Factor (VCF or X)
The amount that the feed stream has been reduced in
volume from the initial volume. For instance, if 20 L of
feedstock are processed by ultrafiltration until 18 L have
passed through to the permeate and 2 L are left in the
retentate, a ten-fold concentration has been performed so
the Volume Concentration Factor is 10. In a Fed-Batch
concentration process, where the bulk feedstock is held in
an external tank and added to the TFF operation continu-ously
as permeate is removed, VCF should be calculated
based only on the volume that has been added to the
TFF operation.
VCF or X [–] = Total starting feed volume added to
the operation / current retentate volume
Concentration Factor (CF)
The amount that the product has been concentrated in the
feed stream. This depends on both the volume concentra-tion
factor and the retention. As with the VCF, for a
Fed-Batch concentration process, calculate CF based only
on the volume of feedstock added to the TFF application.
CF [–] = Final product concentration /
initial product concentration = VCF(R
app)
Diavolume (DV or N)
A measure of the extent of washing that has been per-formed
during a diafiltration step. It is based on the volume
of diafiltration buffer introduced into the unit operation
compared to the retentate volume. If a constant-volume
diafiltration is being performed, where the retentate volume
is held constant and diafiltration buffer enters at the same
rate that permeate leaves, a diavolume is calculated as:
DV or N [–] = Total buffer volume introduced
to the operation during
diafiltration/retentate volume
11. 11
Refe ren ces /Foo tno tes
1. Total recycle means retentate and permeate lines
return to feed vessel
2. If process flux is unstable, it may be necessary to allow
additional time or investigate other membrane options
3. Retention samples are not required at every data point;
sampling at lowest and highest TMP is typical
4. The point at which the flux levels off is defined as the
point around which the slope of the flux vs. TMP curve
decreases to ≤ 50% of the previous slope. This point is
also referred to as the “knee” of the curve.
5. These other conditions are described in more detail
in Parts 2 and 3.
6. Example: 10X concentration with a final volume of
300 mL requires (300 mL x 10) = 3 L of feed
7. Retention samples are not required at every data point;
initial and final concentration are typical. Typical data
recording interval is approximately every 10 – 15
minutes.
8. See Guide: Maintenance Procedures for Pellicon and
Pellicon 2 Cassette Filters (P17512) or Pellicon 3 Filters
Installation and User Guide (AN1065EN00)
9. Ng P, Lundblad J, and Mitra G, Optimization of Solute
Separation by Diafiltration, Separation Science, 11(5):
499-502, 1976.
10. See Technical Brief: Protein Concentration and
Diafiltration by Tangential Flow Filtration (TB032)
11. See Guide: Maintenance Procedures for Pellicon and
Pellicon 2 Cassette Filters (P17512) or Pellicon 3 Filters
Installation and User Guide (AN1065EN00)
12. See Technical Note: Increase Product Yield in Your UF/DF
Processes (AN1026EN00)
13. Average flux can also be calculated for each step
by dividing the total process volume by the
total process time

![2
The following are step-by-step protocols for basic
optimization experiments.
Set-up and Installation Procedure
Refer to the Maintenance Procedures for Pellicon and
Pellicon 2 Cassette Filters (P17512) or the Pellicon 3 Filters
Installation and User Guide (AN1065EN00) when performing
actual set-up and installation of Pellicon cassettes.
1. Assemble the TFF system as shown in Figure 2.
2. Install the Pellicon cassette(s) (Pellicon 2 Mini with 0.1 m2
membrane area, Pellicon 3 with 0.11 m2 membrane area)
in the appropriate Pellicon holder.
3. Flush the system with water, clean with the appropriate
cleaning agent (per appropriate maintenance guide), and
flush again.
Equilibration Procedure
1. Add 3 L/m2 of the appropriate buffer to the feed tank.
Example: 0.1 m2 membrane area x 3 L/m2 = 0.3 L buffer
2. Direct the retentate and permeate to a waste container.
3. Start the feed pump and achieve the following conditions
by partially closing the retentate valve and adjusting the
pump speed:
– Feed flow of 5 L/min/m2
– Retentate pressure of 2 – 15 psi (0.14 – 1.03 bar)
to achieve approximately 30% conversion
4. When half the buffer has been flushed, put the system
in total recycle mode1 and recirculate for 10 minutes;
verify that the pH and conductivity in the system have
been equilibrated to the level of the starting buffer.
5. Direct the retentate and permeate to a waste container.
6. When the feed tank level reaches the minimum level,
open the retentate valve fully and stop the feed pump
to prevent the introduction of air into the system.
Part 1. TMP Excursion
at Ini tia l Con cen tration
1. Add sufficient volume of product to the feed reservoir
such that final volume or concentration target can be
reached or slightly exceeded (approximately 1 – 1.5 L
of final product at final concentration per m2).
Example: if Cinitial = 10 g/L and Cretentate = 80 g/L,
then the concentration factor is 8X. If the minimum
achievable final volume for 0.1 m2 is 0.1 L, calculate the
required initial volume:
Vinitial = Vminimum x VCF = 0.1 L x 8X = 0.8 L
2. Open the retentate valve fully and configure system in
total recycle mode.
3. Start the feed pump and achieve the following
conditions by partially closing the retentate valve
and adjusting the pump speed:
– Recommended feed flow (QF) rate for
the membrane device, typically 5 L/min/m2
for Pellicon 2 and 3 cassettes
– Minimal TMP, typically 2 – 5 psi (0.14 – 0.34 bar)
for more open membranes and 10 psi (0.69 bar)
for tighter membranes.
Tight membranes
(1 kD, 5 kD, etc.)
Can use large TMP increases since
optimum is typically > 30 psi
Open membranes
(50 kD, 100 kD, etc.)
Can use small TMP increases since
optimum is typically < 10 psi
4. Recirculate the product for 10 – 15 minutes and
ensure that stable process flux is achieved 2 .
5. Record temperatures, pressures, and flows; sample
feed and permeate for product retention 3 .
6. Increase TMP by 5 – 10 psid (0.34 – 0.69 bar) by
manipulating the retentate valve while keeping the feed
flow constant. For more open membranes increase
by 2 – 5 psid (0.14 – 0.34 bar). Repeat steps 4 and 5.
7. Repeat step 6 until flux begins to level off 4 ;
typically 4 – 6 TMP values are evaluated in total.
8. Open the retentate valve fully and allow system to
continue in a total recycle.
9. Increase or decrease the feed flow by 2 – 3 L/min/m2
and repeat steps 4 through 8. If desired, a third feed
flow rate can be investigated.
10. Plot the data as shown in Figure 3.
Figure 2. Schematic of a TFF System
?^^]
MZgd
K^m^gmZm^
OZeo^
IK
?bemkZmbhg
JK
J?
?^^] Fh]ne^
Infi
JI
I?
II
=bZ_bemkZmbhg
;n__^k K^m^gmZm^
I^kf^Zm^
?^^]](data:image/gif;base64,R0lGODlhAQABAIAAAAAAAP///yH5BAEAAAAALAAAAAABAAEAAAIBRAA7)