SlideShare ist ein Scribd-Unternehmen logo
1 von 38
Downloaden Sie, um offline zu lesen
Capital Link’s

CEF & ETF Monthly Newsletter

FEBRUARY 2014
Volume 2 | Issue 2

Table of Contents
CEF Sector Review


Lipper
•
•
•
•

The Month in CEFs: January 2014.........
CEF Events & Corporate Actions............
CEF Performance Statistics....................
Top 5 Performing CEFs...........................

3
5
7
8

ETP Sector Review


Market/Fund/Investment
Commentaries




BlackRock
•
Global ETP Monthly Review................... 9
•
Global ETP Data & Statistics.................. 11



CEF Commentaries






Fitch Ratings
•
Fitch: Investors Sell Puerto Rico
Bonds; PRICA Adds Uncertainty
•
Fitch: New Puerto Rico Fund..............
Regulations Modest Credit Positive...
First Trust Advisors
•
The Power of Closed-End Fund
Distributions, by Jeff Margolin...........
CEF Advisors
•
The Future of CEFs: Yield May No
Longer be The Marketing Plan, by
John Cole Scott, CFS............................



17
17

18





CEFs & ETPs Event Calendar



19

ETF Commentaries




Calamos Investments
•
2014: Year of the Fundamental
Investor, by John P. Calamos SR. and
Gary D. Black..................................... 23
Legg Mason
•
Municipal Bond Market Review &
Outlook............................................... 25
DWS Asset Management
•
Potential inclusion of China A-shares
in Major Global Benchmarks.............. 27
PowerShares
•
Smart Beta ETF Strategies................... 30
Aberdeen Asset Management
•
Aberdeen Great China Fund, Inc.
(GCH) Fund Manager Interview –
Nicolas Yeo.......................................... 32
Fund Updates............................................... 34

BlackRock
•
Three Things to Know about Currency
Hedging, by Dodd Kittsley, CFA.............. 20
First Trust Advisors
•
2013 – A Strong Year for ETFs, by
Ryan O. Issakainen, CFA...................... 21
•
Preparing for the Unexpected with
Commodity Futures ETFs, by Ryan O.
Issakainen, CFA................................... 22



CEFs & Global ETFs Webinar Library............... 35
Capital Link’s MLP Investing Forum on
March 6, 2014 in New York City.............see p. 2
Capital Links’ 13th Annual Closed-End Funds
& Global ETFs Forum on April 24, 2014 in
New York City..........................................see p. 16

…your link with the Global Investment Community
LEAD SPONSORS

Seating is limited. To register, click on the below button or visit our website
SPONSORS

Attendance is complimentary for qualified delegates.
The Forum will qualify for up to 9 CFP Continuing Education Credits
ABOUT THE FORUM
Capital Link will be hosting its MLP Investing Forum on Thursday, March 6, 2014 at the Metropolitan Club in New York City at
One East 60th Street, New York City. The Forum is designed to provide in-depth information on topics of interest to the industry
and to investors.
This Forum is an extension of our 13 year track record success of Capital Link’s Annual Closed-End Funds & Global ETFs Forum,
which attracts more than 1,200+ delegates every year.
The Forum combines an informational and marketing platform with unique visibility and networking opportunities.
INDUSTRY PANEL TOPICS TO BE COVERED
Developments, Trends & Sector Outlook
•
•
•
•
•
•
•
•
•

Upstream Panel - Exploration & Production
Mid-Stream Panel - Gathering, Processing, Transportation & Storage
NGL/LNG/LPG Panel
Marine Transportation Panel
Tax/Legislation/Regulatory Panel - MLP Parity Act, Future Tax Implications & Issues
Analyst Panel - Analyst Perspective
MLP Closed End Funds & ETFs Panel - The Investor Perspective
MLP Rating Agency Panel - Financial & Debt Management Best Practices for the MLP Structure
Raising Capital for MLPs Panel

SUPPORTING
SPONSORS

FEATURED SPEAKERS
Kyri Loupis, Managing Director of the Investment Management Division of Goldman Sachs will deliver the Opening Address
on the “State of the MLP Sector”.
Jerry Swank, Founder, Managing Partner & CEO of Swank Capital & The Cushing Funds will deliver the Keynote Address.
PRESENTERS / SPEAKERS INCLUDE:
•
•
•
•
•
•
•
•
•
•
•
•
•
•
•
•
•

Jonathan Z. Ackerman, Chief Financial Officer - Oiltanking•
Partners LP (NYSE: OILT)
Seth Appel, Managing Director Investment Banking Group -•
MLV & Co.
•
Robert Baldwin, MLP Lead - PricewaterhouseCoopers
LLP
•
Doug Bond, Portfolio Manager - Cohen & Steers (NYSE:
MIE)
•
Mike Bresson, Head of MLP Tax Practice - Baker Botts LLP
Stuart Buchanan, Business Development & Investor•
Relations - Golar LNG Partners LP (NASDAQ: GMLP)
•
John Campbell, President & COO - QR Energy (NYSE:
QRE)
•
Stratos Desypris, Chief Financial Officer - Navios Maritime
Partners (NYSE: NMM)
•
William Ferara, Director, Utilities & Infrastructure - Standard
& Poor's
•
Fred Gordon, VP, Corporate Affairs - Navios Maritime•
Partners (NYSE: NMM)
•
Greg Haas. Director of Research, Integrated Oil & Gas - Hart
Energy Research
•
Hinds Howard, Vice President - CBRE Clarion Securities
Jim Jackson, Chief Financial Officer - Breitburn Energy•
Partners LP (NASDAQ: BBEP)
Michelle Kelly, Managing Director - Tortoise Capital•
Advisors (NYSE: TYG)
Roy Lamoreaux, Director Investor Relations - Plains All•
American Pipelines, LP (NYSE: PAA)
Ioannis Lazaridis, CEO & CFO - Capital Product Partners•
LP (NASDAQ:CPLP)
Mary S. Lyman, Executive Director - National Association
of Publicly Traded Partnerships

Mark Maki, President - Enbridge Energy Partners LP
(NYSE : EEP)
Stuart D. Miller, VP and Senior Credit Officer - Moody's
Peter Molica, Director, Corporate Ratings, Midstream,
Pipelines and MLPs - Fitch Ratings
Jeff Olmstead, President & CFO - Mid-Con Energy
Partners, LP (NASDAQ: MCEP)
Stephen Pang, Director Equity Capital Markets Group Credit Suisse
Robert A. Prado, Director - PricewaterhouseCoopers LLP
Michael Peterson, Managing Director, Energy Research MLV & Co.
Matthew Phillips, Midstream Energy/MLP Equity Research
Analyst - Clarkson Capital Markets
Richard Robert, EVP & CFO - Vanguard Natural
Resources, LLC (NASDAQ: VNR)
Daniel Rodgers, Partner - Watson Farley & Williams
Tyler Rosenlicht, Analyst - Cohen & Steers (NYSE: MIE)
Darren Schuringa, Managing Partner - Yorkville Capital
Management (NYSE: YMLP)
Eduardo Seda, VP, Senior Energy Analyst - Ladenburg
Thalmann & Co.
Nicholas Stillman, Managing Director - Clarkson Capital
Markets
Mark Stockard, VP Investor Relations - Crestwood
Midstream Partners (NYSE : CMLP)
Michael Webber, Senior Equity Analyst, Director - Wells
Fargo Securities
Gavin Worthy, VP, Sales Operations & Business
Development, Swank Capital, LLC

SUPPORTING
ORGANIZATION

MEDIA PARTNERS

ORGANIZED BY

CAPITAL LINK, INC.
New York • London • Athens • Oslo
230 Park Ave. Suite 1536 New York,
NY 10169 | NY: +1 (212) 661-7566
forum@capitallink.com
Closed-End Funds Report

The Month in Closed-End Funds: January 2014
PERFORMANCE
With the S&P 500 index (-3.46%) posting its worst January return since
2010 and the Dow Jones Industrial Average (-5.30%) chalking up its worst
January return since 2009, it’s little wonder investors ducked for cover and
bid up Treasury securities in January. Although the real meltdown didn’t
materialize until the very end of the month, investors were cautious after the
spectacular equity run-up in 2013, the Federal Reserve’s commitment to
continue tapering its now $75-billion/ month bond-buying program by $10
billion in February, and the mixed economic news throughout the month.
Shrugging off generally better-than-expected fourth quarter earnings reports
(according to Thomson Reuters’ proprietary research team, with 50% of the
S&P 500 constituents reporting Q4 2013 earnings thus far, 70% have beat
expectations and 10% have matched analyst expectations), many investors
have decided to take some of those hard-won profits off the table, since
many pundits believe we are ripe for a near-term correction and
consolidation.
For the third straight month equity and fixed income CEFs went their
separate ways. As one might expect, given the slide in the broad-based
indices, equity CEFs were in the red for January, losing on average 1.57%
on a NAV basis (their first negative return since August 2013) and 1.67% on
a market basis. Meanwhile, fixed income CEFs gained 2.56% and 3.44%,
respectively, in a flight to safety by investors.
At the beginning of the month investors were disappointed by a lower-thanexpected nonfarm payrolls report and a drop in both the ISM manufacturing
and nonmanufacturing indices. Better-than-anticipated gains in December
retail sales and inline gains in industrial production and capacity utilization
kept the bears at bay mid-month. However, a few earnings misses by such
firms as Intel and General Electric, accompanied with news that the January
HSBC China Manufacturing Purchasing Managers Index witnessed a
decline to 49.5—signaling a contraction, cast a pall over the international
markets. That weighed especially heavily on emerging markets at monthend, and it also pushed the DJIA to its sixth triple-digit loss for the month.

The Month in Closed-End Funds: Jan. 2014
•

For January only 9% of all closed-end funds
(CEFs) traded at a premium to their net asset
value (NAV), with 8% of equity funds and 9%
of fixed income funds trading in premium
territory. The World Equity CEFs macro-group
witnessed the largest widening of discounts for
the month—63 basis points (bps) to 10.76%.

•

Equity and fixed income CEFs continued on
separate paths in January, with equity funds
losing 1.57% on a NAV basis (registering their
first monthly loss since August 2013), while
their fixed income counterparts returned 2.56%
for the month.

•

For the first month in four all of Lipper’s
municipal bond CEF classifications posted
returns in the black, with California Municipal
Debt Funds (+4.35%) outpacing the other
classifications in the group. Municipal debt
CEFs (+3.95%) outpaced their domestic
taxable CEF counterparts (+1.27%) for the
month.

•

With greater scrutiny on emerging markets,
World Equity CEFs (-4.05%) and World
Income CEFs (-1.16%) lagged their domestic
and taxable counterparts, respectively, for
January.

As the CBOE Volatility Index climbed 51% from its closing low on January
12 (12.14) to 18.41 on January 31, investors’ rush to safety pushed Treasury
prices higher. The ten-year Treasury yield declined 37 bps on January 31,
down from its two-and-a-half-year high of 3.04% on December 31. Except
for the one-month yield, the Treasury yield curve shifted up, with the tenand twenty-year yields declining the most—37 bps each to 2.67% and
3.35%, respectively, on January 31.
For January the dollar strengthened against the euro (+2.03%) and the
pound (+0.76%), but it lost against the yen (-2.86%). For the month
commodities prices were mixed, with the near-month crude oil price
declining 0.94% to close the month at $97.49/barrel, while gold gained
3.18% to end the month at $1,240.10/ ounce.
For January 70% of all CEFs posted NAV-basis returns in the black, with
only 34% of equity CEFs and 93% of fixed income CEFs chalking up returns
in the plus column. U.S. stocks witnessed some deep losses during the
month as investor s fled equities and emerging-markets currencies in the
face of China’s manufacturing slowdown and renewed fears of deflation in
the Eurozone. This contributed to world equity CEFs’ (-4.05%) lagging
domestic equity CEFs (-1.05%), while the jump in yields pushed the mixedasset CEFs macro-group (+0.94%) to the top.

…your link with the Global Investment Community

Authored by:
TOM ROSEEN
HEAD OF RESEARCH
SERVICES
LIPPER, DENVER

3
Closed-End Funds Report

In their flight to safety investors bid up dividend payers and
gold-oriented funds, while punishing more risky plays. For
January only four of Lipper’s 15 equity CEF classifications
posted returns in the black. At the bottom of the charts were
CEFs that invest in less developed markets, with Emerging
Markets CEFs—suffering a 6.89% loss for the month—
bringing up the rear; it was bettered somewhat by Pacific exJapan CEFs (-4.42%). At the top of the charts were
December’s laggards, Real Estate CEFs (+2.32%) and Sector
Equity CEFs (+1.97%). With yields declining during the month
and municipal bond funds suffering a disproportionate share of
downside performance over the last several months, it wasn’t
all that surprising to see the municipal bond CEFs macrogroup (+3.95%) rising to the top of the fixed income macrogroup, outperforming taxable domestic bond CEFs (+1.27% on
a NAV basis) and world bond CEFs (-1.16%).

CLOSED-END FUNDS LAB

As investors became slightly risk averse during the month,
they began taking money off the table from CEF classifications
that were on a tear in 2013. On the domestic equity side Core
CEFs
(-3.18%,
December’s
leader)
and
Option
Arbitrage/Option Strategies CEFs (-2.63%) suffered the largest
losses for January. Investors pushed Income & Preferred
Stock CEFs (+1.45%) and Energy MLP CEFs (+2.64%) toward
the top of the charts. For the remaining equity classifications
returns ranged from minus 2.62% (Global CEFs) to minus
0.25% (Convertible CEFs).
Three of the five top-performing individual equity funds were
housed in Lipper’s Sector Equity CEFs classification.
However, at the top of the charts for January was RENN
Global Entrepreneurs Fund, Inc. (AMEX: RCG, housed in
Lipper’s Global CEFs classification, it was December’s second
worst performing CEF), gaining 9.32% on a NAV basis and
traded at a 44.96% discount at month-end. Following RCG
were ASA Gold & Precious Metals Limited (NYSE: ASA,
housed in Lipper’s Sector Equity CEFs classification), rising
7.89% on a NAV basis and traded at a 4.61% discount on
January 31, and H&Q Life Sciences Investors (NYSE: HQL,
also housed in Lipper’s Sector Equity CEFs classification),
posting a 7.57% return and traded at a 6.64% discount at
month-end. Following those two were H&Q Healthcare
Investors (NYSE: HQH), chalking up a 5.97% return and
traded at a 2.87% discount on January 31, and John
Hancock Preferred Income Fund II (NYSE: HPF, housed in
Lipper’s Income & Preferred Stock Fund classification), which
rose 5.45% and traded at a 5.98% discount at month-end.

April 2013

Source: Lipper, a Thomson Reuters company

For the month the dispersion of performance in individual
equity CEFs—ranging from minus 12.36% to positive 9.32%—
was much narrower than December’s spread and more
negatively skewed. The 20 top-performing equity funds posted
returns at or above 2.89%, while the 20 lagging funds were at
or below minus 6.02%.
For the month Aberdeen Emerging Markets Smaller
Company Opportunities Fund, Inc. (AMEX: ETF), housed in
Lipper’s Emerging Markets CEFs classification, was at the

…your link with the Global Investment Community

4
CEF Events and Corporate Actions

bottom of the equity CEFs group, shedding 12.36% of its December
month-end value and traded at a 9.91% discount at month-end.
Turkish Investment Fund, Inc. (NYSE: TKF, also warehoused in
Lipper’s Emerging Markets CEFs classification) was the next poorest
performing equity fund, declining 11.77% and traded at a 3.39%
discount at month-end. Eight of the ten worst performing funds in the
CEF universe were housed in Lipper’s Emerging Markets CEFs
classification.
For the first month since October 2013 all of Lipper’s municipal debt
CEF classifications posted plus-side NAV-based returns as investors
bid up the group in their flight to safely, scooping up tax-exempt
issues with yields exceeding those of similar-dated Treasuries before
tax adjustments. California Municipal Debt CEFs (+4.35%) and
General & Insured Municipal Debt CEFs (Leveraged) (+4.34%)
witnessed the largest returns of the group, while General & Insured
Municipal Debt CEFs (Unleveraged) (+2.64%) and Intermediate
Municipal Debt CEFs (+2.78%) were the relative laggards of the
group. The municipal debt CEFs macro-group (+3.95%) outperformed
its taxable domestic CEFs counterpart (+1.27%). National municipal
debt CEFs (+3.99%) slightly outpaced their single-state municipal
debt CEF counterparts (+3.91%).
As uncertainty continued to unfold in the world markets, both of the
classifications making up Lipper’s World Income Funds macroclassification (-1.16%) lagged the other taxable fixed income
classifications. Emerging Markets Debt Funds (-2.98%) took the worst
of the beatings, outdistanced by Global Income CEFs (-0.08%). With
interest rates dropping drastically during the month, December’s
leaders—the adjustable-rate Loan Participation CEFs classification
(+0.80%) and High Yield CEFs (+0.40%)—became the relative
laggards among the taxable fixed income CEFs classifications, while
U.S. Mortgage CEFs (+2.34%) and General Bond CEFs (+1.90%)
shot to the head of the class for January. Mixed economic reports
toward the end of the month, accompanied by disappointing Chinese
economic data, pushed yields lower. The two-/ten-year Treasury
spread narrowed 33 bps from December’s month-end 2.66%. The
yield on the ten-year Treasury note finished the month 37 bps lower
at 2.67%.
In the domestic taxable fixed income CEFs universe (+1.27%) the
remaining classification returns ranged from 0.90% (High Yield
[Leveraged] CEFs) to positive 1.70% (Corporate Debt BBB-Rated
[Leveraged] CEFs).
The two top-performing CEFs in the fixed income universe were
housed in Lipper’s General & Insured Municipal Debt (Leveraged)
CEFs classification: BlackRock Municipal Target Term Trust
(NYSE: BTT) rose 7.09% and traded at a 6.47% discount on January
31, and Eaton Vance Municipal Income Term Trust (NYSE: ETX)
tacked 6.70% onto its December month-end value and traded at a
6.47% discount at January month-end. Following those two was
NexPoint Credit Strategies Fund (NYSE: PHD, housed in Lipper’s
High Yield [Leveraged] CEFs classification), posting a 6.62% return
and traded at a 13.80% discount at month-end.
For the remaining funds in the fixed income CEFs universe monthly

NAV-basis performance ranged from minus 6.64% (Morgan Stanley
Emerging Markets Domestic Debt Fund, Inc. [NYSE: EDD], housed in
Lipper’s Emerging Markets CEFs classification and traded at a
13.13% discount on January 31) to 6.53% for Eaton Vance Municipal
Income Trust (NYSE: EVN), housed in Lipper’s General & Insured
Municipal Debt (Leveraged) CEFs classification and traded at a
3.73% premium at month-end. The 20 top-performing fixed income
CEFs posted returns at or above 4.88%, while the 20 lagging funds
were at or below minus 0.44%.
PREMIUM AND DISCOUNT BEHAVIOR
For January the median discount of all CEFs narrowed 32 bps to
8.34%—lower than the 12-month moving average discount (6.04%).
Equity CEFs’ median discount narrowed 13 bps to 9.64%, while fixed
income CEFs’ median discount narrowed 74 bps to 7.55%. Municipal
bond CEFs’ median discount narrowed 121 bps to 7.20%. The World
Equity CEFs macro-classification witnessed the largest widening of
discounts in the CEF universe—just 63 bps to 10.76%.
For the month 60% of all funds’ discounts or premiums improved,
while 38% worsened. In particular, 48% of equity funds and 68% of
fixed income funds saw their individual discounts narrow, premiums
widen, or premiums replace discounts. The number of funds traded at
premiums on January 31 (51) was five more than on December 31.
CEF EVENTS AND CORPORATE ACTIONS
IPOs
There were no new CEFs launched in January.
RIGHTS, REPURCHASES, TENDER OFFERS
A tender offer measurement period for The Central Europe, Russia
and Turkey Fund (NYSE: CEE), The European Equity Fund
(NYSE: EEA), and The New Germany Fund (NYSE: GF) will run
from April 7, 2014, to Friday, June 27, 2014. Each fund will conduct a
tender offer if its sharesApril 2013 an average discount of more than
trade at
10% during the 12-week measurement period. In addition, directors of
CEE approved a 700,000-share increase to the previously announced
share repurchase authorization, resulting in a total authorization of
1,400,000 shares for repurchase through July 31, 2014.
Final results of the semiannual repurchase offer for up to 5%
(189,000) of the shares of The Asia Tigers Fund (NYSE: GRR) saw
approximately 1.3 million shares tendered; on a pro rata basis 14.9%
of the tendered shares were accepted for payment.
The Swiss Helvetia Fund (NYSE: SWZ) is offering to purchase up to
15% of its common shares at 95% of NAV until February 11, 2014,
unless extended. If more than 15% of the fund’s shares are tendered,
the fund will purchase them on a pro rata basis.
MERGERS AND REORGANIZATIONS
Directors approved a proposal to merge Tortoise Energy Capital
Corp. (NYSE: TYY) and Tortoise North American Energy Corp.
(NYSE: TYN) into Tortoise Energy Infrastructure Corp. (NYSE:
TYG). The mergers are expected to be concluded in second quarter
2014, subject to shareholder approval.

…your link with the Global Investment Community

5
CEF Events and Corporate Actions

Shareholders of Nuveen Pennsylvania Premium
Income Municipal Fund 2 (NYSE: NPY), Nuveen
Pennsylvania Dividend Advantage Municipal Fund
(NYSE: NXM), and Nuveen Pennsylvania Dividend
Advantage Municipal Fund 2 (NYSE: NVY) approved
the reorganization of their funds into Nuveen
Pennsylvania Investment Quality Municipal Fund
(NYSE: NQP). The reorganization is expected to be
complete Monday, February 10, 2014.
Sometime in the second quarter shareholders of
American Strategic Income Portfolio (NYSE: ASP)
and American Select Portfolio (NYSE: SLA) will be
asked to approve a proposal to reorganize the funds
into a newly organized CEF managed by Nuveen. If the
reorganizations are approved, the new combined fund
will move to the Nuveen Funds CEF platform.
Shareholders of AllianzGI Global Equity &
Convertible Income Fund (NYSE: NGZ) and
AllianzGI Equity & Convertible Income Fund (NYSE:
NIE) approved the reorganization of NGZ into NIE; the
merger was completed at the end of January.
OTHER
Nuveen Global Value Opportunities Fund (NYSE:
JGV) changed its name to Nuveen Global Equity
Income Fund (same ticker).
Alpine Total Dynamic Dividend Fund (NYSE: AOD)
and Alpine Global Dynamic Dividend Fund (NYSE:
AGD) each had a one-for-two reverse share split. The
funds’ shares will trade under new CUSIP numbers of
021060207 for AOD and 02082E205 for AGD.
Directors of Western Asset Inflation Management
Fund (NYSE: IMF) adopted a proposal to liquidate and
dissolve the fund. Shareholders will be asked to
approve the plan at their annual meeting scheduled for
April 25, 2014.

Click here to join

Directors of Morgan Stanley Asia-Pacific Fund
(NYSE: APF) approved changing the fund’s investment
strategy; it will no longer invest in equity securities of
issuers located in Japan. Accordingly, the board
approved changing the fund’s benchmark to the MSCI
All Country Asia Pacific ex-Japan Index. The portfolio
management team will also change.
Chartwell Investment Partners, subadvisor to First
Trust Dividend and Income Fund (NYSE: FAV) and
First Trust Enhanced Equity Income Fund (NYSE:
FFA), has agreed to be purchased by TriState Capital
Holdings; the transaction is expected to close in first
quarter 2014. New subadvisory agreements will be
submitted later this year to shareholders of each fund
for approval.

Authored by:
JEFF TJORNEHOJ
HEAD OF LIPPER
AMERICAS RESEARCH
LIPPER, DENVER

AllianceBernstein Income Fund (NYSE: ACG)
announced that prior to the end of 2013 it received
written requests from persons purporting to own in
excess of 10% of the fund’s shares that the fund submit
a proposal to convert from a CEF to an open-end
investment company.
First Trust Strategic High Income Fund II (NYSE:
FHY) booked a reserve for potential costs and
expenses related to a class action lawsuit filed against it
by Lehman Brothers Special Finance. Based on the
current status of the litigation, FHY booked a reserve
that will result in a $0.44/share reduction in NAV and
warns there is no assurance this amount will be
sufficient to cover the ultimate costs of litigation.
© Thomson Reuters 2014. All Rights Reserved. Lipper FundMarket Insight
Reports are for informational purposes only, and do not constitute
investment advice or an offer to sell or the solicitation of an offer to buy any
security of any entity in any jurisdiction. No guarantee is made that the
information in this report is accurate or complete and no warranties are made
with regard to the results to be obtained from its use. In addition, Lipper, a
Thomson Reuters company, will not be liable for any loss or damage resulting
from information obtained from Lipper or any of its affiliates. For immediate
assistance, feel free to contact Lipper Client Services toll-free at 877.955.4773
or via email at LipperClientServices@ thomsonreuters.com. For more
information about Lipper, please visit our website at www.lipperweb.com.

Join our “Closed-End Fund and
ETF Forum” group on LinkedIn for
the latest discussions on trends,
developments and challenges in
…yourCEF and ETF industries.Investment
the link with the Global

Follow us!

Community

…your link with the Global Investment Community

Follow us on Twitter.
Your source to the
CEF
&
ETF
industries.

6

6
CEF Performance Statistics

Average of Average of Average
1MO NAV 1MO MKT
P/D
Change
Change 12/31/2013

Category

Average
P/D
1/31/2014

Average 1
MO P/D
Change

Average
YTD NAV
Change

Average
YTD MKT
Change

Average
YTD P/D
Change

High Yield Funds

0.1%

-0.3%

-$7.58

-$7.05

$0.53

0.1%

-0.3%

$0.53

General Bond Funds

-1.3%

-1.7%

-$3.61

-$4.13

-$0.52

-1.3%

-1.7%

-$0.52

Energy MLP Funds

0.0%

1.9%

-$1.76

-$3.55

-$1.79

0.0%

1.9%

-$1.79

Natural Resources Funds

2.4%

2.2%

-$10.55

-$10.61

-$0.06

2.4%

2.2%

-$0.06

Sector Equity Funds

-1.7%

-1.4%

-$6.56

-$7.08

-$0.52

-1.7%

-1.4%

-$0.52

Emerging Markets Funds

9.2%

9.0%

-$8.34

-$6.95

$1.39

9.2%

9.0%

$1.39

Utility Funds

0.6%

0.4%

-$7.48

-$7.22

$0.26

0.6%

0.4%

$0.26

Pacific Ex Japan Funds

4.7%

5.7%

-$9.40

-$10.25

-$0.85

4.7%

5.7%

-$0.85

Core Funds
Global Income Funds

3.8%
0.7%

-0.4%
0.9%

-$9.18
-$8.13

-$9.11
-$8.26

$0.07
-$0.13

3.8%
0.7%

-0.4%
0.9%

$0.07
-$0.13

Income & Preferred Stock Funds

-1.0%

-0.8%

-$8.30

-$8.47

-$0.17

-1.0%

-0.8%

-$0.17

Corporate Debt Funds BBB-Rated

-1.0%

-1.3%

-$10.06

-$9.77

$0.29

-1.0%

-1.3%

$0.29

U.S. Mortgage Funds
General & Insured Muni Fds
(Unleveraged)

-1.9%

-2.3%

-$9.36

-$9.03

$0.33

-1.9%

-2.3%

$0.33

-2.2%

-3.5%

-$5.38

-$4.10

$1.28

-2.2%

-3.5%

$1.28

Value Funds

2.5%

4.5%

-$10.49

-$11.74

-$1.25

2.5%

4.5%

-$1.25

New Jersey Municipal Debt Funds

-3.4%

-3.3%

-$9.78

-$9.80

-$0.02

-3.4%

-3.3%

-$0.02

Intermediate Municipal Debt Funds

-2.3%

-3.2%

-$4.59

-$3.66

$0.93

-2.3%

-3.2%

$0.93

Real Estate Funds

-1.9%

-2.7%

-$11.24

-$10.05

$1.19

-1.9%

-2.7%

$1.19

Pennsylvania Municipal Debt Funds
Emerging Mrkts Hard Currency Debt
Funds

-3.3%

-4.7%

-$11.59

-$10.16

$1.43

-3.3%

-4.7%

$1.43

3.6%

4.8%

-$10.00

-$11.09

-$1.09

3.6%

4.8%

-$1.09

Other States Municipal Debt Funds

-3.3%

-4.2%

-$8.91

-$8.34

$0.57

-3.3%

-4.2%

$0.57

California Municipal Debt Funds
General & Insured Muni Debt Funds
(Lever

-3.7%

-4.8%

-$5.87

-$4.74

$1.13

-3.7%

-4.8%

$1.13

-3.7%

-5.2%

-$6.95

-$5.45

$1.50

-3.7%

-5.2%

$1.50

Options Arbitrage/Opt Strategies Funds

2.9%

2.0%

-$7.19

-$6.31

$0.88

2.9%

2.0%

$0.88

Developed Market Funds
Corporate BBB-Rated Debt
Funds(Leveraged

3.0%

3.4%

-$9.19

-$9.50

-$0.31

3.0%

3.4%

-$0.31

-1.5%

-1.7%

-$8.49

-$8.35

$0.14

-1.5%

-1.7%

$0.14

New York Municipal Debt Funds

-2.8%

-3.8%

-$6.45

-$5.51

$0.94

-2.8%

-3.8%

$0.94

Global Funds

3.4%

4.1%

-$10.89

-$11.38

-$0.49

3.4%

4.1%

-$0.49

Convertible Securities Funds

0.6%

-0.9%

-$7.54

-$5.92

$1.62

0.6%

-0.9%

$1.62

Loan Participation Funds

-0.4%

-0.2%

-$5.01

-$5.22

-$0.21

-0.4%

-0.2%

-$0.21

High Yield Funds (Leveraged)

-0.4%

-0.6%

-$6.30

-$6.10

$0.20

-0.4%

-0.6%

$0.20

High Yield Municipal Debt Funds

-2.7%

-5.3%

-$3.75

-$0.97

$2.78

-2.7%

-5.3%

$2.78

Growth Funds

2.5%

3.3%

-$4.11

$8.47

$12.58

2.5%

3.3%

$12.58

…your link with the Global Investment Community

7
Top 5 Performing CEFs

Ticker
Symbol

1-Month NAV
Change

Rank

TKF

46%

1

Emerging Markets Funds

ETF

14%

2

Emerging Markets Funds

XCH

13%

3

Aberdeen Latin America

Emerging Markets Funds

LAQ

13%

4

Central Euro Russia & Tu

Emerging Markets Funds

CEE

12%

5

Fund Name

Category

Ticker
Symbol

Year-to-Date
NAV Change

Rank

Turkish Investment Fund

Emerging Markets Funds

TKF

46%

1

Aberdeen EM SmCo Opptys

Emerging Markets Funds

ETF

14%

2

Aberdeen Chile

Emerging Markets Funds

XCH

13%

3

Aberdeen Latin America

Emerging Markets Funds

LAQ

13%

4

Central Euro Russia & Tu

Emerging Markets Funds

CEE

12%

5

Fund Name

Category

Ticker
Symbol

1-Month
Market Change

Rank

Turkish Investment Fund

Emerging Markets Funds

TKF

47%

1

Gabelli Multimedia Trust

Global Funds

GGT

16%

2

Aberdeen EM SmCo Opptys

Emerging Markets Funds

ETF

12%

3

Central Euro Russia & Tu

Emerging Markets Funds

CEE

12%

4

Aberdeen Latin America

Emerging Markets Funds

LAQ

12%

5

Fund Name

Category

Ticker
Symbol

Year-to-Date
Market Change

Rank

Turkish Investment Fund

Emerging Markets Funds

TKF

47%

1

Gabelli Multimedia Trust

Global Funds

GGT

16%

2

Aberdeen EM SmCo Opptys

Emerging Markets Funds

ETF

12%

3

Central Euro Russia & Tu

Emerging Markets Funds

CEE

12%

4

Aberdeen Latin America

Emerging Markets Funds

LAQ

12%

5

Fund Name

Category

Ticker
Symbol

1-Month P/D
Change

Rank

DoubleLine:Oppor Crdt Fd

General Bond Funds

DBL

$5.19

1

BlackRock MuniVest

General & Insured Muni Debt Funds (Leveraged)

MVF

$4.31

2

Nuveen Muni Hi Inc Opp

High Yield Municipal Debt Funds

NMZ

$4.18

3

Federated Prem Muni Inc

General & Insured Muni Debt Funds (Leveraged)

FMN

$4.16

4

Invesco Tr Inv Grd NY

New York Municipal Debt Funds

VTN

$3.81

5

Fund Name

Category

Ticker
Symbol

Year-to-Date
P/D Change

Rank

DoubleLine:Oppor Crdt Fd

General Bond Funds

DBL

$5.19

1

BlackRock MuniVest

General & Insured Muni Debt Funds (Leveraged)

MVF

$4.31

2

Nuveen Muni Hi Inc Opp

High Yield Municipal Debt Funds

NMZ

$4.18

3

Federated Prem Muni Inc

General & Insured Muni Debt Funds (Leveraged)

FMN

$4.16

4

Invesco Tr Inv Grd NY

New York Municipal Debt Funds

VTN

$3.81

5

Fund Name

Category

Turkish Investment Fund

Emerging Markets Funds

Aberdeen EM SmCo Opptys
Aberdeen Chile

…your link with the Global Investment Community

8
Global ETP Monthly Overview

Highlights (US$):1,2

GLOBAL EQUITY CUMULATIVE ETP FLOWS1
2014 YTD New Flows ($10.8bn) vs. 2013 Net Flows: $247.7bn

The Global ETP Industry registered outflows of ($9.7bn) in January
following average inflows of just under $30bn during the previous four
months. The industry again enabled investors to quickly react to
changing market sentiment at the outset of 2014. The impact on both
market returns and ETP flows in January was reminiscent of 2010 and
had the greatest impact on equities, particularly US and Emerging
Markets exposures. Other areas of the Equity ETP landscape such as
European and Japanese exposures continued to benefit from healthy
investor appetite as they did in 2013.
The Emerging Markets Equity outflows of ($10.0bn) for the month
were triggered largely by two factors. A softer-than-expected Chinese
manufacturing PMI reading of 49.6 signaled economic contraction and
confirmed lingering fears of a slowdown in domestic demand.5
Additional pressure during January came from ongoing tapering, which
was confirmed when the Fed announced a reduction of purchases by
another $10bn per month to $65bn. A number of central banks in
developing countries have tried to stem the general flight to quality by
raising interest rates, but this has largely served to increase worries
over growth and stability for weaker economies. The result is that
investors have pulled back from Emerging Markets in favor of other
investment themes as the category continues to see a correction
following its popularity in the wake of the financial crisis. ETP outflows
in January were heavily concentrated in iShares MSCI Emerging
Markets (EEM) with ($5.5bn) and Vanguard FTSE Emerging Markets
(VWO) with ($2.9bn). In January the MSCI Emerging Markets Index
experienced a decline of (6.6%), greater than the (5.0%) for all of
2013.6 Longer term, growth prospects for Emerging Markets remain
attractive relative to the developed world. However, the current market
environment is indicative of the volatility of investing in Emerging
Markets and favors careful country selection as opposed to broadbased investment.

US Equity

Pan European Equity

Japan Equity

Other Developed

EM Equity

PAN EUROPEAN EQUITY FLOWS1
2014 YTD Net Flows: $4.0bn vs. 2013 Annual $26.5bn

US Equity outflows of ($12.0bn) in January were impacted by the
Emerging Markets volatility but also reflected concerns over valuations

Europe Listed

US Listed

Other Regions

HISTORICAL JANUARY GLOBAL ETP FLOWS1
37.0

40
33.5

EQUITY ETP FLOWS: JANUARY 2010 VS. JANUARY 20141,6
(Flows in US $billions)
January 2010

January 2014

Index

Return

Flows

Return

Flows

US Large Cap

S&P 500

(3.7%)

(18.4)

(3.6%)

(15.9)

Emerging Markets

MSCI EM

(5.6%)

1.1

(6.6%)

(10.0)

(4.4%)

2.7

(4.1%)

11.2

13.9

20

Equity Category

Non-US Developed Markets MSCI EAFE

(13.3)

0

(9.7)

-20
2010
Equity

2011
Fixed Income

2012

2013

Commodity

2014
Other

Source: BlackRock

…your link with the Global Investment Community

9
Global ETP Monthly Overview (cont’d)

Highlights (US$):1,2
after last year’s impressive stock market performance. While the S&P
500 gained 29.6% in 2013 propelled by investor optimism, it has
started the year down (3.6%) indicating wariness that the market can
continue its run.6 Also, fourth quarter earnings have not lived up to
expectations in general given continued signs of an improving
economy. Initial Q4 GDP growth estimates of 3.2% annualized7
(following 4.1% in Q3) indicated continued improvement in consumer
demand and business investment. The US Equity ETP outflows were
concentrated in Large Cap with ($15.9bn), the majority from SPDR
S&P 500 (SPY) which shed ($14.6bn). All other US Equity inflows were
modest but positive at $3.8bn, driven by well-diversified Sector inflows
of $2.9bn. Health Care led with $1.2bn and Technology added $1.0bn.

JANUARY RESULTS AT A GLANCE1
(US $billions)
January
2014

December
2013*

January
2013

January
2012

Monthly Flows

(9.7)

24.2

37.0

33.5

Assets

2,321

2,396

2,044

1,651

# of ETPs

5,025

4,988

4,788

4,411

Jun-Dec 2013 restated with minor corrections to Europe data and delisting adjustments

GLOBAL 13-MONTH ROLLING NET FLOWS1
2014 YTD Net Flows: ($9.7bn) vs. 2013 Net Flows: $235.7bn
(US$bn)

Pan-European Equity had another month of attractive flows – its
seventh in a row – contributing $4.0bn. Investors continue to look to the
region due to its improving economic growth outlook as well as for
return prospects given already strong gains in the US. The preliminary
January eurozone PMI reading of 53.2 was the best since June 2011
and was highlighted by German manufacturing.8 Broad-Based
Developed Markets Equity (Global/Global ex-US) flows of $3.7bn and
Japanese Equity flows of $4.0bn also reinforced the current focus on
non-US exposures. The Japanese flows included $1.2bn from Bank of
Japan stimulus-related purchases.
Fixed Income ETP flows in January remained moderate but positive at
$3.3bn led by Short-maturity funds with $1.9bn but also including
inflows for Intermediate and Long-term maturities. European exposures
were the key driver with $1.7bn. In the US, the recent flight to quality
has led to a drop in the 10-Year Treasury rate to 2.64%9 and modest
Treasury ETP inflows.

Equity

Fixed Income

CUMULATIVE EQUITY ETP FLOWS1

CUMULATIVE FIXED INCOME ETP FLOWS1

2014 YTD Equity Flows: ($10.8bn)

Commodities & Others

2014 YTD Fixed Income Flows: $3.3bn

Source: BlackRock

…your link with the Global Investment Community

10
Milestone -5,000 ETPs

Highlights (US$):1,2

GLOBAL ETP ASSETS & NUMBER OF ETPS BY YEAR1

Global ETPs listings have exceeded 5,000 for the first time in history.
It’s a remarkable milestone considering it took the industry more than
15 years to reach its first 2,000 products but only six more years to
reach 5,000.
For comparison, the US mutual fund industry took nearly 50 years to
reach the 2,000 mark in the late 80s and another eight years to reach
5,000.
•

•

•

•

•

Regionally speaking, the US accounts for the largest share of ETP
assets (71% or $1.6 trillion) while Europe has most products
available on the market (2,141 or 43%). ETP providers also
launched more products in Europe in the last five years than any
other region. However, for 2013 alone, US has seen 158 new
ETPs, eight more than in Europe. Asia Pacific on the other hand
has the highest growth rate in the past five years, as the number of
ETPs quadrupled.

# ETPS LAUNCHED PER YEAR PER REGION1
(Primary Listings only, excluding Individual Share Classes)

Asia Pacific

The speed of new launches has moderated since 2012. Total new
launches (excluding share classes) in 2013 totaled 430, with
$26.4bn gathered within the year. That is considerably less than the
$37.1bn gathered during 2010 across 929 new funds but ahead of
2011 when 876 new products finished that year with only $23.6bn in
assets.

Canada
Latin America
Middle East
& Africa

Looking at asset classes, EM Equity and Fixed Income maintained
their pace of new launches in 2013. However, commodity funds
dwindled as the end of the commodity super cycle and consistent
outflows from existing ETPs last year took a toll on the pipeline.
Product rationalization has doubled to around 200 per year in 2012
and 2013, up from the 100 redemptions seen on average each year
since 2009. The majority of fund closures come from the US and
Europe. There were 119 funds delisted in Europe in 2013, whereas
in the US only 67 ETPs closed.

Europe
US

# ETPS LAUNCHED PER YEAR PER ASSET CLASS1
(Primary Listings only, excluding Individual Share Classes)

The top three ETP providers globally have maintained their ETP
launches in recent years, averaging 95 new funds per year since
2006. The majority of the new funds globally are from smaller
providers.

Others
Commodities
Fixed Income
EM Equity
Developed
Equity

Source: BlackRock

…your link with the Global Investment Community

11
Global ETP Year-To-Date Overview

GLOBAL ETP YTD FLOWS BY EXPOSURE1
(US$bn)

Jan 2014

Jan 2013

Annual
2013

GLOBAL ETP CUMULATIVE NET FLOWS1
2014 YTD Flows ($9.7bn) vs. 2013 Net Flows: $235.7bn

GLOBAL EQUITY ETP FLOWS BY EXPOSURE1
2014 Jan Net Flows ($10.8bn) vs. 2013 Jan Net Flows $34.5bn

January 2014

January 2013
Source: BlackRock

…your link with the Global Investment Community

12
Largest Year-to-Date Fund Inflows and Outflows

ETPs as of January 2014 (US$mn)1

Bloomberg Ticker

ETPs as of January 2014 (US$mn)1

Bloomberg Ticker

2014 YTD
Inflows

2014 YTD
Outflows

Jan-14
Assets

Jan-14
Assets

Source: BlackRock

…your link with the Global Investment Community

13
Largest Asset Gathering ETPs Launched in 2014

Highlights (US$):1
 47 new ETPs and 3 individual share class listings debuted

around the globe so far this year and have accumulated
$1.0bn in assets

Product Name (US$mn)1

Bloomberg
Ticker

 10 products and 2 individual share class listings were

delisted this year with combined assets of less than $40mn

Exposure

Listing
Region

Others

Launch
Date

Assets as of
Jan-2014

128.7

Source: BlackRock

…your link with the Global Investment Community

14
Global ETP by Exposure – Developed Equity

Exposure (US$mn)

Jan 2014
Net
Flows

1

Large Cap
Mid Cap
Small Cap
Micro Cap
US Size and Style
Total Market
Extended Market
Preferred Stock
US Size and Style Total
Basic Materials
Consumer Cyclicals
Consumer Non-cyclicals
Energy
Financials
Health Care
US Sector
Industrials
Real Estate
Technology
Telecommunications
Utilities
Theme
US Sector Total
US Strategy
US Total
Canada Equity
North America Regional Equity
North America Total
Large Cap
Mid Cap
Pan European
Small Cap
Size and Style
Total Market
Pan European
Size and Style Total
Pan European Sector
Pan European Strategy
Pan European Total
Germany

2014 YTD
Net
Flows

% of
2014 YTD
Flows

Assets

% of
Assets

# ETPs

(15,878)
628
(2,297)
24
1,911
150
(121)
(15,581)
498
(1,047)
(115)
312
(490)
1,190
86
854
1,035
107
464
6
2,901
649
(12,031)
(728)
277
(12,482)
337
(46)
543
2,709

(15,878)
628
(2,297)
24
1,911
150
(121)
(15,581)
498
(1,047)
(115)
312
(490)
1,190
86
854
1,035
107
464
6
2,901
649
(12,031)
(728)
277
(12,482)
337
(46)
543
2,709

163.4
(6.5)
23.6
(0.2)
(19.7)
(1.5)
1.2
160.3
(5.1)
10.8
1.2
(3.2)
5.0
(12.2)
(0.9)
(8.8)
(10.7)
(1.1)
(4.8)
(0.1)
(29.9)
(6.7)
123.8
7.5
(2.9)
128.5
(3.5)
0.5
(5.6)
(27.9)

454,811
83,620
84,477
1,105
65,192
4,064
12,241
705,509
7,568
14,566
9,675
32,683
30,807
27,281
15,088
29,764
26,023
1,130
7,400
1,109
203,094
69,253
977,856
30,648
8,182
1,016,686
43,374
1,178
3,873
48,246

19.6
3.6
3.6
0.0
2.8
0.2
0.5
30.4
0.3
0.6
0.4
1.4
1.3
1.2
0.7
1.3
1.1
0.0
0.3
0.0
8.8
3.0
42.1
1.3
0.4
43.8
1.9
0.1
0.2
2.1

238
49
70
4
64
2
5
432
15
19
13
45
39
30
18
24
28
6
13
8
258
65
755
88
21
864
82
9
12
69

3,541

3,541

(36.4)

96,600

4.2

170

455
28
4,026
(310)

455
28
4,026
(310)

(4.7)
(0.3)
(41.4)
3.2

13,964
3,211
113,847
39,562

0.6
0.1
4.9
1.7

151
20
343
65

23

23

(0.2)

20,660

0.9

52

(123)
(80)

(123)
(80)

1.3
0.8

10,228
5,684

0.4
0.2

23
18

758

758

(7.8)

12,335

0.5

67

268

268

(2.8)

88,469

3.8

225

4,294
(295)
4,023

4,294
(295)
4,023

(44.2)
3.0
(41.4)

202,316
15,359
139,132

8.7
0.7
6.0

568
60
243

Asia Pacific Total

3,729

3,729

(38.4)

154,491

6.7

303

Broad-Based Global /Global ex-US
Developed Equity Total

3,660
(799)

3,660
(799)

(37.7)
8.2

199,100
1,572,594

8.6
67.8

458
2,193

U.K.
Switzerland
France

Country

Others
Europe Single Country
Total
Europe Total
Regional
Country

Asia-Pacific

Source: BlackRock

…your link with the Global Investment Community

15
Endnotes

Endnotes: BlackRock’s ETP Landscape: Monthly Highlights report
"ETP" (or exchange traded product) as referred to above means any portfolio exposure security that trades intraday on a US exchange. ETPs include exchange traded funds
(ETFs) registered with the SEC under the Investment Company Act of 1940 (open-end funds and unit investment trusts or UITs) and certain trusts, commodity pools and exchange
traded notes (ETNs) registered with the SEC under the Securities Act of 1933.
The data for this report are captured from a number of sources by the BlackRock Investment Institute including provider websites, fund prospectuses, provider press releases,
provider surveys, Bloomberg, the National Stock Exchange, Strategic Insight Simfund, Wind and the Bank of Israel. All amounts are reported in US dollars. Flows are derived using
daily net asset values and shares outstanding using the most recent data we can capture at month-end. For products with cross-listings, we attribute net flows and assets to the
primary listings. For Middle East and Africa, net flows data is not available. Assets are derived using shares outstanding and prices at the end of each month (or the closest date
available). Where price is not available, we use an approximation. For ETPs listed in Israel, product level detail is not available. Product level information is aggregated by provider,
asset class, exposure, region listed and replication method to produce the various analyses in the report
1.

2.

3.
4.

5.
6.
7.
8.
9.

Data is as of January 30, 2014 for Europe and January 31, 2014 for the US, Canada, Latin America, Israel, and some Asia ETPs. Some Asia ETP data is as of December
31, 2013. Global ETP flows and assets are sourced using shares outstanding and net asset values from Bloomberg for the US, Canada, Europe, Latin America and some
ETPs in Asia. Middle East ETP assets are sourced from the Bank of Israel. ETP flows and assets in China are sourced from Wind. Inflows for years prior to 2010 are
sourced from Strategic Insights Simfund. Asset classifications are assigned by the BlackRock based on product definitions from provider websites and product prospectuses.
Other static product information is obtained from provider websites, product prospectuses, provider press releases, and provider surveys. Market returns are sourced from
Bloomberg.
We classify maturity buckets of a Fixed Income ETP if the fund invests at least 70% of its assets in the corresponding maturity/exposure range: Short maturity includes:
underlying security maturities < 3 years and floating rate where the fund holds floating rate securities and/or bank loans. Intermediate includes: 3 years < underlying security
maturities < 10 years. The “other” category includes Long-Term: underlying security maturities > 10 years; Broad Maturities: The fund invests in more than two maturity
buckets without emphasizing one; Selected Maturities: The fund holds securities with multiple selected range of maturity buckets, i.e. barbell strategy which focuses on the
specific short-term and long-term buckets with even weights; and Fixed Maturity: The fund itself has a target maturity date and arranged holdings correspondingly.
Source: BlackRock, Bloomberg, Reuters
Mutual fund data is sourced from EPFR (excluding Money Market funds and ETFs). 2013 date is sourced from EPFR monthly data. January 2014 data is sourced from
EPFR weekly data for the four weeks ended January 29, 2014. Money Market mutual fund flows is sourced from EPFR weekly data for the four weeks ended January 29,
2014.
Source: HSBC
Source: Bloomberg (S&P 500, MSCI EM and MSCI EAFE index returns in US dollars)
Source: US Bureau of Economic Analysis (BEA)
Source: Markit
Source: Bloomberg (US Treasury Generic 10 Year yield index)

Disclosures:
(c) 2014 BlackRock, Inc. All rights reserved. Reprinted with permission. The ETF Sector Review is for informational purposes only, and does not constitute investment advice or
an offer to sell or the solicitation of an offer to buy any security of any entity in any jurisdiction. The ETF Sector Review represents an assessment of the market environment at a
specific time and is not intended to be relied upon by the reader as research, a forecast of future events or a guarantee of future results.
The ETF Sector Review does not provide financial, investment or tax advice or information relating to the securities of any particular fund or other issuer. The information and
opinions included are based on publicly available information, are subject to change and should not be relied upon for any purpose other than general information and education.
This Review has been prepared without regard to the individual financial circumstances and objectives of those who receive it and the types of securities discussed in this
publication may not be suitable for all investors.
The information included in the ETF Sector Review has been taken from trade and other sources considered to be reliable. This document is published in good faith but no
representation or warranty, express or implied, is made by BlackRock or by any person as to its accuracy or completeness and it should not be relied on as such. BlackRock or any
of its directors, officers, employees or agents shall have no liability for any loss or damage arising out of the use or reliance on the material provided including without limitation, any
loss of profit or any other damage, direct or consequential. Any opinions expressed in this document reflect our analysis at this date and are subject to change.

…your link with the Global Investment Community

16
Closed-End Funds Report & Rating Actions

Fitch: Investors Sell Puerto Rico Bonds; PRICA Adds
February 12, 2014
Uncertainty
Authored by:
Fitch Ratings-New York-12 February 2014: Pressure
on US mutual funds to sell Puerto Rico (PR) bonds
could contribute to deteriorating capital markets for
the commonwealth's debt, Fitch says. Tuesday's
credit downgrade and recent updates to the Puerto
Rico Investment Company Act of 2013 (PRICA) may
introduce additional selling pressures by mutual funds
operating out of PR. Funds already cut their exposure
to PR bonds significantly in the second half of 2013.
Fitch Tuesday downgraded PR general obligation and
certain GO-linked credits to 'BB' from 'BBB-', resolving
a negative rating watch from Nov 14, 2013. COFINA
sales tax bonds, the island's top credit, remained at
'AA-/A+'.

US mutual funds have already sold much of their PR
municipal bond holdings since May 2013. Fitch
reviewed holdings of 92 Fitch rated municipal closedend funds across 6 large asset managers. The group
cut their PR exposure, on average, by more than 65%
through Dec 2013, with two managers exiting their
holdings entirely.

Yuriy Layvand, CFA
Director, Fund and Asset
Management
+1 212 908-9191

Kellie Geressy-Nilsen
Senior Director, Fitch Wire
+1 212 908-9108

US mutual funds have historically invested in PR
bonds because of its triple tax-exempt status and
good liquidity compared to eligible non-PR issues. For
example, a single-state fund investing in bonds
exempt from Federal and New York State income tax
might have 95% New York State municipal bonds and
5% PR municipal bonds.

Fitch: New Puerto Rico Fund Regulations Modest Credit
Positive
January 29, 2014
Fitch Ratings-New York-29 January 2014: The new
Puerto Rico Investment Companies Act of 2013
makes several improvements to the regulatory
oversight of the island's $11billion-plus fund industry
that are modestly credit positive for rated short- and
medium-term notes issued by Puerto Rican closedend funds (PR CEFs), according to Fitch Ratings.
The act revamps compliance and governance rules,
allows for greater diversification outside of Puerto
Rico, establishes formal fund leverage limits, creates
a new type of tax-advantaged structure, and
mandates all rulings by the Commissioner of Financial
Institutions be made public going forward, according
to local law firm López Sánchez Pirillo & Hymovitz,

which specializes in this area.

Authored by:
Yuriy Layvand, CFA

Existing funds are for the most part grandfathered in
the Investment Companies Act of Puerto Rico of 1954
(Old Law), except for having to comply with new rules
with respect to affiliate transactions, tighter
governance over fund directors and officers, and
uniformity over repurchasing fund stock from
investors. These changes closer align local
investment companies with protections already in
place for U.S. mutual funds under the U.S. Investment
Company Act of 1940, as amended. Moreover,
shareholder approval is needed to convert existing
funds to the new law, which may prove challenging.

Director, Fund and Asset
Management
+1 212 908-9191

Ian Rasmussen
Senior Director
Fund and Asset Management
+1 212 908-0232

Kellie Geressy-Nilsen
Senior Director, Fitch Wire
+1 212 908-9108

Rating Actions
To access the complete rating action, please click on the links below.
•

Fitch Rates & Affirms Preferred Shares of Nuveen Pennsylvania Investment Quality Muni Fund on Merger – January 10, 2014

•

Fitch Rates Kayne Anderson MLP Investment Co's Sr Notes 'AAA'; Affirms Existing Ratings – February 10, 2014

•

Fitch Affirms Clearbridge Closed-End Fund Notes at 'AAA – February 6, 2014

•

Fitch Rates Auction Rate Preferred Shares of Four Gabelli Equity Closed-End Funds 'AA' – January 28, 2014

…your link with the Global Investment Community

17
CEF Commentary

The Power of Closed-End Fund Distributions
January 21, 2014
Albert Einstein once said, “Compound interest is the
eighth wonder of the world. He who understands it,
earns it ... he who doesn't ... pays it.” Long-term
investors in closed-end funds (CEFs) are keenly aware
of this principle. The majority of CEFs have the goal of
distributing current income as their primary investment
objective and historically the majority of a CEF’s total
return has come from the distributions it makes. This
doesn’t mean an individual CEF or category of CEFs
cannot earn capital appreciation along with
distributions, rather as the data below indicates it simply
means over long periods of time the majority of the total
return CEFs historically provide comes from the
distributions.
Below are data points which clearly show the power of
CEF distributions adding up over time and making up all
of the positive return the First Trust CEF Indexes have
earned over the past eight years. Each First Trust Index
below shows two returns. The blue bars exclude
distributions and only include the price return. The bars
shaded in green are total return and include the price
return plus the distributions.
The data is very compelling. It clearly illustrates the
power of CEF distributions compounding over time and
contributing significantly to the total return of these
broad based CEF indexes. When putting this chart
together I used data which goes back almost eight
years and therefore includes the significant price
downturn experienced in 2008. If I had used data which
only goes back five years it would still show the majority
of the return earned in these indexes coming from the
distributions, however it would show some of the return
coming from capital appreciation as well. For example,
the First Trust Closed-end Fund Composite Price Index
(UPCEF) had a cumulative return of 41.67% from
12/31/2008 -12/31/2013. The First Trust Closed-end
Fund Composite Total Return Price Index (UPCEFT)
generated a cumulative total return of 110.04% during
the same five year period (12/31/2008-12/31/2013).
Whether looking at this total return data over five years
or eight years the point remains the same. The
distributions CEFs make on a regular basis can have a
significant impact on the total returns investors have
historically earned in CEFs. If an investor owns one
CEF or a portfolio of dozens of funds, I believe it is
critical to always consider the distributions when
calculating the return as in all likelihood the distributions
will make up a substantial part of the total return.

Authored by:
Jeff Margolin
Senior Vice President
Closed-End Fund Analyst
FirstTrust Advisors,LP.

The chart is for illustrative purposes only and not indicative of any
investment. Past performance is no guarantee of future results. The
First Trust Composite Closed-End Fund Index is a composite index of
the municipal, taxable fixed income and equity indexes and is intended
to provide a capitalization weighted representation of the entire U.S.
closed-end fund universe. The First Trust Municipal Closed-End Fund
Index is a capitalization weighted index designed to provide a broad
representation of the U.S. municipal closed-end fund universe. The
First Trust Taxable Fixed Income Closed-End Fund Index is a
capitalization weighted index designed to provide a broad
representation of the taxable fixed income closed-end fund universe.
The First Trust Equity Closed-End Fund Index is a capitalization
weighted index designed to provide a broad representation of the equity
based closed-end fund universe. An index cannot be purchased directly
by investors.
Closed-end funds are subject to various risks, including management’s
ability to meet the fund’s investment objective, and to manage the
fund’s portfolio when the underlying securities are redeemed or sold,
during periods of market turmoil and as investors’ perceptions regarding
the funds or their underlying investments change. Unlike open-end
funds, which trade at prices based on a current determination of the
fund’s net asset value, closed-end funds frequently trade at a discount
to their net asset value in the secondary market. Certain closed-end
funds may employ the use of leverage which increases the volatility of
such funds.
All opinions expressed constitute judgments as of the date of release,
and are subject to change without notice. There can be no assurance
forecasts will be achieved. The information is taken from sources that
we believe to be reliable but we do not guarantee its accuracy or
completeness.

…your link with the Global Investment Community

18
CEF Commentary

The Future of Closed-End Funds: Yield May No Longer be
The Marketing Plan
February 7, 2014
Closed-end funds (CEFs) are three things: Permanent
Capital, Active Management and Investor Liquidity. The
fixed capital feature is where the “closed” comes from
as funds are created through an IPO and do not offer a
daily exchange of shares at net asset value (NAV).
CEFs have active management and offer investors daily
liquidity on US exchanges. We see these
characteristics as benefits because the fund manager
doesn’t have to deal with redemption and in-flow
pressures. CEFs are also able to offer preferred stock
and employ other forms of leverage. These unique
features have allowed CEFs, especially in the past 10
years, to focus on yield-oriented strategies without
having to face the same pressures that open-end funds
have. With past trend of falling interest rates, it has
been a very favorable environment for CEFs.
According to our CEF Universe data, from December
31, 2003 through December 31, 2013, there have been
218 funds IPOed from 59 different fund sponsors,
raising approximately $125 billion in investible assets at
IPO. For perspective the CEF Universe is now about
$250 billion in total net assets. The average IPOed fund
had approximately $570M in assets. Presently, 159 or
about 73% of the funds have some amount of leverage
employed with 145 (67%) using more than 10%
effective leverage. It is fair to say CEFs generally use
their leverage capabilities.
Leverage has been broadly applied in almost every
corner of the CEF universe except Covered Call Equity
Funds, which by design have the goal of a less volatile
NAV, for which leverage would be unlikely to facilitate.
For the past decade yield and CEFs has almost been
unanimous. For example, there are now only three
equity funds currently showing a market yield under 5%.
Major
Grouping
Municipal
Bond
Taxable Bond
Specialty
Equity
US Equity
Non US
Equity
Commodity

In the tables below we have summarized the last
decade of CEF IPOs from December 31, 2003 through
December 31, 2013.

Authored by:
John Cole Scott, CFS
EVP, PortfolioManager,
Closed-Endfund Advisors,Inc.

What does the future hold for closed-end funds?
We think that CEFs in the future will include less yieldfocused endeavors, where leverage is applied for more
capital appreciation goals than simply the goal of
increasing the dividend yield of the underlying
securities. We believe that investment objectives and
portfolio managers which investors have no other way
to access, other than through these new CEFs, will fuel
demand for CEFs that are more about growing capital
than only producing income.
Investors are generally disfavored with “Hedge Funds”,
which we think are misnamed; not all Hedge Funds
actually “hedge out” market risk, though there are still a
good number that do state it as an investment objective.
Hedge funds are actually just a pooled investment
structure for accredited investors ($2M in net worth)
where the portfolio manager can participate in the
portfolio’s growth. They generally have a fee structure
that looks like 2% per year and 20% of high water (new)
gains. We think investors that had previously searched
out this type of manager can find comfort and liquidity in
a potential new generation of CEFs.
Why Alternatives Make Sense in a CEF Structure? It is
simple, fixed capital allows for less liquid investments
and no redemption pressures. This is exactly the type of
investments that hedge funds have often used for
clients. The CEF world needs great managers with
ideas and investment mandates that are not available
or ideal to ETF or open-end funds, to lead the way for
this endeavor.

#
Funds
IPOed

$AUM
IPOed

Largest Areas for CEF
IPOs

# Funds
IPOed

$AUM IPOed

Current
Lev%

Current Avg
Mkt Pr Yirld

19

$6.5B

Equity - Covered Call

31

$25.4B

3%

9.1%

68

$33.0B

MLP Funds

26

$13.2B

23%

6.7%

87

$53.3B

Loan Funds

19

$8.1B

30%

7.4%

15

$7.9B

Municipal

19

$6.5B

25%

6.0%

24

$14.6B

Energy, Utility

16

$6.7B

16%

7.6%

5

$2.5B

Multisector Bond

14

$10.8B

29%

8.0%

Data from our CEF Universe Report dated 1/31/2014. It should be noted that our data currently has a survivorship
bias. We do not have access to data on funds that merged, liquidated or open-ended that IPOed since 12/31/2003.

…your link with the Global Investment Community

19
ETF Commentary

Three Things to Know about Currency Hedging
February 10, 2014
As investors seek international equity exposure as a
means of enhancing portfolio diversification to reduce
risk, Dodd Kittsley explains why it’s important to take
note of the impact of currency on total returns.
In the past month, non-U.S. developed markets equity
ETFs attracted $11.2 billion. Pan-European equity,
which I’ve discussed before on the Blog, brought in $4
billion. During the same period, broad-based developed
markets equity added $3.7 billion, and Japanese equity
exposures attracted $4 billion. We believe this trend will
continue, and recently upgraded our view of Europe
and Japan from neutral to overweight, as noted in
BlackRock’s latest Investment Directions.
As U.S. investors allocate more overseas for exposure
to potential enhanced returns and reduced risk through
diversification, many of them are unaware of how
currency can impact the overall return of any
international equity investment. In fact, currency can
often contribute more to your return than the underlying
security itself. I like to think of it as simply as
Total Investor Return = Equity Return + Currency
Return
Your total return depends on both equity and currency
returns, which are sensitive to economic, political, and
market events, and fluctuate over time. Below is an
illustration of the historical effects of currency
fluctuation, comparing the MSCI EAFE USD and the
MSCI EAFE Local Index. As you can see, currency
values can drastically impact total return. For example,
the effect of currency in 2003 added 18% to an
investment in the MSCI EAFE Index for U.S. investors.
This was a time when the U.S. dollar weakened relative
to other currencies, in particular the euro and the yen,
and an unhedged investment paid off.
Another example is in 2005, where the effect of
currency took 15% from an investment in the MSCI
EAFE Index for U.S. investors. This was a time when
the U.S. dollar strengthened relative to other currencies,
and marked a year where hedged investment paid off.

Think of it this way: if you have a positive view of the
underlying market equities in a foreign country, and a
weak view of the U.S. dollar (i.e. appreciating local
currency), you could select an unhedged currency
investment, which most international equity ETFs
currently offer. On the other hand, if you have a positive
view of underlying market equities in a foreign country,
and a strong view of the U.S. dollar (i.e. depreciating
local currency), you could select a currency hedged
product.
When the U.S. dollar appreciates, gains on international
equity investments can diminish when converted back
into U.S. dollars. This is especially relevant right now,
as we expect the dollar to strengthen this year. In a
stronger U.S. dollar environment, hedged investments
tend to outperform. Investors seeking pure exposure to
underlying international markets can help to neutralize
currency risk with a currency hedged investment or
ETF. Here are three things to keep in mind:

Authored by:
Dodd Kittsley, CFA
Director, Global Head of
ETP Research, BlackRock

1. The effects of currency fluctuations are more
relevant today than ever before. Investors are
beginning to allocate a greater proportion of their overall
portfolios to international developed and emerging
markets to avoid home country bias, or over-investing in
one’s own country. As my colleague Russ Koesterich
points out in a recent post, investors often exaggerate
the benefit of physical proximity and thus have overlyconcentrated portfolios. Awareness of this bias has
increased recently and combined with attractive
fundamentals in markets outside the US- a reallocation
outside the US is clearly underway.
2. Currency hedged investments historically have
exhibited less volatility than unhedged. What’s
more, hedged products are now large, liquid and
accessible to the average investor, offering international
exposures while reducing the risk of currency
fluctuations. Three new solutions include the iShares
Currency Hedged MSCI Japan ETF (HEWJ), the
iShares Currency Hedged MSCI EAFE ETF (HEFA),
and the iShares Currency Hedged MSCI Germany ETF
(HEWG).
3. Investors are beginning to take note of the value
of currency hedged ETFs. In fact, currency hedged
ETF flows hit a record $19.35 billion in 2013.

…your link with the Global Investment Community

20
ETF Commentary

2013 - A Strong Year for ETFs
January 24, 2014
Strong ETF Net Inflows for 2013
US-listed ETF1 net inflows totaled $185.5 billion in
2013, setting a new record.2 While the largest
percentage of net inflows remained concentrated
among a relatively small group of the 1521 US-listed
ETFs, investors broadened their horizons more in 2013
than in previous years, as 312 ETFs had net inflows
exceeding $100 million.
2013 was also a record-setting year for First Trust’s
ETF complex. Net inflows for the 79 First Trust ETFs
totaled $8.2 billion in 2013, with 24 ETFs exceeding
$100 million in net inflows, increasing ETF assets under
management (AUM) at First Trust to $19.7 billion. As of
12/31/13, First Trust was the 9th largest sponsor of USlisted ETFs.
Strong Inflows Continued for Equity Income ETFs
Equity income remained a prominent theme for ETF net
inflows in 2013, continuing a trend that began in March
of 2009. From 3/31/09 to 12/31/13, assets in domestic
equity income ETFs grew from $5 billion to over $65
billion.

Generally speaking, investors in these ETFs were
rewarded with solid returns during that stretch.
However, looking ahead many equity income ETFs with
overweight allocations to non-cyclical sectors may face
headwinds in 2014, in our opinion, especially if mid- and
long-term interest rates continue to trend higher.
Investors with a preference for dividend-paying stocks,
but concerns about rising interest rates, may consider
reallocating assets from ETFs focused on high dividend
yielding stocks to ETFs focused on dividend growth
stocks.

Although equity income ETFs apply a variety of different
strategies for constructing their respective portfolios,
one common characteristic currently shared by many of
these funds is a sector allocation that tends to
overweight relatively high dividend yielding sectors with
below average dividend growth (such as the utilities and
consumer staples sectors), and underweight sectors
with lower dividend yields but greater opportunity for
dividend growth potential (such as the technology and
financial sectors). As we discussed in last July’s edition
of “Inside First Trust ETFs,” we believe that stocks with
growing dividends may perform better than those
lacking dividend growth during periods of rising interest
rates. Indeed, this was the case in 2013, as the 10 year
US Treasury yield increased by 137 basis points from
5/2/13-9/5/13. During that period, returns for the S&P
500 Utilities and Consumer Staples Sectors, were 9.4% and -2.8%, respectively, while returns for the S&P
500 Information Technology and Financial Sectors were
+5.2% and +6.7%, respectively.

Authored by:
Ryan O. Issakainen, CFA
Senior ViP, Exchange Traded
Fund Strategist, First Trust
Advisors L.P.

If interest rates continue trending higher in 2014 (First
Trust economists forecast a 3.65% 10-year US
Treasury yield by year-end), it may be prudent to
consider repositioning equity income ETF assets to
seek dividend growth. One ETF that may be considered
by investors looking to increase exposure to dividendpaying technology companies is the First Trust
NASDAQ Technology Dividend Index Fund (TDIV). For
those seeking increased exposure to the financial
sector, the First Trust NASDAQ® ABA Community Bank
Index Fund (QABA) invests in a portfolio of community
banks. We believe this segment of the financial sector
is particularly well-positioned to benefit if the yield curve
steepens in 2014. Finally, investors looking for a more
diversified portfolio of stocks that have consistently
increased dividends in the past, and may be well
positioned to increase dividends in the future, may
consider the
First Trust NASDAQ Rising Dividend Achievers ETF
(RDVY).
AlphaDEX and “Smart Beta”
In our opinion, one of the most interesting
developments in the ETF industry in 2013 was the
growing acceptance of ETFs tracking alternative
strategies for selecting and weighting stocks, often
labelled as “smart beta” strategies by ETF industry
pundits. Of course, not all smart beta strategies are
equally smart, and many investors may decide to wait
for some of the newcomers to develop longer-term track
records before considering them.

…your link with the Global Investment Community

21
ETF Commentary

Preparing for the Unexpected with Commodity
Futures ETFs
Three straight years of negative returns for broad
commodity benchmark indices, such as the Dow JonesUBS Commodity Total Return Index, have led some
investment advisors (and their clients) to begin
questioning the rationale for including commodity
futures ETFs1 in their asset allocation models.
Relatively tame inflation expectations seem to support
these doubts, as commodities are often thought of as a
hedge against inflation. However, the fact that inflation
expectations are so low may actually highlight one of
the most important reasons for maintaining (or adding)
a strategic allocation to commodity futures ETFs: in
order to hedge against unexpected inflation.
Unexpected inflation is a risk worth hedging, in our
opinion, because it tends to have a negative impact on
both stocks and bonds. For example, when inflation is
accurately forecasted, manufacturing companies can
utilize futures contracts to lock in their future costs for
certain raw materials, in order to manage their profit
margins. However, when input costs rise unexpectedly,
profit margins may be compressed for companies that
have difficulty passing these cost increases along to
their customers, which, in turn, tends to hurt stock
prices.
Bondholders are negatively impacted by unexpected
inflation as well, since bond yields are set by the market
with an embedded inflation expectation. When inflation
increases unexpectedly, the real value of bond interest
payments is reduced, which may also negatively impact
bond prices, as the market requires higher nominal
yields.
Similar to stocks and bonds, the prices of commodity
futures also have embedded inflation expectations, but
unlike stocks and bonds, commodity futures prices tend
to be positively impacted by unexpected inflation
increases.2 This relationship enables investors to
potentially utilize commodity futures and related ETFs
as an effective hedge against unexpected inflation.
Of course, it’s difficult to make a strong case for when
unexpected inflation may show up, which is ultimately
what makes it unexpected. While there are certainly
conditions in place that could eventually lead to higher
levels of inflation, First Trust’s forecast for year-overyear US CPI growth of 1.8% in 2014 and 2.3% in 2015
is only slightly higher than the median forecast among
Bloomberg contributors (1.6% for 2014 and 2.0% for
2015). But this underscores why we believe it makes

February 10, 2014

sense to include a strategic allocation to commodity
futures ETFs in an asset allocation model: not as a
tactical play based on our expectation of unexpected
inflation, but as a tool to manage the risk of unexpected
inflation, which, by definition, you don’t see coming.
the sake of clarity, the term “ETF” is used to refer
to all exchange-traded products (1940 Act exchangetraded funds, exchange-traded notes, commodity
exchange-traded
securities, etc.).
1 For

Gorton and K. Geert Rouwenhorst. 2006. “Facts
and Fantasies about Commodity Futures.” Financial
Analysts Journal, vol. 62, no. 2 (March/April 2006):47–
68.
2 Gary

Authored by:
Ryan O. Issakainen, CFA
Senior ViP, Exchange Traded
Fund Strategist, First Trust
Advisors L.P.

You should consider a fund's investment objectives, risks, and
charges and expenses carefully before investing. You can
download a prospectus or summary prospectus, or contact First
Trust Portfolios L.P. at 1-800-621-1675 to request a prospectus or
summary prospectus which contains this and other information
about a fund. The prospectus or summary prospectus should be
read carefully before investing.
The Dow Jones-UBS Commodity Index is made up of exchange-traded
futures on physical commodities and represents 20 commodities, which
are weighted to account for economic significance and market liquidity.
Indexes are unmanaged and an investor cannot invest directly in an
index.
Investors buying or selling ETF shares on the secondary market may
incur customary brokerage commissions. Market prices may differ to
some degree from the netasset value of the shares. Investors who sell
fund shares may receive less than the share’s net asset value. Shares
may be sold throughout the day on the exchangethrough any brokerage
account. However, unlike mutual funds, shares may only be redeemed
directly from the fund by authorized participants, in very large
creation/redemption units. A fund’s shares will change in value, and you
could lose money by investing in a fund. One of the principal risks of
investing in a fund is market risk. Market risk is the risk that a particular
security owned by a fund, fund shares or the market in general may fall
in value.
The trading prices of commodities futures fluctuate in response to a
variety of factors which will cause a fund’s net asset value and market
price to fluctuate in response to these factors. As a result, an investor
could lose money over short or long periods of time. In addition, the net
asset value of a fund over short-term periods may be more volatile than
other investment options because of a fund’s significant use of financial
instruments that have a leveraging effect. Futures instruments may be
less liquid than other types of investments. The prices of futures
instruments may fluctuate quickly and dramatically and may not
correlate to price movements in other asset classes.
All opinions expressed constitute judgments as of the date of release,
and are subject to change without notice. There can be no assurance
forecasts will be achieved. The information is taken from sources that
we believe to be reliable but we do not guarantee its accuracy or
completeness.

…your link with the Global Investment Community

22
Market Commentary

2014: Year of the Fundamental Investor
January 2014
January 2014
Entering 2014, we expect a good year for global equity
and convertible markets overall. The major global
economies look positioned to show faster growth,
although this positive global synchronization is
occurring at varying rates and supported by diverging
policies. Historically, the conditions we see today have
benefited equities and convertibles, especially cyclical
growth opportunities. More importantly, we are
encouraged by the emergence of more fundamentally
driven markets across asset classes and believe that
our active approach is well suited to this environment.
I.
Market Review
The S&P 500 Index rang out 2013 with a total return of
32%, its strongest year since 1997 (Figure 1). The
Nasdaq Index soared even higher to a 40% gain for
2013, on the back of an increased appetite for risk
assets, including smaller cap and technology names.
Developed markets outside the U.S. also advanced
briskly, supported by improved conditions in the euro
zone and brightening sentiment on Japan.
FIGURE 1. U.S. EQUITIES SOAR, WHILE BONDS AND GOLD FALTER

In terms of market performance, the emerging markets
(EMs) did not enjoy similarly good fortunes, as market
participants struggled with the potential deleterious
impact of a U.S. taper on countries with weaker

currencies and deficits; these anxieties were
exacerbated by concerns of slowing growth. Talk of a
potential credit bubble and slowing growth in China
was a focal point of investor apprehension.
As is often the case, good news for U.S. stocks was
bad news for much of the bond market, and the 10year Treasury sank 8% for the year. Gold declined
nearly 30% as inflation remained contained and
equities extended their rally.

Authored by:
John P. Calamos SR.
CEO and Global CO -CIO
Calamos Investments
Gary D. Black
EVP and Global CO-CIO
Calamos Investments

For the year (Figure 2), consumer discretionary led, as
companies continued to reap the benefits of the wealth
effect provided by rising equity markets and recovering
home prices. Health care and financials rounded out
the top performing sectors.
For the quarter, cyclical growth sectors performed
best, led by industrials and technology. Utilities and
telecom posted the most muted gains for the quarter
and the year, as investors turned away from more
defensive names.
II. Global Outlook
While improved global economic growth in 2013 was
led by the U.S., we are starting to see positive global
synchronization among major economies. Europe is
coming out of its recession, and Abenomics has
promoted economic growth in Japan. China’s growth
has decelerated, but it is delivering solid growth
nonetheless, as are a number of lesser-discussed
EMs.
In the wake of the 2008 financial crisis and euro zone
turmoil, accommodative policy was good for the global
economy. Recovery efforts didn’t take firm hold until
the U.S., the European Central Bank (ECB) and
China aligned in an accommodative direction. Now,
with the worst in the rear-view mirror, countries are
following different routes to move forward as they
address local issues.

FIGURE 2. A STRONG SHOWING FOR CYCLICALS IN THE U.S. EQUITY MARKET

…your link with the Global Investment Community

23
Market Commentary

The U.S. is tapering; elsewhere in the developed markets, monetary
policy remains highly accommodative and fiscal policy has become
more simulative. The ECB has indicated its willingness to inject more
money into the euro zone, and Japan looks set to continue with its
unprecedented stimulus measures. China and other emerging
markets will likely be in varying levels of tightening as they work to
avoid credit bubbles while keeping inflation in check. All in, we expect
global growth slightly above 3.0% (Figure 3), with the U.S. and China
making strong contributions. As the two largest economies in the
world, their economic growth can offset the more modest expansion
that we may see in the euro zone and in some EMs.
United States. The U.S. economy looks to be in a “not-too-hot, nottoo-cold” period, supported by improving GDP growth and low
inflation, upbeat consumers, good corporate balance sheets, strength
in manufacturing and an improving trade balance. We expect U.S.
GDP growth of 2.5 to 3.0% in 2014, with inflation holding at less than
2%. Against this backdrop, we anticipate that the Fed will withdraw
QE stimulus by the end of 2014, while continuing accommodative
policy through 2015.

FIGURE 3. GLOBAL AND U.S. GDP GROWTH

FIGURE 4. U.S. HOME PRICES RISE, HELPED BY LOW INVENTORY

Supported by a wealth effect of rising equity markets and home
values (Figure 4), the U.S. consumer is feeling better and spending
more, including on autos and other discretionary items (Figure 5). Net
worth is higher than it was before the financial crisis, and the
deleveraging cycle may have well have bottomed out (Figure 6). This
willingness to spend and potentially take on debt should sustain
economic growth over the long term.
The U.S. Labor Department’s report that only 74,000 jobs were added
in December fell far short of economists’ expectations (Figure 7), but
we expect the number to be revised upward next month. The
calendar was compressed with Thanksgiving coming late; the
weather was bad; and if one considers November data (revised up to
241,000 jobs) along with December’s data, the average monthly job
growth has been respectable at about 160,000. The December
numbers are also inconsistent with the other stronger economic data
we’ve seen over the past few weeks, including new unemployment
claims and ADP’s private sector job growth report.
Businesses are also doing well. Capital spending has begun its longanticipated recovery, with total expenditures at record highs.
Corporate cash growth and high cash balances suggest that this
recovery can be sustained over an extended period. Operating
earnings of S&P 500 companies continue to rise. Small businesses
are adding jobs and benefiting from increased access to credit. As
earnings season starts again, we believe most sectors are likely to do
better versus reduced expectations. Retail and restaurants may be an
exception; like the employment numbers, these sectors were similarly
affected by the compressed calendar and weather.

FIGURE 5. U.S. AUTO SALES ON THE RISE

FIGURE 6. U.S. CONSUMER NET WORTH CLIMBS AS DEBT BURDENS PLUMMET

Past Performance is not a guarantee of future results
Information contained herein is for informational purposes only. Opinions, estimates,
forecasts, and statements of financial market trends that are based on current market
conditions constitute our judgment and are subject to change without notice. We believe
the information provided here is reliable. The views and strategies described may not be
suitable for all investors. References to specific securities, asset classes and financial
markets are for illustrative purposes only and are not intended to be, and should not be
interpreted as, recommendations.

…your link with the Global Investment Community

24
Market Commentary

Municipal Bond Market Review & Outlook
February 11, 2014
Western Asset’s Fourth Quarter 2013 Recap
The municipal (muni) bond market struggled throughout the fourth
quarter and in 2013. However, despite heightened market volatility and
high-profile credit stresses, there was actually strengthening
fundamentals. For example, tax receipts have improved for 15 straight
quarters. In addition, spending has remained in check, or in
equilibrium, with incoming revenues.
Thus far, we're not seeing austerity fatigue settle into budgets. That’s
due to several factors. First, the unemployment rate has declined.
Second, there has been improvement in the housing market. Third,
sales tax, personal income tax and corporate income tax receipts have
all risen. That being said, revenue improvements have been uneven
across regions. The disparity is especially pronounced between state
and local governments. While tax revenues in some regions now
exceed their pre-recession levels, this isn't the case in some areas. In
addition, while the housing market has rebounded, this has been
insufficient in terms of propping up of property tax receipts. This will
likely to keep pressure on certain local government bonds, more so
than state and higher-quality local government bond markets.
While the landscape is uneven, municipal balance sheets are
generally much stronger today than where they were just a few years
ago. We have a backdrop of improving fundamentals, and muni
valuations are very, very cheap. In particular, given oversold
conditions and the steep muni yield curve, we see value in longer-term
maturities. And we expect the muni yield curve to flatten in 2014. Even
with an expectation for higher interest rates in 2014, you can make the
case that the oversold conditions in the muni bond market in 2013 left
us with a decent cushion to help protect against the potential for
negative price returns in the upcoming quarter or quarters.
What are some of the things we’re watching that could offset our
upbeat tone? We're closely monitoring the Detroit bankruptcy
settlement case, underfunded local pension liabilities, and Puerto
Rico’s liquidity and its ability to access the capital markets. Again,
these high-profile credit stresses, we believe, have overshadowed the
broader municipal story, which is fundamental improvement and cheap
prices.
In terms of supply/demand technicals, crossover buyers have been
providing liquidity and offsetting much of the negative cash flows from
open-end mutual funds. More importantly, demand from retail
investors has improved a bit. It hasn't been significant, but in early
2014 we’ve seen the appetite for municipal bonds improve. And we're
starting to see positive cash flows into open-end mutual funds. So, it’s
generally good news all around. Fundamentals are improving,
valuations are cheap, and technicals are more favorable.
Let's turn our attention to the high-profile credit stresses in Puerto
Rico. It is facing many challenges, and strengthening the island’s
physical condition is a key goal for the current administration.
Governor Padilla, who was elected in November 2012, has taken
many positive steps by increasing and broadening certain taxes, as
well as instituting better tax collection processes. For example, on

average, only 50 cents of each dollar of sales tax gets to the state.
They’re looking for ways to improve that tax collection process, such
that increasing revenue collections might help the imbalance between
revenues and expenses. But these positive factors have been largely
overshadowed by the weak economy. Puerto Rico is now in an eighth
year of a recessionary environment. This is leaving little economic
opportunity and causing many people to leave the island, which is
shrinking the tax base. So the economy must begin to grow to help the
island out of its economic troubles. But Puerto Rico does have an
economic development plan, they’ve seen an improvement in
revenues and they’re keeping expenses at bay. At least for now, it
looks like they'll be able to find liquidity in the financial market,
although it will be at a prohibitively high borrowing cost.
Turning to Detroit, it is in the midst of an ongoing legal battle. This will
continue even after the bankruptcy settlement, as there’ll be an
appeals process. We believe the market place has already valued or
priced in all the available information from Detroit, Puerto Rico,
Chicago and some of the communities in California.
Market Outlook
We are upbeat about the muni bond market. Our portfolios are
positioned with durations that are slightly longer than those of their
respective benchmarks. We have been adding to our A-rated
securities and, to smaller degrees, BBB-rated and some belowinvestment-grade credits where we're identifying great values.
From a sector perspective, we continue to favor revenue bonds versus
general obligation debt. Within the revenue bond sector, we look to
overweight corporate-backed obligations – commonly referred to as
IDRs or industrial development revenue bonds – and health care,
utilities and transportation related bonds. The latter includes airport,
airline, marine port and mature toll roads with solid pricing power,
good liquidity and modest amounts of debt.
Looking ahead, we will be tactical in terms of duration, and we
continue to look at valuations versus fundamentals. Should prices
become stretched relative to the fundamentals, we’ll look for
opportunities to move away from some of the things that we’ve
included in our portfolios and look for better opportunities.
Western Asset manages the following municipal bond closed-end
funds:
•
•
•
•
•

Western Asset Municipal High Income Fund Inc. (MHF)
Western Asset Managed Municipals Fund Inc. (MMU)
Western Asset Municipal Partners Fund Inc. (MNP)
Western Asset Municipal Defined Opportunity Trust Inc. (MTT)
Western Asset Intermediate Muni Fund Inc. (SBI)

For more information about any of our municipal bond closed-end funds,
including the long-term performance, risks, expenses and fund
objectives, please visit www.lmcef.com.
Please view endnotes and important information on the next page.

…your link with the Global Investment Community

25
Market Commentary

Important Information:

Glossary

All investments are subject to risks, including the possible loss of
principal. Investments in bonds are subject to credit risk, inflation risk,
and interest rate risk. As interest rates rise, bond prices fall, reducing
the value of the Fund's share price. Investments in lower-rated highyield bonds are subject to greater credit risk (risk of default) than
higher-rated obligations. Derivatives, such as options and futures, can
be illiquid, may disproportionately increase losses, and have a
potentially large impact on Fund performance. Certain investors may
be subject to the federal Alternative Minimum Tax (AMT), and state
and local taxes may apply. Distributions are not guaranteed and
are subject to change.

Crossover buyers are investors that typically wouldn’t transact in taxexempt muni bonds for various reasons.

The Closed-End Funds are not sold or distributed by Legg Mason
Investor Services, LLC ("LMIS") or any affiliate of Legg Mason,
Inc. Unlike open-end funds, shares are not continually offered. Like
other public companies, closed-end funds have a one-time initial
public offering, and once their shares are first issued, are generally
bought and sold through non-affiliated broker/dealers and trade on
nationally recognized stock exchanges. Share prices will fluctuate with
market conditions and, at the time of sale, may be worth more or less
than your original investment. Shares of exchange-traded closed-end
funds may trade at a discount or premium to their original offering
price, and often trade at a discount to their net asset value. Net Asset
Value (NAV) is total assets less total liabilities divided by the number
of shares outstanding. Market Price, determined by supply and
demand, is the price at which an investor purchases or sells the fund.
Investment return, market price and net asset value will fluctuate with
changes in market conditions. The Funds are subject to investment
risks, including the possible loss of principal invested.
Diversification does not assure a profit or protect against market loss.
Any performance discussed is past performance, and past
performance is no guarantee of future results. Unless otherwise
stated, all yields and returns discussed are those of indexes or asset
classes and are not those of the Funds.
A credit rating is a measure of an issuer's ability to repay interest and
principal in a timely manner. The credit ratings provided by Standard
and Poor's, Moody's Investors Service and/or Fitch Ratings, Ltd.
typically range from AAA (highest) to D (lowest), or an equivalent
and/or similar rating. Please see www.standardandpoors.com,
www.moodys.com, or www.fitchratings.com for details. Please note
that the Funds themselves have not been rated by an
independent rating agency.

Duration is a measurement that signals how much the price of a bond
is likely to fluctuate when there is a change in interest rates. The
higher the duration number, the more sensitive a bond will be to
interest rate changes.
General obligation (G.O.) bonds are issued by a municipality and
are backed by the general ability of the municipality to raise revenue.
No specific tax or project revenues are identified as the source of
future payments and no assets are used as collateral.
A revenue bond is a type of municipal bond distinguished by its
guarantee of repayment solely from revenues generated by a specified
revenue-generating entity, rather than from a tax.
A yield curve shows the relationship between yields and maturity
dates for a similar class of bonds.
The views expressed are those of the portfolio managers as of
January 30, 2014 and are subject to change based on market and
other conditions. These views may differ from other portfolio managers
or the firm as a whole, and are not intended to be a forecast of future
events, a guarantee of future results, or investment advice.
Discussions of individual securities are intended to inform
shareholders as to the basis (in whole or in part) for previously made
decisions by a portfolio manager to buy, sell or hold a security in a
portfolio. References to specific securities are not intended and should
not be relied upon as the basis for anyone to buy, sell or hold any
security. Forecasts are inherently limited and should not be relied
upon as an indication of actual or future performance.
Legg Mason is not affiliated with Capital Link.
© 2014 Legg Mason Investor Services, LLC. Member FINRA, SIPC.
Legg Mason Investor Services, LLC and Western Asset Management
are subsidiaries of Legg Mason, Inc.
INVESTMENT PRODUCTS: NOT FDIC INSURED | NO BANK
VALUE | MAY LOSE VALUE
FN1410465

Legg Mason, Inc., its affiliates, and its employees are not in the
business of providing tax or legal advice. These materials and any taxrelated statements are not intended or written to be used, and cannot
be used or relied upon, by any such taxpayer for the purpose of
avoiding tax penalties. Tax-related statements, if any, may have been
written in connection with the “promotion or marketing” of the
transaction(s) or matter(s) addressed by these materials, to the extent
allowed by applicable law. Any such taxpayer should seek advice
based on the taxpayer's particular circumstances from an independent
tax advisor.

…your link with the Global Investment Community

26
Investment Commentary

Potential inclusion of China A-shares in major global
benchmarks
Chinese equities are underrepresented in major
global benchmarks such as those operated by
FTSE and MSCI. This article, an excerpt from a
Deutsche
Bank
research
report
called
“Synthesizing Equity in 2014,” explains.
The size of China’s economy and equity market
demands a larger index weight
Chinese equities are underrepresented in major global
benchmarks such as the FTSE and MSCI indices. The
FTSE All World Index assigns a weight of 2% to China,
while the MSCI All Country (AC) World Index allocation
is only marginally higher at 2.2%. In the FSCI Emerging
Markets Index, even though China is the largest
component, with close to a 20% weighting, the
allocations are still arguably on the lower side if viewed
from the perspective of stock-market capitalization. Our
analysis suggests that China should be more than 30%
by weight in the MSCI Emerging Markets Index.
Obstacles for China A-shares to be included in
global benchmarks
Some major obstacles still exist in terms of market
accessibility, preventing fund managers from replicating
or benchmarking to a global index that includes China
A-shares. There are a number of restrictions in place for
a foreign investor seeking exposure to Chinese
equities, such as the low quota for each Qualified
Foreign Institutional Investor (QFII), restrictions on
capital remittance and repatriation and uncertainty
regarding capital-gains tax.
Acceleration in opening up China’s capital market
Recently, the Chinese government has made significant
progress opening up China’s capital markets. In 2013,
we witnessed dramatic acceleration in this continued
process. In January, the former chairman of the China
Securities Regulatory Commission (CSRC) indicated
that the Renminbi
Qualified Foreign Institutional Investor (RQFII) and QFII
quotas could be increased to 10 times the current level.
In July, Chinese regulators almost doubled the QFII
quota (from $80 billion to $150 billion). In September,
the Hong Kong Monetary Authority (HKMA) became the
first QFII to be awarded more than $1 billion in
investment quota from China. Following that, Chinese
regulators raised the QFII quota to more than $1 billion
for both Norges Bank and Temasek. In November,
China’s central bank chief, Zhou Xiaochuan, stated the
intention to further expand quotas for QFII and Qualified
Domestic Institutional Investor (QDII) schemes, and
ultimately remove the quota system altogether when
conditions ripen.

February 2014

Authored by:
Shan Lan
Head off Index Change
Research
Deutsche Bank

Timeline of the potential inclusion
There have been many discussions on when index
providers will include China A-shares into their global
benchmarks. The actual timing depends on the
progress of the China capital account liberalization to a
large extent. Major index providers may wait until the
Chinese equity market fully meets these criteria before
they include it into their global benchmark.
Alternatively, index providers can gradually add China
A-shares starting with a portion of the full weight, similar
to the addition of Korea and Taiwan in the MSCI
Emerging Markets Index. MSCI added Korea at 20% of
its weight in 1992, and took six years to include the full
weight of Korea. Similarly, it took nine years from the
initial inclusion of Taiwan in the MSCI Emerging
Markets Index to its full inclusion.
In June 2013, MSCI announced that it had added China
A-shares to the review list for potential inclusion to its
most tracked benchmarks, such as the MSCI Emerging
Markets Index and MSCI AC World Index. The MSCI
annual country classification review in June 2014 is the
earliest time for MSCI to announce China A-shares
inclusion in the MSCI Emerging Markets Index.
Assuming the previous decision is taken, June 2015
would be the earliest MSCI would implement China Ashares inclusion in the MSCI Emerging Markets Index.
FTSE will announce its annual country classification
review decision in September 2014, and China Ashares are on watch list for possible inclusion in its
global index series. Assuming FTSE decides to make
the change, it may implement China A-shares inclusion
in its FTSE All World Index series in March or
September of 2015.

27
Capital Link's Monthly CEF & ETF Newsletter - February 2014

Weitere ähnliche Inhalte

Was ist angesagt?

Brookfield Asset Management Corporate Profile
Brookfield Asset Management Corporate ProfileBrookfield Asset Management Corporate Profile
Brookfield Asset Management Corporate ProfileHaroon Rashid
 
Bank News 14_Veng--Jul 15
Bank News 14_Veng--Jul 15Bank News 14_Veng--Jul 15
Bank News 14_Veng--Jul 15annie chan
 
Optimal Asset Allocation and Consumption Rules for Oil-Based Sovereign Wealth...
Optimal Asset Allocation and Consumption Rules for Oil-Based Sovereign Wealth...Optimal Asset Allocation and Consumption Rules for Oil-Based Sovereign Wealth...
Optimal Asset Allocation and Consumption Rules for Oil-Based Sovereign Wealth...Economic Research Forum
 
June 2010 - Financial system: Long-term challenges
June 2010 - Financial system: Long-term challengesJune 2010 - Financial system: Long-term challenges
June 2010 - Financial system: Long-term challengesFGV Brazil
 
Monday September 24 2012 - Top 10 Risk Management News
Monday September 24 2012 - Top 10 Risk Management NewsMonday September 24 2012 - Top 10 Risk Management News
Monday September 24 2012 - Top 10 Risk Management NewsCompliance LLC
 
Highlights of recent trends in financial markets
Highlights of recent trends in financial marketsHighlights of recent trends in financial markets
Highlights of recent trends in financial marketsRajendar Madasi
 
Ch04 mish11 embfm
Ch04 mish11 embfmCh04 mish11 embfm
Ch04 mish11 embfmRob Sears
 
NWAM investment outlook 12-31-18
NWAM investment outlook 12-31-18NWAM investment outlook 12-31-18
NWAM investment outlook 12-31-18Patrick Thuemmel
 
Global Financial Crisis - Impact on Singapore and Policy Measures Taken to co...
Global Financial Crisis - Impact on Singapore and Policy Measures Taken to co...Global Financial Crisis - Impact on Singapore and Policy Measures Taken to co...
Global Financial Crisis - Impact on Singapore and Policy Measures Taken to co...Vikas Sharma
 
Potential for vulnerability in MLPS
Potential for vulnerability in MLPSPotential for vulnerability in MLPS
Potential for vulnerability in MLPSGE 94
 
Bridgepoint Merchant Banking Midwest Capital Raise Update Q2 2017
Bridgepoint Merchant Banking Midwest Capital Raise Update Q2 2017Bridgepoint Merchant Banking Midwest Capital Raise Update Q2 2017
Bridgepoint Merchant Banking Midwest Capital Raise Update Q2 2017Bridgepoint Merchant Banking
 
UNIT Market Update
UNIT Market UpdateUNIT Market Update
UNIT Market UpdateUNITatSydney
 
Optimal investment strategies for Sovereign Wealth Funds
Optimal investment strategies for Sovereign Wealth Funds Optimal investment strategies for Sovereign Wealth Funds
Optimal investment strategies for Sovereign Wealth Funds Alexandre Kateb
 
Article Strategic Insight - Sept 09
Article Strategic Insight - Sept 09Article Strategic Insight - Sept 09
Article Strategic Insight - Sept 09Damien de Chillaz
 
ARXGG4NK
ARXGG4NKARXGG4NK
ARXGG4NKdCORE
 
Wilshire Liquid Alternatives Industry Monitor for Q2 2018
Wilshire Liquid Alternatives Industry Monitor for Q2 2018Wilshire Liquid Alternatives Industry Monitor for Q2 2018
Wilshire Liquid Alternatives Industry Monitor for Q2 2018Wilshire
 
2014Liquidity-FINAL
2014Liquidity-FINAL2014Liquidity-FINAL
2014Liquidity-FINALKevin Roth
 

Was ist angesagt? (20)

Brookfield Asset Management Corporate Profile
Brookfield Asset Management Corporate ProfileBrookfield Asset Management Corporate Profile
Brookfield Asset Management Corporate Profile
 
Bank News 14_Veng--Jul 15
Bank News 14_Veng--Jul 15Bank News 14_Veng--Jul 15
Bank News 14_Veng--Jul 15
 
Monthly Perspectives - Strange Days - May 2016
Monthly Perspectives - Strange Days - May 2016Monthly Perspectives - Strange Days - May 2016
Monthly Perspectives - Strange Days - May 2016
 
Optimal Asset Allocation and Consumption Rules for Oil-Based Sovereign Wealth...
Optimal Asset Allocation and Consumption Rules for Oil-Based Sovereign Wealth...Optimal Asset Allocation and Consumption Rules for Oil-Based Sovereign Wealth...
Optimal Asset Allocation and Consumption Rules for Oil-Based Sovereign Wealth...
 
June 2010 - Financial system: Long-term challenges
June 2010 - Financial system: Long-term challengesJune 2010 - Financial system: Long-term challenges
June 2010 - Financial system: Long-term challenges
 
Monday September 24 2012 - Top 10 Risk Management News
Monday September 24 2012 - Top 10 Risk Management NewsMonday September 24 2012 - Top 10 Risk Management News
Monday September 24 2012 - Top 10 Risk Management News
 
Highlights of recent trends in financial markets
Highlights of recent trends in financial marketsHighlights of recent trends in financial markets
Highlights of recent trends in financial markets
 
2018 OECD Business and Finance Outlook Key Findings
2018 OECD Business and Finance Outlook Key Findings2018 OECD Business and Finance Outlook Key Findings
2018 OECD Business and Finance Outlook Key Findings
 
Ch04 mish11 embfm
Ch04 mish11 embfmCh04 mish11 embfm
Ch04 mish11 embfm
 
Financila markets in russia
Financila markets in russiaFinancila markets in russia
Financila markets in russia
 
NWAM investment outlook 12-31-18
NWAM investment outlook 12-31-18NWAM investment outlook 12-31-18
NWAM investment outlook 12-31-18
 
Global Financial Crisis - Impact on Singapore and Policy Measures Taken to co...
Global Financial Crisis - Impact on Singapore and Policy Measures Taken to co...Global Financial Crisis - Impact on Singapore and Policy Measures Taken to co...
Global Financial Crisis - Impact on Singapore and Policy Measures Taken to co...
 
Potential for vulnerability in MLPS
Potential for vulnerability in MLPSPotential for vulnerability in MLPS
Potential for vulnerability in MLPS
 
Bridgepoint Merchant Banking Midwest Capital Raise Update Q2 2017
Bridgepoint Merchant Banking Midwest Capital Raise Update Q2 2017Bridgepoint Merchant Banking Midwest Capital Raise Update Q2 2017
Bridgepoint Merchant Banking Midwest Capital Raise Update Q2 2017
 
UNIT Market Update
UNIT Market UpdateUNIT Market Update
UNIT Market Update
 
Optimal investment strategies for Sovereign Wealth Funds
Optimal investment strategies for Sovereign Wealth Funds Optimal investment strategies for Sovereign Wealth Funds
Optimal investment strategies for Sovereign Wealth Funds
 
Article Strategic Insight - Sept 09
Article Strategic Insight - Sept 09Article Strategic Insight - Sept 09
Article Strategic Insight - Sept 09
 
ARXGG4NK
ARXGG4NKARXGG4NK
ARXGG4NK
 
Wilshire Liquid Alternatives Industry Monitor for Q2 2018
Wilshire Liquid Alternatives Industry Monitor for Q2 2018Wilshire Liquid Alternatives Industry Monitor for Q2 2018
Wilshire Liquid Alternatives Industry Monitor for Q2 2018
 
2014Liquidity-FINAL
2014Liquidity-FINAL2014Liquidity-FINAL
2014Liquidity-FINAL
 

Ähnlich wie Capital Link's Monthly CEF & ETF Newsletter - February 2014

Capital Link's April 2014 CEF & ETF Newsletter
Capital Link's April 2014 CEF & ETF NewsletterCapital Link's April 2014 CEF & ETF Newsletter
Capital Link's April 2014 CEF & ETF Newsletterannyzhu123
 
Mercer Capital's Asset Management Industry Newsletter | Q1 2015 | Focus: Mutu...
Mercer Capital's Asset Management Industry Newsletter | Q1 2015 | Focus: Mutu...Mercer Capital's Asset Management Industry Newsletter | Q1 2015 | Focus: Mutu...
Mercer Capital's Asset Management Industry Newsletter | Q1 2015 | Focus: Mutu...Mercer Capital
 
LKQ Corporation's 2018 Investor Day Presentation
LKQ Corporation's 2018 Investor Day PresentationLKQ Corporation's 2018 Investor Day Presentation
LKQ Corporation's 2018 Investor Day Presentationcorporationlkq
 
May 2015 real estate securities funds monitor
May  2015  real estate securities funds monitorMay  2015  real estate securities funds monitor
May 2015 real estate securities funds monitorConsiliacapital
 
Value investingcongress roepers-ny13
Value investingcongress roepers-ny13Value investingcongress roepers-ny13
Value investingcongress roepers-ny13Frank Ragol
 
Marketing materials presentation material kb value focus korea equity_20151211
Marketing materials presentation material kb value focus korea equity_20151211Marketing materials presentation material kb value focus korea equity_20151211
Marketing materials presentation material kb value focus korea equity_20151211kbasset
 
Mutual fund industry - An Intercontinental Analysis
Mutual fund industry - An Intercontinental AnalysisMutual fund industry - An Intercontinental Analysis
Mutual fund industry - An Intercontinental Analysistechkaush
 
Macquarie China Gateway Fund Factsheet
Macquarie China Gateway Fund FactsheetMacquarie China Gateway Fund Factsheet
Macquarie China Gateway Fund Factsheetasianextractor
 
Invbots training materials 20210104 - Macro Strategy
Invbots training materials 20210104 - Macro StrategyInvbots training materials 20210104 - Macro Strategy
Invbots training materials 20210104 - Macro StrategyInvbots Limited
 
Mercer Capital's Asset Management Industry Newsletter | Q2 2015 | Focus: Trad...
Mercer Capital's Asset Management Industry Newsletter | Q2 2015 | Focus: Trad...Mercer Capital's Asset Management Industry Newsletter | Q2 2015 | Focus: Trad...
Mercer Capital's Asset Management Industry Newsletter | Q2 2015 | Focus: Trad...Mercer Capital
 
VOG Deal Reader_Q2 2015
VOG Deal Reader_Q2 2015VOG Deal Reader_Q2 2015
VOG Deal Reader_Q2 2015Jason Wirth
 
Futures in Finance 18 10 14 Equity Research session
Futures in Finance 18 10 14 Equity Research sessionFutures in Finance 18 10 14 Equity Research session
Futures in Finance 18 10 14 Equity Research sessionIntellisysUK
 
Do You Know the Value of Your Business?
Do You Know the Value of Your Business?Do You Know the Value of Your Business?
Do You Know the Value of Your Business?SSDlaw
 
Introduction to Hedge Funds - Data
Introduction to Hedge Funds - DataIntroduction to Hedge Funds - Data
Introduction to Hedge Funds - DataDrago Indjic
 
ATM summer (May) 2006
ATM summer (May) 2006ATM summer (May) 2006
ATM summer (May) 2006Greg Meier
 
Finance in the South West 2017 - First Session
Finance in the South West 2017 - First Session Finance in the South West 2017 - First Session
Finance in the South West 2017 - First Session PKF Francis Clark
 

Ähnlich wie Capital Link's Monthly CEF & ETF Newsletter - February 2014 (20)

Capital Link's April 2014 CEF & ETF Newsletter
Capital Link's April 2014 CEF & ETF NewsletterCapital Link's April 2014 CEF & ETF Newsletter
Capital Link's April 2014 CEF & ETF Newsletter
 
Mercer Capital's Asset Management Industry Newsletter | Q1 2015 | Focus: Mutu...
Mercer Capital's Asset Management Industry Newsletter | Q1 2015 | Focus: Mutu...Mercer Capital's Asset Management Industry Newsletter | Q1 2015 | Focus: Mutu...
Mercer Capital's Asset Management Industry Newsletter | Q1 2015 | Focus: Mutu...
 
LKQ Corporation's 2018 Investor Day Presentation
LKQ Corporation's 2018 Investor Day PresentationLKQ Corporation's 2018 Investor Day Presentation
LKQ Corporation's 2018 Investor Day Presentation
 
May 2015 real estate securities funds monitor
May  2015  real estate securities funds monitorMay  2015  real estate securities funds monitor
May 2015 real estate securities funds monitor
 
Value investingcongress roepers-ny13
Value investingcongress roepers-ny13Value investingcongress roepers-ny13
Value investingcongress roepers-ny13
 
Herbalife IR Plan
Herbalife IR PlanHerbalife IR Plan
Herbalife IR Plan
 
LaSalleS16-Final
LaSalleS16-FinalLaSalleS16-Final
LaSalleS16-Final
 
Marketing materials presentation material kb value focus korea equity_20151211
Marketing materials presentation material kb value focus korea equity_20151211Marketing materials presentation material kb value focus korea equity_20151211
Marketing materials presentation material kb value focus korea equity_20151211
 
Mutual fund industry - An Intercontinental Analysis
Mutual fund industry - An Intercontinental AnalysisMutual fund industry - An Intercontinental Analysis
Mutual fund industry - An Intercontinental Analysis
 
Macquarie China Gateway Fund Factsheet
Macquarie China Gateway Fund FactsheetMacquarie China Gateway Fund Factsheet
Macquarie China Gateway Fund Factsheet
 
Invbots training materials 20210104 - Macro Strategy
Invbots training materials 20210104 - Macro StrategyInvbots training materials 20210104 - Macro Strategy
Invbots training materials 20210104 - Macro Strategy
 
Mercer Capital's Asset Management Industry Newsletter | Q2 2015 | Focus: Trad...
Mercer Capital's Asset Management Industry Newsletter | Q2 2015 | Focus: Trad...Mercer Capital's Asset Management Industry Newsletter | Q2 2015 | Focus: Trad...
Mercer Capital's Asset Management Industry Newsletter | Q2 2015 | Focus: Trad...
 
VOG Deal Reader_Q2 2015
VOG Deal Reader_Q2 2015VOG Deal Reader_Q2 2015
VOG Deal Reader_Q2 2015
 
First Financial Bankshares 1st Qtr 2016
First Financial Bankshares 1st Qtr 2016First Financial Bankshares 1st Qtr 2016
First Financial Bankshares 1st Qtr 2016
 
Futures in Finance 18 10 14 Equity Research session
Futures in Finance 18 10 14 Equity Research sessionFutures in Finance 18 10 14 Equity Research session
Futures in Finance 18 10 14 Equity Research session
 
Do You Know the Value of Your Business?
Do You Know the Value of Your Business?Do You Know the Value of Your Business?
Do You Know the Value of Your Business?
 
Introduction to Hedge Funds - Data
Introduction to Hedge Funds - DataIntroduction to Hedge Funds - Data
Introduction to Hedge Funds - Data
 
ATM summer (May) 2006
ATM summer (May) 2006ATM summer (May) 2006
ATM summer (May) 2006
 
Finance in the South West 2017 - First Session
Finance in the South West 2017 - First Session Finance in the South West 2017 - First Session
Finance in the South West 2017 - First Session
 
Lofaro_360Fund
Lofaro_360FundLofaro_360Fund
Lofaro_360Fund
 

Kürzlich hochgeladen

20240429 Calibre April 2024 Investor Presentation.pdf
20240429 Calibre April 2024 Investor Presentation.pdf20240429 Calibre April 2024 Investor Presentation.pdf
20240429 Calibre April 2024 Investor Presentation.pdfAdnet Communications
 
Top Rated Pune Call Girls Dighi ⟟ 6297143586 ⟟ Call Me For Genuine Sex Servi...
Top Rated  Pune Call Girls Dighi ⟟ 6297143586 ⟟ Call Me For Genuine Sex Servi...Top Rated  Pune Call Girls Dighi ⟟ 6297143586 ⟟ Call Me For Genuine Sex Servi...
Top Rated Pune Call Girls Dighi ⟟ 6297143586 ⟟ Call Me For Genuine Sex Servi...Call Girls in Nagpur High Profile
 
VIP Call Girl Service Andheri West ⚡ 9920725232 What It Takes To Be The Best ...
VIP Call Girl Service Andheri West ⚡ 9920725232 What It Takes To Be The Best ...VIP Call Girl Service Andheri West ⚡ 9920725232 What It Takes To Be The Best ...
VIP Call Girl Service Andheri West ⚡ 9920725232 What It Takes To Be The Best ...dipikadinghjn ( Why You Choose Us? ) Escorts
 
VIP Independent Call Girls in Mumbai 🌹 9920725232 ( Call Me ) Mumbai Escorts ...
VIP Independent Call Girls in Mumbai 🌹 9920725232 ( Call Me ) Mumbai Escorts ...VIP Independent Call Girls in Mumbai 🌹 9920725232 ( Call Me ) Mumbai Escorts ...
VIP Independent Call Girls in Mumbai 🌹 9920725232 ( Call Me ) Mumbai Escorts ...dipikadinghjn ( Why You Choose Us? ) Escorts
 
Booking open Available Pune Call Girls Wadgaon Sheri 6297143586 Call Hot Ind...
Booking open Available Pune Call Girls Wadgaon Sheri  6297143586 Call Hot Ind...Booking open Available Pune Call Girls Wadgaon Sheri  6297143586 Call Hot Ind...
Booking open Available Pune Call Girls Wadgaon Sheri 6297143586 Call Hot Ind...Call Girls in Nagpur High Profile
 
The Economic History of the U.S. Lecture 21.pdf
The Economic History of the U.S. Lecture 21.pdfThe Economic History of the U.S. Lecture 21.pdf
The Economic History of the U.S. Lecture 21.pdfGale Pooley
 
The Economic History of the U.S. Lecture 23.pdf
The Economic History of the U.S. Lecture 23.pdfThe Economic History of the U.S. Lecture 23.pdf
The Economic History of the U.S. Lecture 23.pdfGale Pooley
 
Gurley shaw Theory of Monetary Economics.
Gurley shaw Theory of Monetary Economics.Gurley shaw Theory of Monetary Economics.
Gurley shaw Theory of Monetary Economics.Vinodha Devi
 
The Economic History of the U.S. Lecture 30.pdf
The Economic History of the U.S. Lecture 30.pdfThe Economic History of the U.S. Lecture 30.pdf
The Economic History of the U.S. Lecture 30.pdfGale Pooley
 
The Economic History of the U.S. Lecture 22.pdf
The Economic History of the U.S. Lecture 22.pdfThe Economic History of the U.S. Lecture 22.pdf
The Economic History of the U.S. Lecture 22.pdfGale Pooley
 
Kharghar Blowjob Housewife Call Girls NUmber-9833754194-CBD Belapur Internati...
Kharghar Blowjob Housewife Call Girls NUmber-9833754194-CBD Belapur Internati...Kharghar Blowjob Housewife Call Girls NUmber-9833754194-CBD Belapur Internati...
Kharghar Blowjob Housewife Call Girls NUmber-9833754194-CBD Belapur Internati...priyasharma62062
 
Top Rated Pune Call Girls Sinhagad Road ⟟ 6297143586 ⟟ Call Me For Genuine S...
Top Rated  Pune Call Girls Sinhagad Road ⟟ 6297143586 ⟟ Call Me For Genuine S...Top Rated  Pune Call Girls Sinhagad Road ⟟ 6297143586 ⟟ Call Me For Genuine S...
Top Rated Pune Call Girls Sinhagad Road ⟟ 6297143586 ⟟ Call Me For Genuine S...Call Girls in Nagpur High Profile
 
Mira Road Memorable Call Grls Number-9833754194-Bhayandar Speciallty Call Gir...
Mira Road Memorable Call Grls Number-9833754194-Bhayandar Speciallty Call Gir...Mira Road Memorable Call Grls Number-9833754194-Bhayandar Speciallty Call Gir...
Mira Road Memorable Call Grls Number-9833754194-Bhayandar Speciallty Call Gir...priyasharma62062
 
00_Main ppt_MeetupDORA&CyberSecurity.pptx
00_Main ppt_MeetupDORA&CyberSecurity.pptx00_Main ppt_MeetupDORA&CyberSecurity.pptx
00_Main ppt_MeetupDORA&CyberSecurity.pptxFinTech Belgium
 
VIP Call Girl in Mira Road 💧 9920725232 ( Call Me ) Get A New Crush Everyday ...
VIP Call Girl in Mira Road 💧 9920725232 ( Call Me ) Get A New Crush Everyday ...VIP Call Girl in Mira Road 💧 9920725232 ( Call Me ) Get A New Crush Everyday ...
VIP Call Girl in Mira Road 💧 9920725232 ( Call Me ) Get A New Crush Everyday ...dipikadinghjn ( Why You Choose Us? ) Escorts
 
VIP Call Girl in Mumbai 💧 9920725232 ( Call Me ) Get A New Crush Everyday Wit...
VIP Call Girl in Mumbai 💧 9920725232 ( Call Me ) Get A New Crush Everyday Wit...VIP Call Girl in Mumbai 💧 9920725232 ( Call Me ) Get A New Crush Everyday Wit...
VIP Call Girl in Mumbai 💧 9920725232 ( Call Me ) Get A New Crush Everyday Wit...dipikadinghjn ( Why You Choose Us? ) Escorts
 
The Economic History of the U.S. Lecture 20.pdf
The Economic History of the U.S. Lecture 20.pdfThe Economic History of the U.S. Lecture 20.pdf
The Economic History of the U.S. Lecture 20.pdfGale Pooley
 

Kürzlich hochgeladen (20)

20240429 Calibre April 2024 Investor Presentation.pdf
20240429 Calibre April 2024 Investor Presentation.pdf20240429 Calibre April 2024 Investor Presentation.pdf
20240429 Calibre April 2024 Investor Presentation.pdf
 
Top Rated Pune Call Girls Dighi ⟟ 6297143586 ⟟ Call Me For Genuine Sex Servi...
Top Rated  Pune Call Girls Dighi ⟟ 6297143586 ⟟ Call Me For Genuine Sex Servi...Top Rated  Pune Call Girls Dighi ⟟ 6297143586 ⟟ Call Me For Genuine Sex Servi...
Top Rated Pune Call Girls Dighi ⟟ 6297143586 ⟟ Call Me For Genuine Sex Servi...
 
VIP Call Girl Service Andheri West ⚡ 9920725232 What It Takes To Be The Best ...
VIP Call Girl Service Andheri West ⚡ 9920725232 What It Takes To Be The Best ...VIP Call Girl Service Andheri West ⚡ 9920725232 What It Takes To Be The Best ...
VIP Call Girl Service Andheri West ⚡ 9920725232 What It Takes To Be The Best ...
 
VIP Independent Call Girls in Mumbai 🌹 9920725232 ( Call Me ) Mumbai Escorts ...
VIP Independent Call Girls in Mumbai 🌹 9920725232 ( Call Me ) Mumbai Escorts ...VIP Independent Call Girls in Mumbai 🌹 9920725232 ( Call Me ) Mumbai Escorts ...
VIP Independent Call Girls in Mumbai 🌹 9920725232 ( Call Me ) Mumbai Escorts ...
 
Booking open Available Pune Call Girls Wadgaon Sheri 6297143586 Call Hot Ind...
Booking open Available Pune Call Girls Wadgaon Sheri  6297143586 Call Hot Ind...Booking open Available Pune Call Girls Wadgaon Sheri  6297143586 Call Hot Ind...
Booking open Available Pune Call Girls Wadgaon Sheri 6297143586 Call Hot Ind...
 
The Economic History of the U.S. Lecture 21.pdf
The Economic History of the U.S. Lecture 21.pdfThe Economic History of the U.S. Lecture 21.pdf
The Economic History of the U.S. Lecture 21.pdf
 
The Economic History of the U.S. Lecture 23.pdf
The Economic History of the U.S. Lecture 23.pdfThe Economic History of the U.S. Lecture 23.pdf
The Economic History of the U.S. Lecture 23.pdf
 
Gurley shaw Theory of Monetary Economics.
Gurley shaw Theory of Monetary Economics.Gurley shaw Theory of Monetary Economics.
Gurley shaw Theory of Monetary Economics.
 
The Economic History of the U.S. Lecture 30.pdf
The Economic History of the U.S. Lecture 30.pdfThe Economic History of the U.S. Lecture 30.pdf
The Economic History of the U.S. Lecture 30.pdf
 
The Economic History of the U.S. Lecture 22.pdf
The Economic History of the U.S. Lecture 22.pdfThe Economic History of the U.S. Lecture 22.pdf
The Economic History of the U.S. Lecture 22.pdf
 
Call Girls in New Ashok Nagar, (delhi) call me [9953056974] escort service 24X7
Call Girls in New Ashok Nagar, (delhi) call me [9953056974] escort service 24X7Call Girls in New Ashok Nagar, (delhi) call me [9953056974] escort service 24X7
Call Girls in New Ashok Nagar, (delhi) call me [9953056974] escort service 24X7
 
Kharghar Blowjob Housewife Call Girls NUmber-9833754194-CBD Belapur Internati...
Kharghar Blowjob Housewife Call Girls NUmber-9833754194-CBD Belapur Internati...Kharghar Blowjob Housewife Call Girls NUmber-9833754194-CBD Belapur Internati...
Kharghar Blowjob Housewife Call Girls NUmber-9833754194-CBD Belapur Internati...
 
From Luxury Escort Service Kamathipura : 9352852248 Make on-demand Arrangemen...
From Luxury Escort Service Kamathipura : 9352852248 Make on-demand Arrangemen...From Luxury Escort Service Kamathipura : 9352852248 Make on-demand Arrangemen...
From Luxury Escort Service Kamathipura : 9352852248 Make on-demand Arrangemen...
 
Top Rated Pune Call Girls Sinhagad Road ⟟ 6297143586 ⟟ Call Me For Genuine S...
Top Rated  Pune Call Girls Sinhagad Road ⟟ 6297143586 ⟟ Call Me For Genuine S...Top Rated  Pune Call Girls Sinhagad Road ⟟ 6297143586 ⟟ Call Me For Genuine S...
Top Rated Pune Call Girls Sinhagad Road ⟟ 6297143586 ⟟ Call Me For Genuine S...
 
Mira Road Memorable Call Grls Number-9833754194-Bhayandar Speciallty Call Gir...
Mira Road Memorable Call Grls Number-9833754194-Bhayandar Speciallty Call Gir...Mira Road Memorable Call Grls Number-9833754194-Bhayandar Speciallty Call Gir...
Mira Road Memorable Call Grls Number-9833754194-Bhayandar Speciallty Call Gir...
 
00_Main ppt_MeetupDORA&CyberSecurity.pptx
00_Main ppt_MeetupDORA&CyberSecurity.pptx00_Main ppt_MeetupDORA&CyberSecurity.pptx
00_Main ppt_MeetupDORA&CyberSecurity.pptx
 
(INDIRA) Call Girl Mumbai Call Now 8250077686 Mumbai Escorts 24x7
(INDIRA) Call Girl Mumbai Call Now 8250077686 Mumbai Escorts 24x7(INDIRA) Call Girl Mumbai Call Now 8250077686 Mumbai Escorts 24x7
(INDIRA) Call Girl Mumbai Call Now 8250077686 Mumbai Escorts 24x7
 
VIP Call Girl in Mira Road 💧 9920725232 ( Call Me ) Get A New Crush Everyday ...
VIP Call Girl in Mira Road 💧 9920725232 ( Call Me ) Get A New Crush Everyday ...VIP Call Girl in Mira Road 💧 9920725232 ( Call Me ) Get A New Crush Everyday ...
VIP Call Girl in Mira Road 💧 9920725232 ( Call Me ) Get A New Crush Everyday ...
 
VIP Call Girl in Mumbai 💧 9920725232 ( Call Me ) Get A New Crush Everyday Wit...
VIP Call Girl in Mumbai 💧 9920725232 ( Call Me ) Get A New Crush Everyday Wit...VIP Call Girl in Mumbai 💧 9920725232 ( Call Me ) Get A New Crush Everyday Wit...
VIP Call Girl in Mumbai 💧 9920725232 ( Call Me ) Get A New Crush Everyday Wit...
 
The Economic History of the U.S. Lecture 20.pdf
The Economic History of the U.S. Lecture 20.pdfThe Economic History of the U.S. Lecture 20.pdf
The Economic History of the U.S. Lecture 20.pdf
 

Capital Link's Monthly CEF & ETF Newsletter - February 2014

  • 1. Capital Link’s CEF & ETF Monthly Newsletter FEBRUARY 2014 Volume 2 | Issue 2 Table of Contents CEF Sector Review  Lipper • • • • The Month in CEFs: January 2014......... CEF Events & Corporate Actions............ CEF Performance Statistics.................... Top 5 Performing CEFs........................... 3 5 7 8 ETP Sector Review  Market/Fund/Investment Commentaries   BlackRock • Global ETP Monthly Review................... 9 • Global ETP Data & Statistics.................. 11  CEF Commentaries    Fitch Ratings • Fitch: Investors Sell Puerto Rico Bonds; PRICA Adds Uncertainty • Fitch: New Puerto Rico Fund.............. Regulations Modest Credit Positive... First Trust Advisors • The Power of Closed-End Fund Distributions, by Jeff Margolin........... CEF Advisors • The Future of CEFs: Yield May No Longer be The Marketing Plan, by John Cole Scott, CFS............................  17 17 18   CEFs & ETPs Event Calendar   19 ETF Commentaries   Calamos Investments • 2014: Year of the Fundamental Investor, by John P. Calamos SR. and Gary D. Black..................................... 23 Legg Mason • Municipal Bond Market Review & Outlook............................................... 25 DWS Asset Management • Potential inclusion of China A-shares in Major Global Benchmarks.............. 27 PowerShares • Smart Beta ETF Strategies................... 30 Aberdeen Asset Management • Aberdeen Great China Fund, Inc. (GCH) Fund Manager Interview – Nicolas Yeo.......................................... 32 Fund Updates............................................... 34 BlackRock • Three Things to Know about Currency Hedging, by Dodd Kittsley, CFA.............. 20 First Trust Advisors • 2013 – A Strong Year for ETFs, by Ryan O. Issakainen, CFA...................... 21 • Preparing for the Unexpected with Commodity Futures ETFs, by Ryan O. Issakainen, CFA................................... 22  CEFs & Global ETFs Webinar Library............... 35 Capital Link’s MLP Investing Forum on March 6, 2014 in New York City.............see p. 2 Capital Links’ 13th Annual Closed-End Funds & Global ETFs Forum on April 24, 2014 in New York City..........................................see p. 16 …your link with the Global Investment Community
  • 2. LEAD SPONSORS Seating is limited. To register, click on the below button or visit our website SPONSORS Attendance is complimentary for qualified delegates. The Forum will qualify for up to 9 CFP Continuing Education Credits ABOUT THE FORUM Capital Link will be hosting its MLP Investing Forum on Thursday, March 6, 2014 at the Metropolitan Club in New York City at One East 60th Street, New York City. The Forum is designed to provide in-depth information on topics of interest to the industry and to investors. This Forum is an extension of our 13 year track record success of Capital Link’s Annual Closed-End Funds & Global ETFs Forum, which attracts more than 1,200+ delegates every year. The Forum combines an informational and marketing platform with unique visibility and networking opportunities. INDUSTRY PANEL TOPICS TO BE COVERED Developments, Trends & Sector Outlook • • • • • • • • • Upstream Panel - Exploration & Production Mid-Stream Panel - Gathering, Processing, Transportation & Storage NGL/LNG/LPG Panel Marine Transportation Panel Tax/Legislation/Regulatory Panel - MLP Parity Act, Future Tax Implications & Issues Analyst Panel - Analyst Perspective MLP Closed End Funds & ETFs Panel - The Investor Perspective MLP Rating Agency Panel - Financial & Debt Management Best Practices for the MLP Structure Raising Capital for MLPs Panel SUPPORTING SPONSORS FEATURED SPEAKERS Kyri Loupis, Managing Director of the Investment Management Division of Goldman Sachs will deliver the Opening Address on the “State of the MLP Sector”. Jerry Swank, Founder, Managing Partner & CEO of Swank Capital & The Cushing Funds will deliver the Keynote Address. PRESENTERS / SPEAKERS INCLUDE: • • • • • • • • • • • • • • • • • Jonathan Z. Ackerman, Chief Financial Officer - Oiltanking• Partners LP (NYSE: OILT) Seth Appel, Managing Director Investment Banking Group -• MLV & Co. • Robert Baldwin, MLP Lead - PricewaterhouseCoopers LLP • Doug Bond, Portfolio Manager - Cohen & Steers (NYSE: MIE) • Mike Bresson, Head of MLP Tax Practice - Baker Botts LLP Stuart Buchanan, Business Development & Investor• Relations - Golar LNG Partners LP (NASDAQ: GMLP) • John Campbell, President & COO - QR Energy (NYSE: QRE) • Stratos Desypris, Chief Financial Officer - Navios Maritime Partners (NYSE: NMM) • William Ferara, Director, Utilities & Infrastructure - Standard & Poor's • Fred Gordon, VP, Corporate Affairs - Navios Maritime• Partners (NYSE: NMM) • Greg Haas. Director of Research, Integrated Oil & Gas - Hart Energy Research • Hinds Howard, Vice President - CBRE Clarion Securities Jim Jackson, Chief Financial Officer - Breitburn Energy• Partners LP (NASDAQ: BBEP) Michelle Kelly, Managing Director - Tortoise Capital• Advisors (NYSE: TYG) Roy Lamoreaux, Director Investor Relations - Plains All• American Pipelines, LP (NYSE: PAA) Ioannis Lazaridis, CEO & CFO - Capital Product Partners• LP (NASDAQ:CPLP) Mary S. Lyman, Executive Director - National Association of Publicly Traded Partnerships Mark Maki, President - Enbridge Energy Partners LP (NYSE : EEP) Stuart D. Miller, VP and Senior Credit Officer - Moody's Peter Molica, Director, Corporate Ratings, Midstream, Pipelines and MLPs - Fitch Ratings Jeff Olmstead, President & CFO - Mid-Con Energy Partners, LP (NASDAQ: MCEP) Stephen Pang, Director Equity Capital Markets Group Credit Suisse Robert A. Prado, Director - PricewaterhouseCoopers LLP Michael Peterson, Managing Director, Energy Research MLV & Co. Matthew Phillips, Midstream Energy/MLP Equity Research Analyst - Clarkson Capital Markets Richard Robert, EVP & CFO - Vanguard Natural Resources, LLC (NASDAQ: VNR) Daniel Rodgers, Partner - Watson Farley & Williams Tyler Rosenlicht, Analyst - Cohen & Steers (NYSE: MIE) Darren Schuringa, Managing Partner - Yorkville Capital Management (NYSE: YMLP) Eduardo Seda, VP, Senior Energy Analyst - Ladenburg Thalmann & Co. Nicholas Stillman, Managing Director - Clarkson Capital Markets Mark Stockard, VP Investor Relations - Crestwood Midstream Partners (NYSE : CMLP) Michael Webber, Senior Equity Analyst, Director - Wells Fargo Securities Gavin Worthy, VP, Sales Operations & Business Development, Swank Capital, LLC SUPPORTING ORGANIZATION MEDIA PARTNERS ORGANIZED BY CAPITAL LINK, INC. New York • London • Athens • Oslo 230 Park Ave. Suite 1536 New York, NY 10169 | NY: +1 (212) 661-7566 forum@capitallink.com
  • 3. Closed-End Funds Report The Month in Closed-End Funds: January 2014 PERFORMANCE With the S&P 500 index (-3.46%) posting its worst January return since 2010 and the Dow Jones Industrial Average (-5.30%) chalking up its worst January return since 2009, it’s little wonder investors ducked for cover and bid up Treasury securities in January. Although the real meltdown didn’t materialize until the very end of the month, investors were cautious after the spectacular equity run-up in 2013, the Federal Reserve’s commitment to continue tapering its now $75-billion/ month bond-buying program by $10 billion in February, and the mixed economic news throughout the month. Shrugging off generally better-than-expected fourth quarter earnings reports (according to Thomson Reuters’ proprietary research team, with 50% of the S&P 500 constituents reporting Q4 2013 earnings thus far, 70% have beat expectations and 10% have matched analyst expectations), many investors have decided to take some of those hard-won profits off the table, since many pundits believe we are ripe for a near-term correction and consolidation. For the third straight month equity and fixed income CEFs went their separate ways. As one might expect, given the slide in the broad-based indices, equity CEFs were in the red for January, losing on average 1.57% on a NAV basis (their first negative return since August 2013) and 1.67% on a market basis. Meanwhile, fixed income CEFs gained 2.56% and 3.44%, respectively, in a flight to safety by investors. At the beginning of the month investors were disappointed by a lower-thanexpected nonfarm payrolls report and a drop in both the ISM manufacturing and nonmanufacturing indices. Better-than-anticipated gains in December retail sales and inline gains in industrial production and capacity utilization kept the bears at bay mid-month. However, a few earnings misses by such firms as Intel and General Electric, accompanied with news that the January HSBC China Manufacturing Purchasing Managers Index witnessed a decline to 49.5—signaling a contraction, cast a pall over the international markets. That weighed especially heavily on emerging markets at monthend, and it also pushed the DJIA to its sixth triple-digit loss for the month. The Month in Closed-End Funds: Jan. 2014 • For January only 9% of all closed-end funds (CEFs) traded at a premium to their net asset value (NAV), with 8% of equity funds and 9% of fixed income funds trading in premium territory. The World Equity CEFs macro-group witnessed the largest widening of discounts for the month—63 basis points (bps) to 10.76%. • Equity and fixed income CEFs continued on separate paths in January, with equity funds losing 1.57% on a NAV basis (registering their first monthly loss since August 2013), while their fixed income counterparts returned 2.56% for the month. • For the first month in four all of Lipper’s municipal bond CEF classifications posted returns in the black, with California Municipal Debt Funds (+4.35%) outpacing the other classifications in the group. Municipal debt CEFs (+3.95%) outpaced their domestic taxable CEF counterparts (+1.27%) for the month. • With greater scrutiny on emerging markets, World Equity CEFs (-4.05%) and World Income CEFs (-1.16%) lagged their domestic and taxable counterparts, respectively, for January. As the CBOE Volatility Index climbed 51% from its closing low on January 12 (12.14) to 18.41 on January 31, investors’ rush to safety pushed Treasury prices higher. The ten-year Treasury yield declined 37 bps on January 31, down from its two-and-a-half-year high of 3.04% on December 31. Except for the one-month yield, the Treasury yield curve shifted up, with the tenand twenty-year yields declining the most—37 bps each to 2.67% and 3.35%, respectively, on January 31. For January the dollar strengthened against the euro (+2.03%) and the pound (+0.76%), but it lost against the yen (-2.86%). For the month commodities prices were mixed, with the near-month crude oil price declining 0.94% to close the month at $97.49/barrel, while gold gained 3.18% to end the month at $1,240.10/ ounce. For January 70% of all CEFs posted NAV-basis returns in the black, with only 34% of equity CEFs and 93% of fixed income CEFs chalking up returns in the plus column. U.S. stocks witnessed some deep losses during the month as investor s fled equities and emerging-markets currencies in the face of China’s manufacturing slowdown and renewed fears of deflation in the Eurozone. This contributed to world equity CEFs’ (-4.05%) lagging domestic equity CEFs (-1.05%), while the jump in yields pushed the mixedasset CEFs macro-group (+0.94%) to the top. …your link with the Global Investment Community Authored by: TOM ROSEEN HEAD OF RESEARCH SERVICES LIPPER, DENVER 3
  • 4. Closed-End Funds Report In their flight to safety investors bid up dividend payers and gold-oriented funds, while punishing more risky plays. For January only four of Lipper’s 15 equity CEF classifications posted returns in the black. At the bottom of the charts were CEFs that invest in less developed markets, with Emerging Markets CEFs—suffering a 6.89% loss for the month— bringing up the rear; it was bettered somewhat by Pacific exJapan CEFs (-4.42%). At the top of the charts were December’s laggards, Real Estate CEFs (+2.32%) and Sector Equity CEFs (+1.97%). With yields declining during the month and municipal bond funds suffering a disproportionate share of downside performance over the last several months, it wasn’t all that surprising to see the municipal bond CEFs macrogroup (+3.95%) rising to the top of the fixed income macrogroup, outperforming taxable domestic bond CEFs (+1.27% on a NAV basis) and world bond CEFs (-1.16%). CLOSED-END FUNDS LAB As investors became slightly risk averse during the month, they began taking money off the table from CEF classifications that were on a tear in 2013. On the domestic equity side Core CEFs (-3.18%, December’s leader) and Option Arbitrage/Option Strategies CEFs (-2.63%) suffered the largest losses for January. Investors pushed Income & Preferred Stock CEFs (+1.45%) and Energy MLP CEFs (+2.64%) toward the top of the charts. For the remaining equity classifications returns ranged from minus 2.62% (Global CEFs) to minus 0.25% (Convertible CEFs). Three of the five top-performing individual equity funds were housed in Lipper’s Sector Equity CEFs classification. However, at the top of the charts for January was RENN Global Entrepreneurs Fund, Inc. (AMEX: RCG, housed in Lipper’s Global CEFs classification, it was December’s second worst performing CEF), gaining 9.32% on a NAV basis and traded at a 44.96% discount at month-end. Following RCG were ASA Gold & Precious Metals Limited (NYSE: ASA, housed in Lipper’s Sector Equity CEFs classification), rising 7.89% on a NAV basis and traded at a 4.61% discount on January 31, and H&Q Life Sciences Investors (NYSE: HQL, also housed in Lipper’s Sector Equity CEFs classification), posting a 7.57% return and traded at a 6.64% discount at month-end. Following those two were H&Q Healthcare Investors (NYSE: HQH), chalking up a 5.97% return and traded at a 2.87% discount on January 31, and John Hancock Preferred Income Fund II (NYSE: HPF, housed in Lipper’s Income & Preferred Stock Fund classification), which rose 5.45% and traded at a 5.98% discount at month-end. April 2013 Source: Lipper, a Thomson Reuters company For the month the dispersion of performance in individual equity CEFs—ranging from minus 12.36% to positive 9.32%— was much narrower than December’s spread and more negatively skewed. The 20 top-performing equity funds posted returns at or above 2.89%, while the 20 lagging funds were at or below minus 6.02%. For the month Aberdeen Emerging Markets Smaller Company Opportunities Fund, Inc. (AMEX: ETF), housed in Lipper’s Emerging Markets CEFs classification, was at the …your link with the Global Investment Community 4
  • 5. CEF Events and Corporate Actions bottom of the equity CEFs group, shedding 12.36% of its December month-end value and traded at a 9.91% discount at month-end. Turkish Investment Fund, Inc. (NYSE: TKF, also warehoused in Lipper’s Emerging Markets CEFs classification) was the next poorest performing equity fund, declining 11.77% and traded at a 3.39% discount at month-end. Eight of the ten worst performing funds in the CEF universe were housed in Lipper’s Emerging Markets CEFs classification. For the first month since October 2013 all of Lipper’s municipal debt CEF classifications posted plus-side NAV-based returns as investors bid up the group in their flight to safely, scooping up tax-exempt issues with yields exceeding those of similar-dated Treasuries before tax adjustments. California Municipal Debt CEFs (+4.35%) and General & Insured Municipal Debt CEFs (Leveraged) (+4.34%) witnessed the largest returns of the group, while General & Insured Municipal Debt CEFs (Unleveraged) (+2.64%) and Intermediate Municipal Debt CEFs (+2.78%) were the relative laggards of the group. The municipal debt CEFs macro-group (+3.95%) outperformed its taxable domestic CEFs counterpart (+1.27%). National municipal debt CEFs (+3.99%) slightly outpaced their single-state municipal debt CEF counterparts (+3.91%). As uncertainty continued to unfold in the world markets, both of the classifications making up Lipper’s World Income Funds macroclassification (-1.16%) lagged the other taxable fixed income classifications. Emerging Markets Debt Funds (-2.98%) took the worst of the beatings, outdistanced by Global Income CEFs (-0.08%). With interest rates dropping drastically during the month, December’s leaders—the adjustable-rate Loan Participation CEFs classification (+0.80%) and High Yield CEFs (+0.40%)—became the relative laggards among the taxable fixed income CEFs classifications, while U.S. Mortgage CEFs (+2.34%) and General Bond CEFs (+1.90%) shot to the head of the class for January. Mixed economic reports toward the end of the month, accompanied by disappointing Chinese economic data, pushed yields lower. The two-/ten-year Treasury spread narrowed 33 bps from December’s month-end 2.66%. The yield on the ten-year Treasury note finished the month 37 bps lower at 2.67%. In the domestic taxable fixed income CEFs universe (+1.27%) the remaining classification returns ranged from 0.90% (High Yield [Leveraged] CEFs) to positive 1.70% (Corporate Debt BBB-Rated [Leveraged] CEFs). The two top-performing CEFs in the fixed income universe were housed in Lipper’s General & Insured Municipal Debt (Leveraged) CEFs classification: BlackRock Municipal Target Term Trust (NYSE: BTT) rose 7.09% and traded at a 6.47% discount on January 31, and Eaton Vance Municipal Income Term Trust (NYSE: ETX) tacked 6.70% onto its December month-end value and traded at a 6.47% discount at January month-end. Following those two was NexPoint Credit Strategies Fund (NYSE: PHD, housed in Lipper’s High Yield [Leveraged] CEFs classification), posting a 6.62% return and traded at a 13.80% discount at month-end. For the remaining funds in the fixed income CEFs universe monthly NAV-basis performance ranged from minus 6.64% (Morgan Stanley Emerging Markets Domestic Debt Fund, Inc. [NYSE: EDD], housed in Lipper’s Emerging Markets CEFs classification and traded at a 13.13% discount on January 31) to 6.53% for Eaton Vance Municipal Income Trust (NYSE: EVN), housed in Lipper’s General & Insured Municipal Debt (Leveraged) CEFs classification and traded at a 3.73% premium at month-end. The 20 top-performing fixed income CEFs posted returns at or above 4.88%, while the 20 lagging funds were at or below minus 0.44%. PREMIUM AND DISCOUNT BEHAVIOR For January the median discount of all CEFs narrowed 32 bps to 8.34%—lower than the 12-month moving average discount (6.04%). Equity CEFs’ median discount narrowed 13 bps to 9.64%, while fixed income CEFs’ median discount narrowed 74 bps to 7.55%. Municipal bond CEFs’ median discount narrowed 121 bps to 7.20%. The World Equity CEFs macro-classification witnessed the largest widening of discounts in the CEF universe—just 63 bps to 10.76%. For the month 60% of all funds’ discounts or premiums improved, while 38% worsened. In particular, 48% of equity funds and 68% of fixed income funds saw their individual discounts narrow, premiums widen, or premiums replace discounts. The number of funds traded at premiums on January 31 (51) was five more than on December 31. CEF EVENTS AND CORPORATE ACTIONS IPOs There were no new CEFs launched in January. RIGHTS, REPURCHASES, TENDER OFFERS A tender offer measurement period for The Central Europe, Russia and Turkey Fund (NYSE: CEE), The European Equity Fund (NYSE: EEA), and The New Germany Fund (NYSE: GF) will run from April 7, 2014, to Friday, June 27, 2014. Each fund will conduct a tender offer if its sharesApril 2013 an average discount of more than trade at 10% during the 12-week measurement period. In addition, directors of CEE approved a 700,000-share increase to the previously announced share repurchase authorization, resulting in a total authorization of 1,400,000 shares for repurchase through July 31, 2014. Final results of the semiannual repurchase offer for up to 5% (189,000) of the shares of The Asia Tigers Fund (NYSE: GRR) saw approximately 1.3 million shares tendered; on a pro rata basis 14.9% of the tendered shares were accepted for payment. The Swiss Helvetia Fund (NYSE: SWZ) is offering to purchase up to 15% of its common shares at 95% of NAV until February 11, 2014, unless extended. If more than 15% of the fund’s shares are tendered, the fund will purchase them on a pro rata basis. MERGERS AND REORGANIZATIONS Directors approved a proposal to merge Tortoise Energy Capital Corp. (NYSE: TYY) and Tortoise North American Energy Corp. (NYSE: TYN) into Tortoise Energy Infrastructure Corp. (NYSE: TYG). The mergers are expected to be concluded in second quarter 2014, subject to shareholder approval. …your link with the Global Investment Community 5
  • 6. CEF Events and Corporate Actions Shareholders of Nuveen Pennsylvania Premium Income Municipal Fund 2 (NYSE: NPY), Nuveen Pennsylvania Dividend Advantage Municipal Fund (NYSE: NXM), and Nuveen Pennsylvania Dividend Advantage Municipal Fund 2 (NYSE: NVY) approved the reorganization of their funds into Nuveen Pennsylvania Investment Quality Municipal Fund (NYSE: NQP). The reorganization is expected to be complete Monday, February 10, 2014. Sometime in the second quarter shareholders of American Strategic Income Portfolio (NYSE: ASP) and American Select Portfolio (NYSE: SLA) will be asked to approve a proposal to reorganize the funds into a newly organized CEF managed by Nuveen. If the reorganizations are approved, the new combined fund will move to the Nuveen Funds CEF platform. Shareholders of AllianzGI Global Equity & Convertible Income Fund (NYSE: NGZ) and AllianzGI Equity & Convertible Income Fund (NYSE: NIE) approved the reorganization of NGZ into NIE; the merger was completed at the end of January. OTHER Nuveen Global Value Opportunities Fund (NYSE: JGV) changed its name to Nuveen Global Equity Income Fund (same ticker). Alpine Total Dynamic Dividend Fund (NYSE: AOD) and Alpine Global Dynamic Dividend Fund (NYSE: AGD) each had a one-for-two reverse share split. The funds’ shares will trade under new CUSIP numbers of 021060207 for AOD and 02082E205 for AGD. Directors of Western Asset Inflation Management Fund (NYSE: IMF) adopted a proposal to liquidate and dissolve the fund. Shareholders will be asked to approve the plan at their annual meeting scheduled for April 25, 2014. Click here to join Directors of Morgan Stanley Asia-Pacific Fund (NYSE: APF) approved changing the fund’s investment strategy; it will no longer invest in equity securities of issuers located in Japan. Accordingly, the board approved changing the fund’s benchmark to the MSCI All Country Asia Pacific ex-Japan Index. The portfolio management team will also change. Chartwell Investment Partners, subadvisor to First Trust Dividend and Income Fund (NYSE: FAV) and First Trust Enhanced Equity Income Fund (NYSE: FFA), has agreed to be purchased by TriState Capital Holdings; the transaction is expected to close in first quarter 2014. New subadvisory agreements will be submitted later this year to shareholders of each fund for approval. Authored by: JEFF TJORNEHOJ HEAD OF LIPPER AMERICAS RESEARCH LIPPER, DENVER AllianceBernstein Income Fund (NYSE: ACG) announced that prior to the end of 2013 it received written requests from persons purporting to own in excess of 10% of the fund’s shares that the fund submit a proposal to convert from a CEF to an open-end investment company. First Trust Strategic High Income Fund II (NYSE: FHY) booked a reserve for potential costs and expenses related to a class action lawsuit filed against it by Lehman Brothers Special Finance. Based on the current status of the litigation, FHY booked a reserve that will result in a $0.44/share reduction in NAV and warns there is no assurance this amount will be sufficient to cover the ultimate costs of litigation. © Thomson Reuters 2014. All Rights Reserved. Lipper FundMarket Insight Reports are for informational purposes only, and do not constitute investment advice or an offer to sell or the solicitation of an offer to buy any security of any entity in any jurisdiction. No guarantee is made that the information in this report is accurate or complete and no warranties are made with regard to the results to be obtained from its use. In addition, Lipper, a Thomson Reuters company, will not be liable for any loss or damage resulting from information obtained from Lipper or any of its affiliates. For immediate assistance, feel free to contact Lipper Client Services toll-free at 877.955.4773 or via email at LipperClientServices@ thomsonreuters.com. For more information about Lipper, please visit our website at www.lipperweb.com. Join our “Closed-End Fund and ETF Forum” group on LinkedIn for the latest discussions on trends, developments and challenges in …yourCEF and ETF industries.Investment the link with the Global Follow us! Community …your link with the Global Investment Community Follow us on Twitter. Your source to the CEF & ETF industries. 6 6
  • 7. CEF Performance Statistics Average of Average of Average 1MO NAV 1MO MKT P/D Change Change 12/31/2013 Category Average P/D 1/31/2014 Average 1 MO P/D Change Average YTD NAV Change Average YTD MKT Change Average YTD P/D Change High Yield Funds 0.1% -0.3% -$7.58 -$7.05 $0.53 0.1% -0.3% $0.53 General Bond Funds -1.3% -1.7% -$3.61 -$4.13 -$0.52 -1.3% -1.7% -$0.52 Energy MLP Funds 0.0% 1.9% -$1.76 -$3.55 -$1.79 0.0% 1.9% -$1.79 Natural Resources Funds 2.4% 2.2% -$10.55 -$10.61 -$0.06 2.4% 2.2% -$0.06 Sector Equity Funds -1.7% -1.4% -$6.56 -$7.08 -$0.52 -1.7% -1.4% -$0.52 Emerging Markets Funds 9.2% 9.0% -$8.34 -$6.95 $1.39 9.2% 9.0% $1.39 Utility Funds 0.6% 0.4% -$7.48 -$7.22 $0.26 0.6% 0.4% $0.26 Pacific Ex Japan Funds 4.7% 5.7% -$9.40 -$10.25 -$0.85 4.7% 5.7% -$0.85 Core Funds Global Income Funds 3.8% 0.7% -0.4% 0.9% -$9.18 -$8.13 -$9.11 -$8.26 $0.07 -$0.13 3.8% 0.7% -0.4% 0.9% $0.07 -$0.13 Income & Preferred Stock Funds -1.0% -0.8% -$8.30 -$8.47 -$0.17 -1.0% -0.8% -$0.17 Corporate Debt Funds BBB-Rated -1.0% -1.3% -$10.06 -$9.77 $0.29 -1.0% -1.3% $0.29 U.S. Mortgage Funds General & Insured Muni Fds (Unleveraged) -1.9% -2.3% -$9.36 -$9.03 $0.33 -1.9% -2.3% $0.33 -2.2% -3.5% -$5.38 -$4.10 $1.28 -2.2% -3.5% $1.28 Value Funds 2.5% 4.5% -$10.49 -$11.74 -$1.25 2.5% 4.5% -$1.25 New Jersey Municipal Debt Funds -3.4% -3.3% -$9.78 -$9.80 -$0.02 -3.4% -3.3% -$0.02 Intermediate Municipal Debt Funds -2.3% -3.2% -$4.59 -$3.66 $0.93 -2.3% -3.2% $0.93 Real Estate Funds -1.9% -2.7% -$11.24 -$10.05 $1.19 -1.9% -2.7% $1.19 Pennsylvania Municipal Debt Funds Emerging Mrkts Hard Currency Debt Funds -3.3% -4.7% -$11.59 -$10.16 $1.43 -3.3% -4.7% $1.43 3.6% 4.8% -$10.00 -$11.09 -$1.09 3.6% 4.8% -$1.09 Other States Municipal Debt Funds -3.3% -4.2% -$8.91 -$8.34 $0.57 -3.3% -4.2% $0.57 California Municipal Debt Funds General & Insured Muni Debt Funds (Lever -3.7% -4.8% -$5.87 -$4.74 $1.13 -3.7% -4.8% $1.13 -3.7% -5.2% -$6.95 -$5.45 $1.50 -3.7% -5.2% $1.50 Options Arbitrage/Opt Strategies Funds 2.9% 2.0% -$7.19 -$6.31 $0.88 2.9% 2.0% $0.88 Developed Market Funds Corporate BBB-Rated Debt Funds(Leveraged 3.0% 3.4% -$9.19 -$9.50 -$0.31 3.0% 3.4% -$0.31 -1.5% -1.7% -$8.49 -$8.35 $0.14 -1.5% -1.7% $0.14 New York Municipal Debt Funds -2.8% -3.8% -$6.45 -$5.51 $0.94 -2.8% -3.8% $0.94 Global Funds 3.4% 4.1% -$10.89 -$11.38 -$0.49 3.4% 4.1% -$0.49 Convertible Securities Funds 0.6% -0.9% -$7.54 -$5.92 $1.62 0.6% -0.9% $1.62 Loan Participation Funds -0.4% -0.2% -$5.01 -$5.22 -$0.21 -0.4% -0.2% -$0.21 High Yield Funds (Leveraged) -0.4% -0.6% -$6.30 -$6.10 $0.20 -0.4% -0.6% $0.20 High Yield Municipal Debt Funds -2.7% -5.3% -$3.75 -$0.97 $2.78 -2.7% -5.3% $2.78 Growth Funds 2.5% 3.3% -$4.11 $8.47 $12.58 2.5% 3.3% $12.58 …your link with the Global Investment Community 7
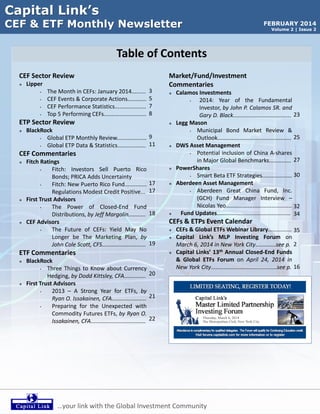
  • 8. Top 5 Performing CEFs Ticker Symbol 1-Month NAV Change Rank TKF 46% 1 Emerging Markets Funds ETF 14% 2 Emerging Markets Funds XCH 13% 3 Aberdeen Latin America Emerging Markets Funds LAQ 13% 4 Central Euro Russia & Tu Emerging Markets Funds CEE 12% 5 Fund Name Category Ticker Symbol Year-to-Date NAV Change Rank Turkish Investment Fund Emerging Markets Funds TKF 46% 1 Aberdeen EM SmCo Opptys Emerging Markets Funds ETF 14% 2 Aberdeen Chile Emerging Markets Funds XCH 13% 3 Aberdeen Latin America Emerging Markets Funds LAQ 13% 4 Central Euro Russia & Tu Emerging Markets Funds CEE 12% 5 Fund Name Category Ticker Symbol 1-Month Market Change Rank Turkish Investment Fund Emerging Markets Funds TKF 47% 1 Gabelli Multimedia Trust Global Funds GGT 16% 2 Aberdeen EM SmCo Opptys Emerging Markets Funds ETF 12% 3 Central Euro Russia & Tu Emerging Markets Funds CEE 12% 4 Aberdeen Latin America Emerging Markets Funds LAQ 12% 5 Fund Name Category Ticker Symbol Year-to-Date Market Change Rank Turkish Investment Fund Emerging Markets Funds TKF 47% 1 Gabelli Multimedia Trust Global Funds GGT 16% 2 Aberdeen EM SmCo Opptys Emerging Markets Funds ETF 12% 3 Central Euro Russia & Tu Emerging Markets Funds CEE 12% 4 Aberdeen Latin America Emerging Markets Funds LAQ 12% 5 Fund Name Category Ticker Symbol 1-Month P/D Change Rank DoubleLine:Oppor Crdt Fd General Bond Funds DBL $5.19 1 BlackRock MuniVest General & Insured Muni Debt Funds (Leveraged) MVF $4.31 2 Nuveen Muni Hi Inc Opp High Yield Municipal Debt Funds NMZ $4.18 3 Federated Prem Muni Inc General & Insured Muni Debt Funds (Leveraged) FMN $4.16 4 Invesco Tr Inv Grd NY New York Municipal Debt Funds VTN $3.81 5 Fund Name Category Ticker Symbol Year-to-Date P/D Change Rank DoubleLine:Oppor Crdt Fd General Bond Funds DBL $5.19 1 BlackRock MuniVest General & Insured Muni Debt Funds (Leveraged) MVF $4.31 2 Nuveen Muni Hi Inc Opp High Yield Municipal Debt Funds NMZ $4.18 3 Federated Prem Muni Inc General & Insured Muni Debt Funds (Leveraged) FMN $4.16 4 Invesco Tr Inv Grd NY New York Municipal Debt Funds VTN $3.81 5 Fund Name Category Turkish Investment Fund Emerging Markets Funds Aberdeen EM SmCo Opptys Aberdeen Chile …your link with the Global Investment Community 8
  • 9. Global ETP Monthly Overview Highlights (US$):1,2 GLOBAL EQUITY CUMULATIVE ETP FLOWS1 2014 YTD New Flows ($10.8bn) vs. 2013 Net Flows: $247.7bn The Global ETP Industry registered outflows of ($9.7bn) in January following average inflows of just under $30bn during the previous four months. The industry again enabled investors to quickly react to changing market sentiment at the outset of 2014. The impact on both market returns and ETP flows in January was reminiscent of 2010 and had the greatest impact on equities, particularly US and Emerging Markets exposures. Other areas of the Equity ETP landscape such as European and Japanese exposures continued to benefit from healthy investor appetite as they did in 2013. The Emerging Markets Equity outflows of ($10.0bn) for the month were triggered largely by two factors. A softer-than-expected Chinese manufacturing PMI reading of 49.6 signaled economic contraction and confirmed lingering fears of a slowdown in domestic demand.5 Additional pressure during January came from ongoing tapering, which was confirmed when the Fed announced a reduction of purchases by another $10bn per month to $65bn. A number of central banks in developing countries have tried to stem the general flight to quality by raising interest rates, but this has largely served to increase worries over growth and stability for weaker economies. The result is that investors have pulled back from Emerging Markets in favor of other investment themes as the category continues to see a correction following its popularity in the wake of the financial crisis. ETP outflows in January were heavily concentrated in iShares MSCI Emerging Markets (EEM) with ($5.5bn) and Vanguard FTSE Emerging Markets (VWO) with ($2.9bn). In January the MSCI Emerging Markets Index experienced a decline of (6.6%), greater than the (5.0%) for all of 2013.6 Longer term, growth prospects for Emerging Markets remain attractive relative to the developed world. However, the current market environment is indicative of the volatility of investing in Emerging Markets and favors careful country selection as opposed to broadbased investment. US Equity Pan European Equity Japan Equity Other Developed EM Equity PAN EUROPEAN EQUITY FLOWS1 2014 YTD Net Flows: $4.0bn vs. 2013 Annual $26.5bn US Equity outflows of ($12.0bn) in January were impacted by the Emerging Markets volatility but also reflected concerns over valuations Europe Listed US Listed Other Regions HISTORICAL JANUARY GLOBAL ETP FLOWS1 37.0 40 33.5 EQUITY ETP FLOWS: JANUARY 2010 VS. JANUARY 20141,6 (Flows in US $billions) January 2010 January 2014 Index Return Flows Return Flows US Large Cap S&P 500 (3.7%) (18.4) (3.6%) (15.9) Emerging Markets MSCI EM (5.6%) 1.1 (6.6%) (10.0) (4.4%) 2.7 (4.1%) 11.2 13.9 20 Equity Category Non-US Developed Markets MSCI EAFE (13.3) 0 (9.7) -20 2010 Equity 2011 Fixed Income 2012 2013 Commodity 2014 Other Source: BlackRock …your link with the Global Investment Community 9
  • 10. Global ETP Monthly Overview (cont’d) Highlights (US$):1,2 after last year’s impressive stock market performance. While the S&P 500 gained 29.6% in 2013 propelled by investor optimism, it has started the year down (3.6%) indicating wariness that the market can continue its run.6 Also, fourth quarter earnings have not lived up to expectations in general given continued signs of an improving economy. Initial Q4 GDP growth estimates of 3.2% annualized7 (following 4.1% in Q3) indicated continued improvement in consumer demand and business investment. The US Equity ETP outflows were concentrated in Large Cap with ($15.9bn), the majority from SPDR S&P 500 (SPY) which shed ($14.6bn). All other US Equity inflows were modest but positive at $3.8bn, driven by well-diversified Sector inflows of $2.9bn. Health Care led with $1.2bn and Technology added $1.0bn. JANUARY RESULTS AT A GLANCE1 (US $billions) January 2014 December 2013* January 2013 January 2012 Monthly Flows (9.7) 24.2 37.0 33.5 Assets 2,321 2,396 2,044 1,651 # of ETPs 5,025 4,988 4,788 4,411 Jun-Dec 2013 restated with minor corrections to Europe data and delisting adjustments GLOBAL 13-MONTH ROLLING NET FLOWS1 2014 YTD Net Flows: ($9.7bn) vs. 2013 Net Flows: $235.7bn (US$bn) Pan-European Equity had another month of attractive flows – its seventh in a row – contributing $4.0bn. Investors continue to look to the region due to its improving economic growth outlook as well as for return prospects given already strong gains in the US. The preliminary January eurozone PMI reading of 53.2 was the best since June 2011 and was highlighted by German manufacturing.8 Broad-Based Developed Markets Equity (Global/Global ex-US) flows of $3.7bn and Japanese Equity flows of $4.0bn also reinforced the current focus on non-US exposures. The Japanese flows included $1.2bn from Bank of Japan stimulus-related purchases. Fixed Income ETP flows in January remained moderate but positive at $3.3bn led by Short-maturity funds with $1.9bn but also including inflows for Intermediate and Long-term maturities. European exposures were the key driver with $1.7bn. In the US, the recent flight to quality has led to a drop in the 10-Year Treasury rate to 2.64%9 and modest Treasury ETP inflows. Equity Fixed Income CUMULATIVE EQUITY ETP FLOWS1 CUMULATIVE FIXED INCOME ETP FLOWS1 2014 YTD Equity Flows: ($10.8bn) Commodities & Others 2014 YTD Fixed Income Flows: $3.3bn Source: BlackRock …your link with the Global Investment Community 10
  • 11. Milestone -5,000 ETPs Highlights (US$):1,2 GLOBAL ETP ASSETS & NUMBER OF ETPS BY YEAR1 Global ETPs listings have exceeded 5,000 for the first time in history. It’s a remarkable milestone considering it took the industry more than 15 years to reach its first 2,000 products but only six more years to reach 5,000. For comparison, the US mutual fund industry took nearly 50 years to reach the 2,000 mark in the late 80s and another eight years to reach 5,000. • • • • • Regionally speaking, the US accounts for the largest share of ETP assets (71% or $1.6 trillion) while Europe has most products available on the market (2,141 or 43%). ETP providers also launched more products in Europe in the last five years than any other region. However, for 2013 alone, US has seen 158 new ETPs, eight more than in Europe. Asia Pacific on the other hand has the highest growth rate in the past five years, as the number of ETPs quadrupled. # ETPS LAUNCHED PER YEAR PER REGION1 (Primary Listings only, excluding Individual Share Classes) Asia Pacific The speed of new launches has moderated since 2012. Total new launches (excluding share classes) in 2013 totaled 430, with $26.4bn gathered within the year. That is considerably less than the $37.1bn gathered during 2010 across 929 new funds but ahead of 2011 when 876 new products finished that year with only $23.6bn in assets. Canada Latin America Middle East & Africa Looking at asset classes, EM Equity and Fixed Income maintained their pace of new launches in 2013. However, commodity funds dwindled as the end of the commodity super cycle and consistent outflows from existing ETPs last year took a toll on the pipeline. Product rationalization has doubled to around 200 per year in 2012 and 2013, up from the 100 redemptions seen on average each year since 2009. The majority of fund closures come from the US and Europe. There were 119 funds delisted in Europe in 2013, whereas in the US only 67 ETPs closed. Europe US # ETPS LAUNCHED PER YEAR PER ASSET CLASS1 (Primary Listings only, excluding Individual Share Classes) The top three ETP providers globally have maintained their ETP launches in recent years, averaging 95 new funds per year since 2006. The majority of the new funds globally are from smaller providers. Others Commodities Fixed Income EM Equity Developed Equity Source: BlackRock …your link with the Global Investment Community 11
  • 12. Global ETP Year-To-Date Overview GLOBAL ETP YTD FLOWS BY EXPOSURE1 (US$bn) Jan 2014 Jan 2013 Annual 2013 GLOBAL ETP CUMULATIVE NET FLOWS1 2014 YTD Flows ($9.7bn) vs. 2013 Net Flows: $235.7bn GLOBAL EQUITY ETP FLOWS BY EXPOSURE1 2014 Jan Net Flows ($10.8bn) vs. 2013 Jan Net Flows $34.5bn January 2014 January 2013 Source: BlackRock …your link with the Global Investment Community 12
  • 13. Largest Year-to-Date Fund Inflows and Outflows ETPs as of January 2014 (US$mn)1 Bloomberg Ticker ETPs as of January 2014 (US$mn)1 Bloomberg Ticker 2014 YTD Inflows 2014 YTD Outflows Jan-14 Assets Jan-14 Assets Source: BlackRock …your link with the Global Investment Community 13
  • 14. Largest Asset Gathering ETPs Launched in 2014 Highlights (US$):1  47 new ETPs and 3 individual share class listings debuted around the globe so far this year and have accumulated $1.0bn in assets Product Name (US$mn)1 Bloomberg Ticker  10 products and 2 individual share class listings were delisted this year with combined assets of less than $40mn Exposure Listing Region Others Launch Date Assets as of Jan-2014 128.7 Source: BlackRock …your link with the Global Investment Community 14
  • 15. Global ETP by Exposure – Developed Equity Exposure (US$mn) Jan 2014 Net Flows 1 Large Cap Mid Cap Small Cap Micro Cap US Size and Style Total Market Extended Market Preferred Stock US Size and Style Total Basic Materials Consumer Cyclicals Consumer Non-cyclicals Energy Financials Health Care US Sector Industrials Real Estate Technology Telecommunications Utilities Theme US Sector Total US Strategy US Total Canada Equity North America Regional Equity North America Total Large Cap Mid Cap Pan European Small Cap Size and Style Total Market Pan European Size and Style Total Pan European Sector Pan European Strategy Pan European Total Germany 2014 YTD Net Flows % of 2014 YTD Flows Assets % of Assets # ETPs (15,878) 628 (2,297) 24 1,911 150 (121) (15,581) 498 (1,047) (115) 312 (490) 1,190 86 854 1,035 107 464 6 2,901 649 (12,031) (728) 277 (12,482) 337 (46) 543 2,709 (15,878) 628 (2,297) 24 1,911 150 (121) (15,581) 498 (1,047) (115) 312 (490) 1,190 86 854 1,035 107 464 6 2,901 649 (12,031) (728) 277 (12,482) 337 (46) 543 2,709 163.4 (6.5) 23.6 (0.2) (19.7) (1.5) 1.2 160.3 (5.1) 10.8 1.2 (3.2) 5.0 (12.2) (0.9) (8.8) (10.7) (1.1) (4.8) (0.1) (29.9) (6.7) 123.8 7.5 (2.9) 128.5 (3.5) 0.5 (5.6) (27.9) 454,811 83,620 84,477 1,105 65,192 4,064 12,241 705,509 7,568 14,566 9,675 32,683 30,807 27,281 15,088 29,764 26,023 1,130 7,400 1,109 203,094 69,253 977,856 30,648 8,182 1,016,686 43,374 1,178 3,873 48,246 19.6 3.6 3.6 0.0 2.8 0.2 0.5 30.4 0.3 0.6 0.4 1.4 1.3 1.2 0.7 1.3 1.1 0.0 0.3 0.0 8.8 3.0 42.1 1.3 0.4 43.8 1.9 0.1 0.2 2.1 238 49 70 4 64 2 5 432 15 19 13 45 39 30 18 24 28 6 13 8 258 65 755 88 21 864 82 9 12 69 3,541 3,541 (36.4) 96,600 4.2 170 455 28 4,026 (310) 455 28 4,026 (310) (4.7) (0.3) (41.4) 3.2 13,964 3,211 113,847 39,562 0.6 0.1 4.9 1.7 151 20 343 65 23 23 (0.2) 20,660 0.9 52 (123) (80) (123) (80) 1.3 0.8 10,228 5,684 0.4 0.2 23 18 758 758 (7.8) 12,335 0.5 67 268 268 (2.8) 88,469 3.8 225 4,294 (295) 4,023 4,294 (295) 4,023 (44.2) 3.0 (41.4) 202,316 15,359 139,132 8.7 0.7 6.0 568 60 243 Asia Pacific Total 3,729 3,729 (38.4) 154,491 6.7 303 Broad-Based Global /Global ex-US Developed Equity Total 3,660 (799) 3,660 (799) (37.7) 8.2 199,100 1,572,594 8.6 67.8 458 2,193 U.K. Switzerland France Country Others Europe Single Country Total Europe Total Regional Country Asia-Pacific Source: BlackRock …your link with the Global Investment Community 15
  • 16. Endnotes Endnotes: BlackRock’s ETP Landscape: Monthly Highlights report "ETP" (or exchange traded product) as referred to above means any portfolio exposure security that trades intraday on a US exchange. ETPs include exchange traded funds (ETFs) registered with the SEC under the Investment Company Act of 1940 (open-end funds and unit investment trusts or UITs) and certain trusts, commodity pools and exchange traded notes (ETNs) registered with the SEC under the Securities Act of 1933. The data for this report are captured from a number of sources by the BlackRock Investment Institute including provider websites, fund prospectuses, provider press releases, provider surveys, Bloomberg, the National Stock Exchange, Strategic Insight Simfund, Wind and the Bank of Israel. All amounts are reported in US dollars. Flows are derived using daily net asset values and shares outstanding using the most recent data we can capture at month-end. For products with cross-listings, we attribute net flows and assets to the primary listings. For Middle East and Africa, net flows data is not available. Assets are derived using shares outstanding and prices at the end of each month (or the closest date available). Where price is not available, we use an approximation. For ETPs listed in Israel, product level detail is not available. Product level information is aggregated by provider, asset class, exposure, region listed and replication method to produce the various analyses in the report 1. 2. 3. 4. 5. 6. 7. 8. 9. Data is as of January 30, 2014 for Europe and January 31, 2014 for the US, Canada, Latin America, Israel, and some Asia ETPs. Some Asia ETP data is as of December 31, 2013. Global ETP flows and assets are sourced using shares outstanding and net asset values from Bloomberg for the US, Canada, Europe, Latin America and some ETPs in Asia. Middle East ETP assets are sourced from the Bank of Israel. ETP flows and assets in China are sourced from Wind. Inflows for years prior to 2010 are sourced from Strategic Insights Simfund. Asset classifications are assigned by the BlackRock based on product definitions from provider websites and product prospectuses. Other static product information is obtained from provider websites, product prospectuses, provider press releases, and provider surveys. Market returns are sourced from Bloomberg. We classify maturity buckets of a Fixed Income ETP if the fund invests at least 70% of its assets in the corresponding maturity/exposure range: Short maturity includes: underlying security maturities < 3 years and floating rate where the fund holds floating rate securities and/or bank loans. Intermediate includes: 3 years < underlying security maturities < 10 years. The “other” category includes Long-Term: underlying security maturities > 10 years; Broad Maturities: The fund invests in more than two maturity buckets without emphasizing one; Selected Maturities: The fund holds securities with multiple selected range of maturity buckets, i.e. barbell strategy which focuses on the specific short-term and long-term buckets with even weights; and Fixed Maturity: The fund itself has a target maturity date and arranged holdings correspondingly. Source: BlackRock, Bloomberg, Reuters Mutual fund data is sourced from EPFR (excluding Money Market funds and ETFs). 2013 date is sourced from EPFR monthly data. January 2014 data is sourced from EPFR weekly data for the four weeks ended January 29, 2014. Money Market mutual fund flows is sourced from EPFR weekly data for the four weeks ended January 29, 2014. Source: HSBC Source: Bloomberg (S&P 500, MSCI EM and MSCI EAFE index returns in US dollars) Source: US Bureau of Economic Analysis (BEA) Source: Markit Source: Bloomberg (US Treasury Generic 10 Year yield index) Disclosures: (c) 2014 BlackRock, Inc. All rights reserved. Reprinted with permission. The ETF Sector Review is for informational purposes only, and does not constitute investment advice or an offer to sell or the solicitation of an offer to buy any security of any entity in any jurisdiction. The ETF Sector Review represents an assessment of the market environment at a specific time and is not intended to be relied upon by the reader as research, a forecast of future events or a guarantee of future results. The ETF Sector Review does not provide financial, investment or tax advice or information relating to the securities of any particular fund or other issuer. The information and opinions included are based on publicly available information, are subject to change and should not be relied upon for any purpose other than general information and education. This Review has been prepared without regard to the individual financial circumstances and objectives of those who receive it and the types of securities discussed in this publication may not be suitable for all investors. The information included in the ETF Sector Review has been taken from trade and other sources considered to be reliable. This document is published in good faith but no representation or warranty, express or implied, is made by BlackRock or by any person as to its accuracy or completeness and it should not be relied on as such. BlackRock or any of its directors, officers, employees or agents shall have no liability for any loss or damage arising out of the use or reliance on the material provided including without limitation, any loss of profit or any other damage, direct or consequential. Any opinions expressed in this document reflect our analysis at this date and are subject to change. …your link with the Global Investment Community 16
  • 17. Closed-End Funds Report & Rating Actions Fitch: Investors Sell Puerto Rico Bonds; PRICA Adds February 12, 2014 Uncertainty Authored by: Fitch Ratings-New York-12 February 2014: Pressure on US mutual funds to sell Puerto Rico (PR) bonds could contribute to deteriorating capital markets for the commonwealth's debt, Fitch says. Tuesday's credit downgrade and recent updates to the Puerto Rico Investment Company Act of 2013 (PRICA) may introduce additional selling pressures by mutual funds operating out of PR. Funds already cut their exposure to PR bonds significantly in the second half of 2013. Fitch Tuesday downgraded PR general obligation and certain GO-linked credits to 'BB' from 'BBB-', resolving a negative rating watch from Nov 14, 2013. COFINA sales tax bonds, the island's top credit, remained at 'AA-/A+'. US mutual funds have already sold much of their PR municipal bond holdings since May 2013. Fitch reviewed holdings of 92 Fitch rated municipal closedend funds across 6 large asset managers. The group cut their PR exposure, on average, by more than 65% through Dec 2013, with two managers exiting their holdings entirely. Yuriy Layvand, CFA Director, Fund and Asset Management +1 212 908-9191 Kellie Geressy-Nilsen Senior Director, Fitch Wire +1 212 908-9108 US mutual funds have historically invested in PR bonds because of its triple tax-exempt status and good liquidity compared to eligible non-PR issues. For example, a single-state fund investing in bonds exempt from Federal and New York State income tax might have 95% New York State municipal bonds and 5% PR municipal bonds. Fitch: New Puerto Rico Fund Regulations Modest Credit Positive January 29, 2014 Fitch Ratings-New York-29 January 2014: The new Puerto Rico Investment Companies Act of 2013 makes several improvements to the regulatory oversight of the island's $11billion-plus fund industry that are modestly credit positive for rated short- and medium-term notes issued by Puerto Rican closedend funds (PR CEFs), according to Fitch Ratings. The act revamps compliance and governance rules, allows for greater diversification outside of Puerto Rico, establishes formal fund leverage limits, creates a new type of tax-advantaged structure, and mandates all rulings by the Commissioner of Financial Institutions be made public going forward, according to local law firm López Sánchez Pirillo & Hymovitz, which specializes in this area. Authored by: Yuriy Layvand, CFA Existing funds are for the most part grandfathered in the Investment Companies Act of Puerto Rico of 1954 (Old Law), except for having to comply with new rules with respect to affiliate transactions, tighter governance over fund directors and officers, and uniformity over repurchasing fund stock from investors. These changes closer align local investment companies with protections already in place for U.S. mutual funds under the U.S. Investment Company Act of 1940, as amended. Moreover, shareholder approval is needed to convert existing funds to the new law, which may prove challenging. Director, Fund and Asset Management +1 212 908-9191 Ian Rasmussen Senior Director Fund and Asset Management +1 212 908-0232 Kellie Geressy-Nilsen Senior Director, Fitch Wire +1 212 908-9108 Rating Actions To access the complete rating action, please click on the links below. • Fitch Rates & Affirms Preferred Shares of Nuveen Pennsylvania Investment Quality Muni Fund on Merger – January 10, 2014 • Fitch Rates Kayne Anderson MLP Investment Co's Sr Notes 'AAA'; Affirms Existing Ratings – February 10, 2014 • Fitch Affirms Clearbridge Closed-End Fund Notes at 'AAA – February 6, 2014 • Fitch Rates Auction Rate Preferred Shares of Four Gabelli Equity Closed-End Funds 'AA' – January 28, 2014 …your link with the Global Investment Community 17
  • 18. CEF Commentary The Power of Closed-End Fund Distributions January 21, 2014 Albert Einstein once said, “Compound interest is the eighth wonder of the world. He who understands it, earns it ... he who doesn't ... pays it.” Long-term investors in closed-end funds (CEFs) are keenly aware of this principle. The majority of CEFs have the goal of distributing current income as their primary investment objective and historically the majority of a CEF’s total return has come from the distributions it makes. This doesn’t mean an individual CEF or category of CEFs cannot earn capital appreciation along with distributions, rather as the data below indicates it simply means over long periods of time the majority of the total return CEFs historically provide comes from the distributions. Below are data points which clearly show the power of CEF distributions adding up over time and making up all of the positive return the First Trust CEF Indexes have earned over the past eight years. Each First Trust Index below shows two returns. The blue bars exclude distributions and only include the price return. The bars shaded in green are total return and include the price return plus the distributions. The data is very compelling. It clearly illustrates the power of CEF distributions compounding over time and contributing significantly to the total return of these broad based CEF indexes. When putting this chart together I used data which goes back almost eight years and therefore includes the significant price downturn experienced in 2008. If I had used data which only goes back five years it would still show the majority of the return earned in these indexes coming from the distributions, however it would show some of the return coming from capital appreciation as well. For example, the First Trust Closed-end Fund Composite Price Index (UPCEF) had a cumulative return of 41.67% from 12/31/2008 -12/31/2013. The First Trust Closed-end Fund Composite Total Return Price Index (UPCEFT) generated a cumulative total return of 110.04% during the same five year period (12/31/2008-12/31/2013). Whether looking at this total return data over five years or eight years the point remains the same. The distributions CEFs make on a regular basis can have a significant impact on the total returns investors have historically earned in CEFs. If an investor owns one CEF or a portfolio of dozens of funds, I believe it is critical to always consider the distributions when calculating the return as in all likelihood the distributions will make up a substantial part of the total return. Authored by: Jeff Margolin Senior Vice President Closed-End Fund Analyst FirstTrust Advisors,LP. The chart is for illustrative purposes only and not indicative of any investment. Past performance is no guarantee of future results. The First Trust Composite Closed-End Fund Index is a composite index of the municipal, taxable fixed income and equity indexes and is intended to provide a capitalization weighted representation of the entire U.S. closed-end fund universe. The First Trust Municipal Closed-End Fund Index is a capitalization weighted index designed to provide a broad representation of the U.S. municipal closed-end fund universe. The First Trust Taxable Fixed Income Closed-End Fund Index is a capitalization weighted index designed to provide a broad representation of the taxable fixed income closed-end fund universe. The First Trust Equity Closed-End Fund Index is a capitalization weighted index designed to provide a broad representation of the equity based closed-end fund universe. An index cannot be purchased directly by investors. Closed-end funds are subject to various risks, including management’s ability to meet the fund’s investment objective, and to manage the fund’s portfolio when the underlying securities are redeemed or sold, during periods of market turmoil and as investors’ perceptions regarding the funds or their underlying investments change. Unlike open-end funds, which trade at prices based on a current determination of the fund’s net asset value, closed-end funds frequently trade at a discount to their net asset value in the secondary market. Certain closed-end funds may employ the use of leverage which increases the volatility of such funds. All opinions expressed constitute judgments as of the date of release, and are subject to change without notice. There can be no assurance forecasts will be achieved. The information is taken from sources that we believe to be reliable but we do not guarantee its accuracy or completeness. …your link with the Global Investment Community 18
  • 19. CEF Commentary The Future of Closed-End Funds: Yield May No Longer be The Marketing Plan February 7, 2014 Closed-end funds (CEFs) are three things: Permanent Capital, Active Management and Investor Liquidity. The fixed capital feature is where the “closed” comes from as funds are created through an IPO and do not offer a daily exchange of shares at net asset value (NAV). CEFs have active management and offer investors daily liquidity on US exchanges. We see these characteristics as benefits because the fund manager doesn’t have to deal with redemption and in-flow pressures. CEFs are also able to offer preferred stock and employ other forms of leverage. These unique features have allowed CEFs, especially in the past 10 years, to focus on yield-oriented strategies without having to face the same pressures that open-end funds have. With past trend of falling interest rates, it has been a very favorable environment for CEFs. According to our CEF Universe data, from December 31, 2003 through December 31, 2013, there have been 218 funds IPOed from 59 different fund sponsors, raising approximately $125 billion in investible assets at IPO. For perspective the CEF Universe is now about $250 billion in total net assets. The average IPOed fund had approximately $570M in assets. Presently, 159 or about 73% of the funds have some amount of leverage employed with 145 (67%) using more than 10% effective leverage. It is fair to say CEFs generally use their leverage capabilities. Leverage has been broadly applied in almost every corner of the CEF universe except Covered Call Equity Funds, which by design have the goal of a less volatile NAV, for which leverage would be unlikely to facilitate. For the past decade yield and CEFs has almost been unanimous. For example, there are now only three equity funds currently showing a market yield under 5%. Major Grouping Municipal Bond Taxable Bond Specialty Equity US Equity Non US Equity Commodity In the tables below we have summarized the last decade of CEF IPOs from December 31, 2003 through December 31, 2013. Authored by: John Cole Scott, CFS EVP, PortfolioManager, Closed-Endfund Advisors,Inc. What does the future hold for closed-end funds? We think that CEFs in the future will include less yieldfocused endeavors, where leverage is applied for more capital appreciation goals than simply the goal of increasing the dividend yield of the underlying securities. We believe that investment objectives and portfolio managers which investors have no other way to access, other than through these new CEFs, will fuel demand for CEFs that are more about growing capital than only producing income. Investors are generally disfavored with “Hedge Funds”, which we think are misnamed; not all Hedge Funds actually “hedge out” market risk, though there are still a good number that do state it as an investment objective. Hedge funds are actually just a pooled investment structure for accredited investors ($2M in net worth) where the portfolio manager can participate in the portfolio’s growth. They generally have a fee structure that looks like 2% per year and 20% of high water (new) gains. We think investors that had previously searched out this type of manager can find comfort and liquidity in a potential new generation of CEFs. Why Alternatives Make Sense in a CEF Structure? It is simple, fixed capital allows for less liquid investments and no redemption pressures. This is exactly the type of investments that hedge funds have often used for clients. The CEF world needs great managers with ideas and investment mandates that are not available or ideal to ETF or open-end funds, to lead the way for this endeavor. # Funds IPOed $AUM IPOed Largest Areas for CEF IPOs # Funds IPOed $AUM IPOed Current Lev% Current Avg Mkt Pr Yirld 19 $6.5B Equity - Covered Call 31 $25.4B 3% 9.1% 68 $33.0B MLP Funds 26 $13.2B 23% 6.7% 87 $53.3B Loan Funds 19 $8.1B 30% 7.4% 15 $7.9B Municipal 19 $6.5B 25% 6.0% 24 $14.6B Energy, Utility 16 $6.7B 16% 7.6% 5 $2.5B Multisector Bond 14 $10.8B 29% 8.0% Data from our CEF Universe Report dated 1/31/2014. It should be noted that our data currently has a survivorship bias. We do not have access to data on funds that merged, liquidated or open-ended that IPOed since 12/31/2003. …your link with the Global Investment Community 19
  • 20. ETF Commentary Three Things to Know about Currency Hedging February 10, 2014 As investors seek international equity exposure as a means of enhancing portfolio diversification to reduce risk, Dodd Kittsley explains why it’s important to take note of the impact of currency on total returns. In the past month, non-U.S. developed markets equity ETFs attracted $11.2 billion. Pan-European equity, which I’ve discussed before on the Blog, brought in $4 billion. During the same period, broad-based developed markets equity added $3.7 billion, and Japanese equity exposures attracted $4 billion. We believe this trend will continue, and recently upgraded our view of Europe and Japan from neutral to overweight, as noted in BlackRock’s latest Investment Directions. As U.S. investors allocate more overseas for exposure to potential enhanced returns and reduced risk through diversification, many of them are unaware of how currency can impact the overall return of any international equity investment. In fact, currency can often contribute more to your return than the underlying security itself. I like to think of it as simply as Total Investor Return = Equity Return + Currency Return Your total return depends on both equity and currency returns, which are sensitive to economic, political, and market events, and fluctuate over time. Below is an illustration of the historical effects of currency fluctuation, comparing the MSCI EAFE USD and the MSCI EAFE Local Index. As you can see, currency values can drastically impact total return. For example, the effect of currency in 2003 added 18% to an investment in the MSCI EAFE Index for U.S. investors. This was a time when the U.S. dollar weakened relative to other currencies, in particular the euro and the yen, and an unhedged investment paid off. Another example is in 2005, where the effect of currency took 15% from an investment in the MSCI EAFE Index for U.S. investors. This was a time when the U.S. dollar strengthened relative to other currencies, and marked a year where hedged investment paid off. Think of it this way: if you have a positive view of the underlying market equities in a foreign country, and a weak view of the U.S. dollar (i.e. appreciating local currency), you could select an unhedged currency investment, which most international equity ETFs currently offer. On the other hand, if you have a positive view of underlying market equities in a foreign country, and a strong view of the U.S. dollar (i.e. depreciating local currency), you could select a currency hedged product. When the U.S. dollar appreciates, gains on international equity investments can diminish when converted back into U.S. dollars. This is especially relevant right now, as we expect the dollar to strengthen this year. In a stronger U.S. dollar environment, hedged investments tend to outperform. Investors seeking pure exposure to underlying international markets can help to neutralize currency risk with a currency hedged investment or ETF. Here are three things to keep in mind: Authored by: Dodd Kittsley, CFA Director, Global Head of ETP Research, BlackRock 1. The effects of currency fluctuations are more relevant today than ever before. Investors are beginning to allocate a greater proportion of their overall portfolios to international developed and emerging markets to avoid home country bias, or over-investing in one’s own country. As my colleague Russ Koesterich points out in a recent post, investors often exaggerate the benefit of physical proximity and thus have overlyconcentrated portfolios. Awareness of this bias has increased recently and combined with attractive fundamentals in markets outside the US- a reallocation outside the US is clearly underway. 2. Currency hedged investments historically have exhibited less volatility than unhedged. What’s more, hedged products are now large, liquid and accessible to the average investor, offering international exposures while reducing the risk of currency fluctuations. Three new solutions include the iShares Currency Hedged MSCI Japan ETF (HEWJ), the iShares Currency Hedged MSCI EAFE ETF (HEFA), and the iShares Currency Hedged MSCI Germany ETF (HEWG). 3. Investors are beginning to take note of the value of currency hedged ETFs. In fact, currency hedged ETF flows hit a record $19.35 billion in 2013. …your link with the Global Investment Community 20
  • 21. ETF Commentary 2013 - A Strong Year for ETFs January 24, 2014 Strong ETF Net Inflows for 2013 US-listed ETF1 net inflows totaled $185.5 billion in 2013, setting a new record.2 While the largest percentage of net inflows remained concentrated among a relatively small group of the 1521 US-listed ETFs, investors broadened their horizons more in 2013 than in previous years, as 312 ETFs had net inflows exceeding $100 million. 2013 was also a record-setting year for First Trust’s ETF complex. Net inflows for the 79 First Trust ETFs totaled $8.2 billion in 2013, with 24 ETFs exceeding $100 million in net inflows, increasing ETF assets under management (AUM) at First Trust to $19.7 billion. As of 12/31/13, First Trust was the 9th largest sponsor of USlisted ETFs. Strong Inflows Continued for Equity Income ETFs Equity income remained a prominent theme for ETF net inflows in 2013, continuing a trend that began in March of 2009. From 3/31/09 to 12/31/13, assets in domestic equity income ETFs grew from $5 billion to over $65 billion. Generally speaking, investors in these ETFs were rewarded with solid returns during that stretch. However, looking ahead many equity income ETFs with overweight allocations to non-cyclical sectors may face headwinds in 2014, in our opinion, especially if mid- and long-term interest rates continue to trend higher. Investors with a preference for dividend-paying stocks, but concerns about rising interest rates, may consider reallocating assets from ETFs focused on high dividend yielding stocks to ETFs focused on dividend growth stocks. Although equity income ETFs apply a variety of different strategies for constructing their respective portfolios, one common characteristic currently shared by many of these funds is a sector allocation that tends to overweight relatively high dividend yielding sectors with below average dividend growth (such as the utilities and consumer staples sectors), and underweight sectors with lower dividend yields but greater opportunity for dividend growth potential (such as the technology and financial sectors). As we discussed in last July’s edition of “Inside First Trust ETFs,” we believe that stocks with growing dividends may perform better than those lacking dividend growth during periods of rising interest rates. Indeed, this was the case in 2013, as the 10 year US Treasury yield increased by 137 basis points from 5/2/13-9/5/13. During that period, returns for the S&P 500 Utilities and Consumer Staples Sectors, were 9.4% and -2.8%, respectively, while returns for the S&P 500 Information Technology and Financial Sectors were +5.2% and +6.7%, respectively. Authored by: Ryan O. Issakainen, CFA Senior ViP, Exchange Traded Fund Strategist, First Trust Advisors L.P. If interest rates continue trending higher in 2014 (First Trust economists forecast a 3.65% 10-year US Treasury yield by year-end), it may be prudent to consider repositioning equity income ETF assets to seek dividend growth. One ETF that may be considered by investors looking to increase exposure to dividendpaying technology companies is the First Trust NASDAQ Technology Dividend Index Fund (TDIV). For those seeking increased exposure to the financial sector, the First Trust NASDAQ® ABA Community Bank Index Fund (QABA) invests in a portfolio of community banks. We believe this segment of the financial sector is particularly well-positioned to benefit if the yield curve steepens in 2014. Finally, investors looking for a more diversified portfolio of stocks that have consistently increased dividends in the past, and may be well positioned to increase dividends in the future, may consider the First Trust NASDAQ Rising Dividend Achievers ETF (RDVY). AlphaDEX and “Smart Beta” In our opinion, one of the most interesting developments in the ETF industry in 2013 was the growing acceptance of ETFs tracking alternative strategies for selecting and weighting stocks, often labelled as “smart beta” strategies by ETF industry pundits. Of course, not all smart beta strategies are equally smart, and many investors may decide to wait for some of the newcomers to develop longer-term track records before considering them. …your link with the Global Investment Community 21
  • 22. ETF Commentary Preparing for the Unexpected with Commodity Futures ETFs Three straight years of negative returns for broad commodity benchmark indices, such as the Dow JonesUBS Commodity Total Return Index, have led some investment advisors (and their clients) to begin questioning the rationale for including commodity futures ETFs1 in their asset allocation models. Relatively tame inflation expectations seem to support these doubts, as commodities are often thought of as a hedge against inflation. However, the fact that inflation expectations are so low may actually highlight one of the most important reasons for maintaining (or adding) a strategic allocation to commodity futures ETFs: in order to hedge against unexpected inflation. Unexpected inflation is a risk worth hedging, in our opinion, because it tends to have a negative impact on both stocks and bonds. For example, when inflation is accurately forecasted, manufacturing companies can utilize futures contracts to lock in their future costs for certain raw materials, in order to manage their profit margins. However, when input costs rise unexpectedly, profit margins may be compressed for companies that have difficulty passing these cost increases along to their customers, which, in turn, tends to hurt stock prices. Bondholders are negatively impacted by unexpected inflation as well, since bond yields are set by the market with an embedded inflation expectation. When inflation increases unexpectedly, the real value of bond interest payments is reduced, which may also negatively impact bond prices, as the market requires higher nominal yields. Similar to stocks and bonds, the prices of commodity futures also have embedded inflation expectations, but unlike stocks and bonds, commodity futures prices tend to be positively impacted by unexpected inflation increases.2 This relationship enables investors to potentially utilize commodity futures and related ETFs as an effective hedge against unexpected inflation. Of course, it’s difficult to make a strong case for when unexpected inflation may show up, which is ultimately what makes it unexpected. While there are certainly conditions in place that could eventually lead to higher levels of inflation, First Trust’s forecast for year-overyear US CPI growth of 1.8% in 2014 and 2.3% in 2015 is only slightly higher than the median forecast among Bloomberg contributors (1.6% for 2014 and 2.0% for 2015). But this underscores why we believe it makes February 10, 2014 sense to include a strategic allocation to commodity futures ETFs in an asset allocation model: not as a tactical play based on our expectation of unexpected inflation, but as a tool to manage the risk of unexpected inflation, which, by definition, you don’t see coming. the sake of clarity, the term “ETF” is used to refer to all exchange-traded products (1940 Act exchangetraded funds, exchange-traded notes, commodity exchange-traded securities, etc.). 1 For Gorton and K. Geert Rouwenhorst. 2006. “Facts and Fantasies about Commodity Futures.” Financial Analysts Journal, vol. 62, no. 2 (March/April 2006):47– 68. 2 Gary Authored by: Ryan O. Issakainen, CFA Senior ViP, Exchange Traded Fund Strategist, First Trust Advisors L.P. You should consider a fund's investment objectives, risks, and charges and expenses carefully before investing. You can download a prospectus or summary prospectus, or contact First Trust Portfolios L.P. at 1-800-621-1675 to request a prospectus or summary prospectus which contains this and other information about a fund. The prospectus or summary prospectus should be read carefully before investing. The Dow Jones-UBS Commodity Index is made up of exchange-traded futures on physical commodities and represents 20 commodities, which are weighted to account for economic significance and market liquidity. Indexes are unmanaged and an investor cannot invest directly in an index. Investors buying or selling ETF shares on the secondary market may incur customary brokerage commissions. Market prices may differ to some degree from the netasset value of the shares. Investors who sell fund shares may receive less than the share’s net asset value. Shares may be sold throughout the day on the exchangethrough any brokerage account. However, unlike mutual funds, shares may only be redeemed directly from the fund by authorized participants, in very large creation/redemption units. A fund’s shares will change in value, and you could lose money by investing in a fund. One of the principal risks of investing in a fund is market risk. Market risk is the risk that a particular security owned by a fund, fund shares or the market in general may fall in value. The trading prices of commodities futures fluctuate in response to a variety of factors which will cause a fund’s net asset value and market price to fluctuate in response to these factors. As a result, an investor could lose money over short or long periods of time. In addition, the net asset value of a fund over short-term periods may be more volatile than other investment options because of a fund’s significant use of financial instruments that have a leveraging effect. Futures instruments may be less liquid than other types of investments. The prices of futures instruments may fluctuate quickly and dramatically and may not correlate to price movements in other asset classes. All opinions expressed constitute judgments as of the date of release, and are subject to change without notice. There can be no assurance forecasts will be achieved. The information is taken from sources that we believe to be reliable but we do not guarantee its accuracy or completeness. …your link with the Global Investment Community 22
  • 23. Market Commentary 2014: Year of the Fundamental Investor January 2014 January 2014 Entering 2014, we expect a good year for global equity and convertible markets overall. The major global economies look positioned to show faster growth, although this positive global synchronization is occurring at varying rates and supported by diverging policies. Historically, the conditions we see today have benefited equities and convertibles, especially cyclical growth opportunities. More importantly, we are encouraged by the emergence of more fundamentally driven markets across asset classes and believe that our active approach is well suited to this environment. I. Market Review The S&P 500 Index rang out 2013 with a total return of 32%, its strongest year since 1997 (Figure 1). The Nasdaq Index soared even higher to a 40% gain for 2013, on the back of an increased appetite for risk assets, including smaller cap and technology names. Developed markets outside the U.S. also advanced briskly, supported by improved conditions in the euro zone and brightening sentiment on Japan. FIGURE 1. U.S. EQUITIES SOAR, WHILE BONDS AND GOLD FALTER In terms of market performance, the emerging markets (EMs) did not enjoy similarly good fortunes, as market participants struggled with the potential deleterious impact of a U.S. taper on countries with weaker currencies and deficits; these anxieties were exacerbated by concerns of slowing growth. Talk of a potential credit bubble and slowing growth in China was a focal point of investor apprehension. As is often the case, good news for U.S. stocks was bad news for much of the bond market, and the 10year Treasury sank 8% for the year. Gold declined nearly 30% as inflation remained contained and equities extended their rally. Authored by: John P. Calamos SR. CEO and Global CO -CIO Calamos Investments Gary D. Black EVP and Global CO-CIO Calamos Investments For the year (Figure 2), consumer discretionary led, as companies continued to reap the benefits of the wealth effect provided by rising equity markets and recovering home prices. Health care and financials rounded out the top performing sectors. For the quarter, cyclical growth sectors performed best, led by industrials and technology. Utilities and telecom posted the most muted gains for the quarter and the year, as investors turned away from more defensive names. II. Global Outlook While improved global economic growth in 2013 was led by the U.S., we are starting to see positive global synchronization among major economies. Europe is coming out of its recession, and Abenomics has promoted economic growth in Japan. China’s growth has decelerated, but it is delivering solid growth nonetheless, as are a number of lesser-discussed EMs. In the wake of the 2008 financial crisis and euro zone turmoil, accommodative policy was good for the global economy. Recovery efforts didn’t take firm hold until the U.S., the European Central Bank (ECB) and China aligned in an accommodative direction. Now, with the worst in the rear-view mirror, countries are following different routes to move forward as they address local issues. FIGURE 2. A STRONG SHOWING FOR CYCLICALS IN THE U.S. EQUITY MARKET …your link with the Global Investment Community 23
  • 24. Market Commentary The U.S. is tapering; elsewhere in the developed markets, monetary policy remains highly accommodative and fiscal policy has become more simulative. The ECB has indicated its willingness to inject more money into the euro zone, and Japan looks set to continue with its unprecedented stimulus measures. China and other emerging markets will likely be in varying levels of tightening as they work to avoid credit bubbles while keeping inflation in check. All in, we expect global growth slightly above 3.0% (Figure 3), with the U.S. and China making strong contributions. As the two largest economies in the world, their economic growth can offset the more modest expansion that we may see in the euro zone and in some EMs. United States. The U.S. economy looks to be in a “not-too-hot, nottoo-cold” period, supported by improving GDP growth and low inflation, upbeat consumers, good corporate balance sheets, strength in manufacturing and an improving trade balance. We expect U.S. GDP growth of 2.5 to 3.0% in 2014, with inflation holding at less than 2%. Against this backdrop, we anticipate that the Fed will withdraw QE stimulus by the end of 2014, while continuing accommodative policy through 2015. FIGURE 3. GLOBAL AND U.S. GDP GROWTH FIGURE 4. U.S. HOME PRICES RISE, HELPED BY LOW INVENTORY Supported by a wealth effect of rising equity markets and home values (Figure 4), the U.S. consumer is feeling better and spending more, including on autos and other discretionary items (Figure 5). Net worth is higher than it was before the financial crisis, and the deleveraging cycle may have well have bottomed out (Figure 6). This willingness to spend and potentially take on debt should sustain economic growth over the long term. The U.S. Labor Department’s report that only 74,000 jobs were added in December fell far short of economists’ expectations (Figure 7), but we expect the number to be revised upward next month. The calendar was compressed with Thanksgiving coming late; the weather was bad; and if one considers November data (revised up to 241,000 jobs) along with December’s data, the average monthly job growth has been respectable at about 160,000. The December numbers are also inconsistent with the other stronger economic data we’ve seen over the past few weeks, including new unemployment claims and ADP’s private sector job growth report. Businesses are also doing well. Capital spending has begun its longanticipated recovery, with total expenditures at record highs. Corporate cash growth and high cash balances suggest that this recovery can be sustained over an extended period. Operating earnings of S&P 500 companies continue to rise. Small businesses are adding jobs and benefiting from increased access to credit. As earnings season starts again, we believe most sectors are likely to do better versus reduced expectations. Retail and restaurants may be an exception; like the employment numbers, these sectors were similarly affected by the compressed calendar and weather. FIGURE 5. U.S. AUTO SALES ON THE RISE FIGURE 6. U.S. CONSUMER NET WORTH CLIMBS AS DEBT BURDENS PLUMMET Past Performance is not a guarantee of future results Information contained herein is for informational purposes only. Opinions, estimates, forecasts, and statements of financial market trends that are based on current market conditions constitute our judgment and are subject to change without notice. We believe the information provided here is reliable. The views and strategies described may not be suitable for all investors. References to specific securities, asset classes and financial markets are for illustrative purposes only and are not intended to be, and should not be interpreted as, recommendations. …your link with the Global Investment Community 24
  • 25. Market Commentary Municipal Bond Market Review & Outlook February 11, 2014 Western Asset’s Fourth Quarter 2013 Recap The municipal (muni) bond market struggled throughout the fourth quarter and in 2013. However, despite heightened market volatility and high-profile credit stresses, there was actually strengthening fundamentals. For example, tax receipts have improved for 15 straight quarters. In addition, spending has remained in check, or in equilibrium, with incoming revenues. Thus far, we're not seeing austerity fatigue settle into budgets. That’s due to several factors. First, the unemployment rate has declined. Second, there has been improvement in the housing market. Third, sales tax, personal income tax and corporate income tax receipts have all risen. That being said, revenue improvements have been uneven across regions. The disparity is especially pronounced between state and local governments. While tax revenues in some regions now exceed their pre-recession levels, this isn't the case in some areas. In addition, while the housing market has rebounded, this has been insufficient in terms of propping up of property tax receipts. This will likely to keep pressure on certain local government bonds, more so than state and higher-quality local government bond markets. While the landscape is uneven, municipal balance sheets are generally much stronger today than where they were just a few years ago. We have a backdrop of improving fundamentals, and muni valuations are very, very cheap. In particular, given oversold conditions and the steep muni yield curve, we see value in longer-term maturities. And we expect the muni yield curve to flatten in 2014. Even with an expectation for higher interest rates in 2014, you can make the case that the oversold conditions in the muni bond market in 2013 left us with a decent cushion to help protect against the potential for negative price returns in the upcoming quarter or quarters. What are some of the things we’re watching that could offset our upbeat tone? We're closely monitoring the Detroit bankruptcy settlement case, underfunded local pension liabilities, and Puerto Rico’s liquidity and its ability to access the capital markets. Again, these high-profile credit stresses, we believe, have overshadowed the broader municipal story, which is fundamental improvement and cheap prices. In terms of supply/demand technicals, crossover buyers have been providing liquidity and offsetting much of the negative cash flows from open-end mutual funds. More importantly, demand from retail investors has improved a bit. It hasn't been significant, but in early 2014 we’ve seen the appetite for municipal bonds improve. And we're starting to see positive cash flows into open-end mutual funds. So, it’s generally good news all around. Fundamentals are improving, valuations are cheap, and technicals are more favorable. Let's turn our attention to the high-profile credit stresses in Puerto Rico. It is facing many challenges, and strengthening the island’s physical condition is a key goal for the current administration. Governor Padilla, who was elected in November 2012, has taken many positive steps by increasing and broadening certain taxes, as well as instituting better tax collection processes. For example, on average, only 50 cents of each dollar of sales tax gets to the state. They’re looking for ways to improve that tax collection process, such that increasing revenue collections might help the imbalance between revenues and expenses. But these positive factors have been largely overshadowed by the weak economy. Puerto Rico is now in an eighth year of a recessionary environment. This is leaving little economic opportunity and causing many people to leave the island, which is shrinking the tax base. So the economy must begin to grow to help the island out of its economic troubles. But Puerto Rico does have an economic development plan, they’ve seen an improvement in revenues and they’re keeping expenses at bay. At least for now, it looks like they'll be able to find liquidity in the financial market, although it will be at a prohibitively high borrowing cost. Turning to Detroit, it is in the midst of an ongoing legal battle. This will continue even after the bankruptcy settlement, as there’ll be an appeals process. We believe the market place has already valued or priced in all the available information from Detroit, Puerto Rico, Chicago and some of the communities in California. Market Outlook We are upbeat about the muni bond market. Our portfolios are positioned with durations that are slightly longer than those of their respective benchmarks. We have been adding to our A-rated securities and, to smaller degrees, BBB-rated and some belowinvestment-grade credits where we're identifying great values. From a sector perspective, we continue to favor revenue bonds versus general obligation debt. Within the revenue bond sector, we look to overweight corporate-backed obligations – commonly referred to as IDRs or industrial development revenue bonds – and health care, utilities and transportation related bonds. The latter includes airport, airline, marine port and mature toll roads with solid pricing power, good liquidity and modest amounts of debt. Looking ahead, we will be tactical in terms of duration, and we continue to look at valuations versus fundamentals. Should prices become stretched relative to the fundamentals, we’ll look for opportunities to move away from some of the things that we’ve included in our portfolios and look for better opportunities. Western Asset manages the following municipal bond closed-end funds: • • • • • Western Asset Municipal High Income Fund Inc. (MHF) Western Asset Managed Municipals Fund Inc. (MMU) Western Asset Municipal Partners Fund Inc. (MNP) Western Asset Municipal Defined Opportunity Trust Inc. (MTT) Western Asset Intermediate Muni Fund Inc. (SBI) For more information about any of our municipal bond closed-end funds, including the long-term performance, risks, expenses and fund objectives, please visit www.lmcef.com. Please view endnotes and important information on the next page. …your link with the Global Investment Community 25
  • 26. Market Commentary Important Information: Glossary All investments are subject to risks, including the possible loss of principal. Investments in bonds are subject to credit risk, inflation risk, and interest rate risk. As interest rates rise, bond prices fall, reducing the value of the Fund's share price. Investments in lower-rated highyield bonds are subject to greater credit risk (risk of default) than higher-rated obligations. Derivatives, such as options and futures, can be illiquid, may disproportionately increase losses, and have a potentially large impact on Fund performance. Certain investors may be subject to the federal Alternative Minimum Tax (AMT), and state and local taxes may apply. Distributions are not guaranteed and are subject to change. Crossover buyers are investors that typically wouldn’t transact in taxexempt muni bonds for various reasons. The Closed-End Funds are not sold or distributed by Legg Mason Investor Services, LLC ("LMIS") or any affiliate of Legg Mason, Inc. Unlike open-end funds, shares are not continually offered. Like other public companies, closed-end funds have a one-time initial public offering, and once their shares are first issued, are generally bought and sold through non-affiliated broker/dealers and trade on nationally recognized stock exchanges. Share prices will fluctuate with market conditions and, at the time of sale, may be worth more or less than your original investment. Shares of exchange-traded closed-end funds may trade at a discount or premium to their original offering price, and often trade at a discount to their net asset value. Net Asset Value (NAV) is total assets less total liabilities divided by the number of shares outstanding. Market Price, determined by supply and demand, is the price at which an investor purchases or sells the fund. Investment return, market price and net asset value will fluctuate with changes in market conditions. The Funds are subject to investment risks, including the possible loss of principal invested. Diversification does not assure a profit or protect against market loss. Any performance discussed is past performance, and past performance is no guarantee of future results. Unless otherwise stated, all yields and returns discussed are those of indexes or asset classes and are not those of the Funds. A credit rating is a measure of an issuer's ability to repay interest and principal in a timely manner. The credit ratings provided by Standard and Poor's, Moody's Investors Service and/or Fitch Ratings, Ltd. typically range from AAA (highest) to D (lowest), or an equivalent and/or similar rating. Please see www.standardandpoors.com, www.moodys.com, or www.fitchratings.com for details. Please note that the Funds themselves have not been rated by an independent rating agency. Duration is a measurement that signals how much the price of a bond is likely to fluctuate when there is a change in interest rates. The higher the duration number, the more sensitive a bond will be to interest rate changes. General obligation (G.O.) bonds are issued by a municipality and are backed by the general ability of the municipality to raise revenue. No specific tax or project revenues are identified as the source of future payments and no assets are used as collateral. A revenue bond is a type of municipal bond distinguished by its guarantee of repayment solely from revenues generated by a specified revenue-generating entity, rather than from a tax. A yield curve shows the relationship between yields and maturity dates for a similar class of bonds. The views expressed are those of the portfolio managers as of January 30, 2014 and are subject to change based on market and other conditions. These views may differ from other portfolio managers or the firm as a whole, and are not intended to be a forecast of future events, a guarantee of future results, or investment advice. Discussions of individual securities are intended to inform shareholders as to the basis (in whole or in part) for previously made decisions by a portfolio manager to buy, sell or hold a security in a portfolio. References to specific securities are not intended and should not be relied upon as the basis for anyone to buy, sell or hold any security. Forecasts are inherently limited and should not be relied upon as an indication of actual or future performance. Legg Mason is not affiliated with Capital Link. © 2014 Legg Mason Investor Services, LLC. Member FINRA, SIPC. Legg Mason Investor Services, LLC and Western Asset Management are subsidiaries of Legg Mason, Inc. INVESTMENT PRODUCTS: NOT FDIC INSURED | NO BANK VALUE | MAY LOSE VALUE FN1410465 Legg Mason, Inc., its affiliates, and its employees are not in the business of providing tax or legal advice. These materials and any taxrelated statements are not intended or written to be used, and cannot be used or relied upon, by any such taxpayer for the purpose of avoiding tax penalties. Tax-related statements, if any, may have been written in connection with the “promotion or marketing” of the transaction(s) or matter(s) addressed by these materials, to the extent allowed by applicable law. Any such taxpayer should seek advice based on the taxpayer's particular circumstances from an independent tax advisor. …your link with the Global Investment Community 26
  • 27. Investment Commentary Potential inclusion of China A-shares in major global benchmarks Chinese equities are underrepresented in major global benchmarks such as those operated by FTSE and MSCI. This article, an excerpt from a Deutsche Bank research report called “Synthesizing Equity in 2014,” explains. The size of China’s economy and equity market demands a larger index weight Chinese equities are underrepresented in major global benchmarks such as the FTSE and MSCI indices. The FTSE All World Index assigns a weight of 2% to China, while the MSCI All Country (AC) World Index allocation is only marginally higher at 2.2%. In the FSCI Emerging Markets Index, even though China is the largest component, with close to a 20% weighting, the allocations are still arguably on the lower side if viewed from the perspective of stock-market capitalization. Our analysis suggests that China should be more than 30% by weight in the MSCI Emerging Markets Index. Obstacles for China A-shares to be included in global benchmarks Some major obstacles still exist in terms of market accessibility, preventing fund managers from replicating or benchmarking to a global index that includes China A-shares. There are a number of restrictions in place for a foreign investor seeking exposure to Chinese equities, such as the low quota for each Qualified Foreign Institutional Investor (QFII), restrictions on capital remittance and repatriation and uncertainty regarding capital-gains tax. Acceleration in opening up China’s capital market Recently, the Chinese government has made significant progress opening up China’s capital markets. In 2013, we witnessed dramatic acceleration in this continued process. In January, the former chairman of the China Securities Regulatory Commission (CSRC) indicated that the Renminbi Qualified Foreign Institutional Investor (RQFII) and QFII quotas could be increased to 10 times the current level. In July, Chinese regulators almost doubled the QFII quota (from $80 billion to $150 billion). In September, the Hong Kong Monetary Authority (HKMA) became the first QFII to be awarded more than $1 billion in investment quota from China. Following that, Chinese regulators raised the QFII quota to more than $1 billion for both Norges Bank and Temasek. In November, China’s central bank chief, Zhou Xiaochuan, stated the intention to further expand quotas for QFII and Qualified Domestic Institutional Investor (QDII) schemes, and ultimately remove the quota system altogether when conditions ripen. February 2014 Authored by: Shan Lan Head off Index Change Research Deutsche Bank Timeline of the potential inclusion There have been many discussions on when index providers will include China A-shares into their global benchmarks. The actual timing depends on the progress of the China capital account liberalization to a large extent. Major index providers may wait until the Chinese equity market fully meets these criteria before they include it into their global benchmark. Alternatively, index providers can gradually add China A-shares starting with a portion of the full weight, similar to the addition of Korea and Taiwan in the MSCI Emerging Markets Index. MSCI added Korea at 20% of its weight in 1992, and took six years to include the full weight of Korea. Similarly, it took nine years from the initial inclusion of Taiwan in the MSCI Emerging Markets Index to its full inclusion. In June 2013, MSCI announced that it had added China A-shares to the review list for potential inclusion to its most tracked benchmarks, such as the MSCI Emerging Markets Index and MSCI AC World Index. The MSCI annual country classification review in June 2014 is the earliest time for MSCI to announce China A-shares inclusion in the MSCI Emerging Markets Index. Assuming the previous decision is taken, June 2015 would be the earliest MSCI would implement China Ashares inclusion in the MSCI Emerging Markets Index. FTSE will announce its annual country classification review decision in September 2014, and China Ashares are on watch list for possible inclusion in its global index series. Assuming FTSE decides to make the change, it may implement China A-shares inclusion in its FTSE All World Index series in March or September of 2015. 27