NO1 Certified Black Magic Removal in Uk kala jadu Specialist kala jadu for Lo...
Blue Star
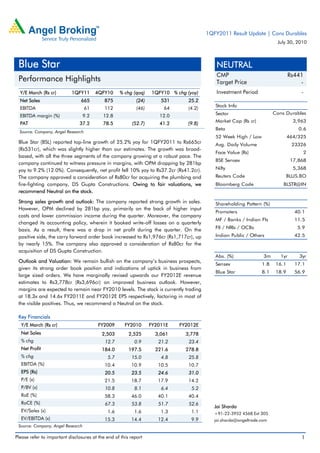
1. 1QFY2011 Result Update | Cons Durables
July 30, 2010
Blue Star NEUTRAL
CMP Rs441
Performance Highlights Target Price -
Y/E March (Rs cr) 1QFY11 4QFY10 % chg (qoq) 1QFY10 % chg (yoy) Investment Period -
Net Sales 665 875 (24) 531 25.2
Stock Info
EBITDA 61 112 (46) 64 (4.2)
Sector Cons Durables
EBITDA margin (%) 9.2 12.8 12.0
Market Cap (Rs cr) 3,963
PAT 37.2 78.5 (52.7) 41.2 (9.8)
Beta 0.6
Source: Company, Angel Research
52 Week High / Low 464/325
Blue Star (BSL) reported top-line growth of 25.2% yoy for 1QFY2011 to Rs665cr Avg. Daily Volume 23326
(Rs531cr), which was slightly higher than our estimates. The growth was broad-
Face Value (Rs) 2
based, with all the three segments of the company growing at a robust pace. The
BSE Sensex 17,868
company continued to witness pressure in margins, with OPM dropping by 281bp
yoy to 9.2% (12.0%). Consequently, net profit fell 10% yoy to Rs37.2cr (Rs41.2cr). Nifty 5,368
The company approved a consideration of Rs80cr for acquiring the plumbing and Reuters Code BLUS.BO
fire-fighting company, DS Gupta Constructions. Owing to fair valuations, we Bloomberg Code BLSTR@IN
recommend Neutral on the stock.
Strong sales growth and outlook: The company reported strong growth in sales. Shareholding Pattern (%)
However, OPM declined by 281bp yoy, primarily on the back of higher input
Promoters 40.1
costs and lower commission income during the quarter. Moreover, the company
MF / Banks / Indian Fls 11.5
changed its accounting policy, wherein it booked write-off losses on a quarterly
basis. As a result, there was a drop in net profit during the quarter. On the FII / NRIs / OCBs 5.9
positive side, the carry forward order book increased to Rs1,976cr (Rs1,717cr), up Indian Public / Others 42.5
by nearly 15%. The company also approved a consideration of Rs80cr for the
acquisition of DS Gupta Construction.
Abs. (%) 3m 1yr 3yr
Outlook and Valuation: We remain bullish on the company’s business prospects,
Sensex 1.8 16.1 17.1
given its strong order book position and indications of uptick in business from
Blue Star 8.1 18.9 56.9
large sized orders. We have marginally revised upwards our FY2012E revenue
estimates to Rs3,778cr (Rs3,696cr) on improved business outlook. However,
margins are expected to remain near FY2010 levels. The stock is currently trading
at 18.3x and 14.6x FY2011E and FY2012E EPS respectively, factoring in most of
the visible positives. Thus, we recommend a Neutral on the stock.
Key Financials
Y/E March (Rs cr) FY2009 FY2010 FY2011E FY2012E
Net Sales 2,503 2,525 3,061 3,778
% chg 12.7 0.9 21.2 23.4
Net Profit 184.0 197.5 221.6 278.8
% chg 5.7 15.0 4.8 25.8
EBITDA (%) 10.4 10.9 10.5 10.7
EPS (Rs) 20.5 23.5 24.6 31.0
P/E (x) 21.5 18.7 17.9 14.2
P/BV (x) 10.8 8.1 6.4 5.2
RoE (%) 58.3 46.0 40.1 40.4
RoCE (%) 67.3 53.8 51.7 52.6
Jai Sharda
EV/Sales (x) 1.6 1.6 1.3 1.1 +91-22-3952 4568 Ext 305
EV/EBITDA (x) 15.3 14.4 12.4 9.9 jai.sharda@angeltrade.com
Source: Company, Angel Research
Please refer to important disclosures at the end of this report 1
2. Blue Star | 1QFY2011 Result Update
Exhibit 1: 1QFY2011 Performance
Y/E March (Rs cr) 1QFY11 4QFY10 % chg (qoq) 1QFY10 % chg (yoy) FY2010 FY2009 % chg
Net Sales 664.8 874.7 (24.0) 531.0 25.2 2,549.4 2,519.4 1.2
Consumption of RM 504.3 644.2 (21.7) 380.0 32.7 1,882.1 1,874.3 0.4
(% of Sales) 75.9 73.6 71.6 73.8 74.4
Staff Costs 47.3 48.1 (1.6) 46.4 1.9 184.9 182.3 1.4
(% of Sales) 7.1 5.5 8.7 7.3 7.2
Other Expenses 52.3 70.5 (25.8) 41.1 27.4 183.3 186.5 (1.7)
(% of Sales) 7.9 8.1 7.7 7.2 7.4
Total Expenditure 604.0 762.8 (20.8) 467.5 29.2 2,250.3 2,243.0 0.3
Operating Profit 60.9 112.0 (45.6) 63.5 (4.2) 299.2 276.4 8.2
OPM (%) 9.2 12.8 12.0 11.7 11.0
Interest 2.0 2.5 (20.0) 1.5 37.9 8.5 17.3 (51.0)
Depreciation 7.6 9.1 (17.2) 8.2 (7.8) 34.7 25.9 34.2
Other Income 0.4 2.7 (85.7) 0.4 (7.3) 6.7 4.9 35.2
PBT (excl. Extr. Items) 51.7 103.0 (49.8) 54.3 (4.8) 262.7 238.2 10.3
Extr. Income/(Expense) 0.4 - - 14.0 -
PBT (incl. Extr. Items) 52.1 103.0 (49.4) 54.3 (4.0) 276.6 238.2 16.1
(% of Sales) 7.8 11.8 10.2 10.9 9.5
Provision for Taxation 15.0 24.5 (38.7) 13.1 14.2 65.1 57.9 12.4
(% of PBT) 28.7 23.8 24.2 23.5 24.3
Reported PAT 37.2 78.5 (52.7) 41.2 (9.7) 211.5 180.3 17.3
PATM (%) 5.6 9.0 7.8 8.3 7.2
Equity shares (cr) 9.0 9.0 9.0 9.0 9.0
EPS (Rs) 4.1 8.7 (52.7) 4.6 (9.7) 23.5 20.0 17.3
Adjusted PAT 36.7 78.5 (53.2) 41.2 (10.8) 197.5 180.3 9.6
Source: Company, Angel Research
Segment-wise performance: The electro mechanical projects and packaged air-
conditioning systems (EMPPACS) division registered a strong 18.9% yoy increase in
sales for the quarter to Rs374cr (Rs314cr). EBIT of the division stood at Rs34cr,
implying an EBIT margin of 9.1%.
Sales of the cooling products (CP) division stood at Rs253cr (Rs190cr) for
1QFY2011, an increase of 33.1% yoy. EBIT of the division came in at Rs35cr,
while EBIT margin stood at 13.9% for 1QFY2011.
The professional electronics and industrial systems (PEIS) division posted a growth
of 30.9% yoy to Rs32cr (Rs25cr). EBIT of the division came in at Rs5.5cr, while EBIT
margin stood at 16.9% for 1QFY2011.
July 30, 2010 2
3. Blue Star | 1QFY2011 Result Update
Exhibit 2: Segment-wise performance
% chg % chg
Y/E March (Rs cr) 1QFY2010 4QFY2010 1QFY2011
(qoq) (yoy)
Total Revenue
A) EMPPACS 314.7 613.0 374.2 (39.0) 18.9
B) Cooling Products 190.3 186.9 253.4 35.5 33.1
C) PEIS 24.7 54.7 32.3 (40.9) 30.9
Total 529.7 854.6 659.8 (22.8) 24.6
Less: Inter-Seg. Revenue - - -
Net Sales 529.7 854.6 659.8 (22.8) 24.6
EBIT
A) EMPPACS 34.6 79.0 34.0 (56.9) (1.5)
B) Cooling Products 33.2 28.7 35.2 22.7 6.1
C) PEIS 7.1 19.8 5.5 (72.5) (22.8)
EBIT Margin (%)
A) EMPPACS 11.0 12.9 9.1 (379bp) (188bp)
B) Cooling Products 17.5 15.4 13.9 (146bp) (3545bp)
C) PEIS 28.6 36.2 16.9 (1937bp) (1172bp)
Source: Company, Angel Research
Healthy order book indicates bright revenue prospects: In 1QFY2011, the
company’s sales growth was robust across all the three segments. Growth visibility
high on the back of the healthy order book of Rs1,976cr (Rs1,717cr). Besides, the
company’s acquisition of DS Gupta Construction will give additional fillip to sales.
Exhibit 3: Sales Trend
1000 30.0
875
900 25.0
800 714 20.0
647 665
700 596 15.0
567 540 564
600 10.0
(Rs cr)
(%)
500 5.0
400 0.0
300 -5.0
200 -10.0
100 -15.0
0 -20.0
2QFY09
3QFY09
4QFY09
1QFY10
2QFY10
3QFY10
4QFY10
1QFY11
Sales (LHS) yoy Growth (RHS)
Source: Company, Angel Research
Weak profit margins during 1QFY2011 to improve: The company witnessed a
decline of 281bp yoy in OPM during 1QFY2011. However, we expect full year
margins to remain at FY2010 levels, as input prices stabilise. In FY2012E, we
expect the company to clock OPM of 10.7%.
July 30, 2010 3
4. Blue Star | 1QFY2011 Result Update
Exhibit 4: OPM Trend
120.0 16
14
100.0
12
80.0
10
(Rs cr)
(%)
60.0 8
6
40.0
4
20.0
2
- 0
2QFY09
3QFY09
4QFY09
1QFY10
2QFY10
3QFY10
4QFY10
1QFY11
EBITDA (LHS) OPM (RHS)
Source: Company, Angel Research
As a result of the decline in OPM and change in accounting policies, PAT during
the quarter fell by 10% to Rs37cr.
Exhibit 5: Profit Trend
90
80
70
60
50
(Rs cr)
40
30
20
10
0
2QFY09
3QFY09
4QFY09
1QFY10
2QFY10
3QFY10
4QFY10
Source: Company, Angel Research 1QFY11
July 30, 2010 4
5. Blue Star | 1QFY2011 Result Update
Management Call - Key Takeaways
The company has approved a consideration of Rs80cr to acquire, the
plumbing and fire-fighting major, DS Gupta Construction. The company will
leverage this acquisition to cross sell its services to DS Gupta’s customers.
Funding for the acquisition will to be done through internal accruals and debt.
EMPPACS division is expected to record higher billing in the coming quarters,
as transformation of the order book is now complete and incremental orders
are expected to translate into sales.
The company is witnessing an uptick in demand in the ducted systems space
after 18 months of de-growth. This is generally a pre-cursor to the
improvement in business in the large order space. This augurs well for the
company.
There is a lot of activity in the small commercial sector. The real estate and
retail segments are also showing signs of revival. However, there is still not
much activity seen in the office space and IT segment.
Pricing pressure is expected to ease after new order inflows start coming
through, which the company expects to start happening in 4-6 months.
Cooling products division growth was driven by the healthy 34% growth in the
refrigeration and air-conditioning segment.
July 30, 2010 5
6. Blue Star | 1QFY2011 Result Update
Investment Arguments
Substantial demand for centralised air-conditioning, cold storage to drive future
growth: The surge in demand for commercial space and increasing corporate and
government thrust for setting up an efficient cold chain infrastructure in the country
is set to trigger demand for centralised air-conditioning and cold storage system in
India. BSL's cold storage division too has high growth potential with the aggregate
cost of providing a nation-wide cold chain infrastructure estimated to cost more
than Rs15,000cr.
To maintain leadership position owing to superior execution skills: BSL's strength
lies in its superior execution skills compared to competition. The company, with
30% market share in the central air-conditioning system segment, is a preferred
vendor with the institutional clients. The company's list of national account
customers provides repetitive business.
Present in high-margin segments: BSL is a diversified player in the air-conditioning
industry and is focused on high-margin segments including commercial
refrigeration, cold storage and central air-conditioning. The company has
improved its margins following an increase in the average ticket size of orders. The
easing of pricing pressures is also expected to improve the company's margins
going ahead.
Outlook and Valuation
We maintain our positive view on the company, given the strong growth indicators
across all the three segments and a healthy order book of Rs1,976cr. The
acquisition of DS Gupta Construction will complement the company’s service
bouquet, which would now have a strong presence in the plumbing and fire
fighting space. The company will also be able to cross sell its existing services to
DS Gupta’s customers. The transformation of the order book implies that the order
book growth will start translating into higher sales for the company. The uptick in
the ducted systems segment augurs well for the business outlook, as it generally
precedes the inflow of large sized orders. Overall, we expect the company to post
CAGR of 22.3% in sales over FY2010-12E. Once complete recovery happens,
OPM of the company would also improve and remain at FY2010 levels. Thus, we
expect OPM to come in at 10.5% in FY2011E and at 10.7% in FY2012E.
Exhibit 6: Revised Estimates
Rs cr Old New % chg
FY2011E FY2012E FY2011E FY2012E FY2011E FY2012E
Sales 2,994 3,696 3,061 3,778 2.2 2.2
EBITDA 314 395 321 404 2.2 2.2
EBITDA % 10.5 10.7 10.5 10.7
PAT 217 273 222 279 2.4 2.1
EPS 24.1 30.3 24.6 31.0 2.4 2.1
Source: Company, Angel Research
July 30, 2010 6
7. Blue Star | 1QFY2011 Result Update
Currently, the stock is trading at 17.9x and 14.2x FY2011E and FY2012E EPS
respectively, factoring in most of the growth prospects. We have valued DS Gupta
Construction’s business at 1x the consideration approved by BSL and added it to
the Target Price. However, the stock is trading at levels very close to our Target
Price. Hence, we recommend a Neutral on the stock.
Exhibit 7: Key Assumptions
FY2011E FY2012E Remarks
EMPPACS Contribution to Sales 70.6 71.5 High growth expected on account of demand revival
Cooling Prod Contribution to Sales 23.3 22.7 Strong growth momentum to continue
PEIS Contribution to Sales 5.4 5.3
OPM (%) 10.5 10.7 OPM to improve following decline in raw material prices
Tax Rate (%) 27.2 27.2 Higher compared to FY2010 as tax benefits on one plant end
Source: Angel Research
Exhibit 8: Peer Valuations
Company Mcap CMP P/E (x) P/BV (x) EV/EBITDA (x) RoE (%)
(Rs cr) (Rs) FY11E FY12E FY11E FY12E FY11E FY12E FY11E FY12E
Blue Star 3,970 441 17.9 14.2 6.4 5.2 12.4 9.9 40.1 40.4
Voltas 7,033 213 19.4 15.9 5.5 4.3 13.1 10.8 31.1 29.1
Source: Company, Bloomberg, Angel Research
Exhibit 9: One-year forward P/E band
600
500
Share Price (Rs)
400
300
200
100
0
Apr-04 Apr-05 Apr-06 Apr-07 Apr-08 Apr-09 Apr-10
Price 8x 11x 14x 17x 20x
Source: Company, Bloomberg, Angel Research
July 30, 2010 7
8. Blue Star | 1QFY2011 Result Update
Profit and Loss
Y/E March (Rs cr) FY07 FY08 FY09 FY10 FY11E FY12E
Gross sales 1,595 2,222 2,552 2,558 3,061 3,778
Less: Excise duty - - 49.7 32.6 - -
Net Sales 1,595 2,222 2,503 2,525 3,061 3,778
Other operating income - - - - - -
Total operating income 1,595 2,222 2,503 2,525 3,061 3,778
% chg - 39.3 12.7 0.9 21.2 23.4
Total Expenditure 1,484 1,999 2,243 2,250 2,740 3,374
Net Raw Materials 1,243 1,691 1,874 1,882 2,308 2,852
Other Mfg costs 49 68 50 50 95 118
Personnel 117 145 182 185 214 253
Other 75 95 136 133 122 151
EBITDA 110 223 260 275 321 404
% chg - 102.4 16.4 5.8 16.8 25.8
(% of Net Sales) 6.9 10.0 10.4 10.9 10.5 10.7
Depreciation& Amortisation 21 22 26 35 30 36
EBIT 89 201 234 240 290 368
% chg - 125.2 16.3 2.7 21.0 26.7
(% of Net Sales) 5.6 9.0 9.3 9.5 9.5 9.7
Interest & other Charges 10 8 14 8 2 1
Other Income 13 49 22 31 16 16
(% of PBT) 13.9 20.0 9.0 11.9 5.3 4.2
Recurring PBT 93 242 242 263 304 383
% chg - 161.5 (0.0) 8.6 15.9 25.8
Extraordinary Expense/(Inc.) 1 25 - - - -
PBT (reported) 92 217 242 263 304 383
Tax 21 68 58 65 83 104
(% of PBT) 23.3 31.3 23.9 24.8 27.2 27.2
PAT (reported) 70 149 184 198 222 279
Add: Share of earnings of
- - - - - -
associate
Less: Minority interest (MI) - - - - - -
Prior period items - - - - - -
PAT after MI (reported) 70 149 184 198 222 279
ADJ. PAT 70 149 184 198 222 279
% chg - 111.7 23.5 7.4 12.2 25.8
(% of Net Sales) 4.4 6.7 7.4 7.8 7.2 7.4
Basic EPS (Rs) 7.9 19.4 20.5 23.5 24.6 31.0
Fully Diluted EPS (Rs) 7.9 19.4 20.5 23.5 24.6 31.0
% chg - 144.6 5.7 15.0 4.8 25.8
July 30, 2010 8
9. Blue Star | 1QFY2011 Result Update
Balance Sheet
Y/E March (Rs cr) FY07 FY08 FY09 FY10 FY11E FY12E
SOURCES OF FUNDS
Equity Share Capital 18 18 18 18 18 18
Preference Capital - - - - - -
Reserves& Surplus 195 246 349 474 597 749
Shareholders Funds 213 264 367 492 615 767
Minority Interest
Total Loans 89 37 24 9 9 9
Deferred Tax Liability (Net) 7 4 1 (1) - -
Total Liabilities 309 304 391 499 623 776
APPLICATION OF FUNDS
Gross Block 231 273 333 351 381 444
Less: Acc. Depreciation 117 135 145 180 210 246
Net Block 114 138 188 171 170 199
Capital Work-in-Progress 2 18 25 28 27 27
Goodwill - - - - - -
Investments 5 5 4 4 4 4
Current Assets 733 1,034 1,149 1,393 1,629 1,973
Cash 5 3 6 13 28 27
Loans & Advances 169 257 293 132 337 378
Inventories 209 290 207 258 322 406
Debtors 351 484 643 628 942 1,162
Other - - - 361 - -
Current liabilities 548 892 975 1,097 1,207 1,427
Net Current Assets 184 142 174 296 422 546
Mis. Exp. not written off 2 1 1 - - -
Total Assets 309 304 391 499 623 776
July 30, 2010 9
10. Blue Star | 1QFY2011 Result Update
Cash Flow Statement
Y/E March (Rs cr) FY07 FY08 FY09 FY10 FY11E FY12E
Profit before tax 93 223 254 362 353 410
Depreciation 21 22 26 35 30 36
(Inc.)/ Dec. in Working Capital 37 129 6 (274) 93 (84)
Less: Other income 13 49 22 31 16 16
Direct taxes paid 21 68 58 65 83 104
Cash Flow from Operations 117 258 206 26 378 241
(Inc.)/ Dec. in Fixed Assets (24) (21) (165) (128) (157) (191)
(Inc.)/ Dec. in Investments (0) 1 0 0 - -
(Inc.)/ Dec. in loans and advances (78) (88) (35) 160 (204) (41)
Other income 13 49 22 31 16 16
Cash Flow from Investing (90) (60) (178) 64 (345) (216)
Issue of Equity - - - - - -
Inc./(Dec.) in loans 13 (53) (13) (15) - -
Dividend Paid (Incl. Tax) 31 74 74 84 105 126
Others (8.9) (73.5) 61.5 17.0 87.83 100.14
Cash Flow from Financing (27) (200) (25) (82) (17) (26)
Inc./(Dec.) in Cash - (2) 3 8 15 (1)
Opening Cash balances 5 5 3 6 13 28
Closing Cash balances 5 3 6 13 28 27
July 30, 2010 10
12. Blue Star | 1QFY2011 Result Update
Research Team Tel: 022 - 4040 3800 E-mail: research@angeltrade.com Website: www.angeltrade.com
DISCLAIMER
This document is solely for the personal information of the recipient, and must not be singularly used as the basis of any investment
decision. Nothing in this document should be construed as investment or financial advice. Each recipient of this document should make
such investigations as they deem necessary to arrive at an independent evaluation of an investment in the securities of the companies
referred to in this document (including the merits and risks involved), and should consult their own advisors to determine the merits and
risks of such an investment.
Angel Broking Limited, its affiliates, directors, its proprietary trading and investment businesses may, from time to time, make
investment decisions that are inconsistent with or contradictory to the recommendations expressed herein. The views contained in this
document are those of the analyst, and the company may or may not subscribe to all the views expressed within.
Reports based on technical and derivative analysis center on studying charts of a stock's price movement, outstanding positions and
trading volume, as opposed to focusing on a company's fundamentals and, as such, may not match with a report on a company's
fundamentals.
The information in this document has been printed on the basis of publicly available information, internal data and other reliable
sources believed to be true, but we do not represent that it is accurate or complete and it should not be relied on as such, as this
document is for general guidance only. Angel Broking Limited or any of its affiliates/ group companies shall not be in any way
responsible for any loss or damage that may arise to any person from any inadvertent error in the information contained in this report.
Angel Broking Limited has not independently verified all the information contained within this document. Accordingly, we cannot testify,
nor make any representation or warranty, express or implied, to the accuracy, contents or data contained within this document. While
Angel Broking Limited endeavours to update on a reasonable basis the information discussed in this material, there may be regulatory,
compliance, or other reasons that prevent us from doing so.
This document is being supplied to you solely for your information, and its contents, information or data may not be reproduced,
redistributed or passed on, directly or indirectly.
Angel Broking Limited and its affiliates may seek to provide or have engaged in providing corporate finance, investment banking or
other advisory services in a merger or specific transaction to the companies referred to in this report, as on the date of this report or in
the past.
Neither Angel Broking Limited, nor its directors, employees or affiliates shall be liable for any loss or damage that may arise from or in
connection with the use of this information.
Note: Please refer to the important `Stock Holding Disclosure' report on the Angel website (Research Section). Also, please
refer to the latest update on respective stocks for the disclosure status in respect of those stocks. Angel Broking Limited and
its affiliates may have investment positions in the stocks recommended in this report.
Disclosure of Interest Statement Blue Star
1. Analyst ownership of the stock No
2. Angel and its Group companies ownership of the stock No
3. Angel and its Group companies' Directors ownership of the stock No
4. Broking relationship with company covered No
Note: We have not considered any Exposure below Rs 1 lakh for Angel, its Group companies and Directors.
Ratings (Returns) : Buy (> 15%) Accumulate (5% to 15%) Neutral (-5 to 5%)
Reduce (-5% to 15%) Sell (< -15%)
July 30, 2010 12