Es4011724
•
0 gefällt mir•587 views

An Evaluation of Water Quality in Private Drinking Water Wells Near Natural Gas Extraction Sites in the Barnett Shale Formation

Empfohlen
Empfohlen
Weitere ähnliche Inhalte
Was ist angesagt?
Was ist angesagt? (19)
Andere mochten auch
Andere mochten auch (13)
Ähnlich wie Es4011724
Ähnlich wie Es4011724 (20)
Mehr von Andrés Rodríguez Seijo
Mehr von Andrés Rodríguez Seijo (7)
Kürzlich hochgeladen
Kürzlich hochgeladen (20)
Es4011724
- 1. An Evaluation of Water Quality in Private Drinking Water Wells Near Natural Gas Extraction Sites in the Barnett Shale Formation Brian E. Fontenot,†,⊥,∥ Laura R. Hunt,†,⊥,∥ Zacariah L. Hildenbrand,†,⊥ Doug D. Carlton Jr.,†,⊥ Hyppolite Oka,† Jayme L. Walton,† Dan Hopkins,‡ Alexandra Osorio,§ Bryan Bjorndal,§ Qinhong H. Hu,† and Kevin A. Schug*,† † Department of Biology, Department of Chemistry and Biochemistry, and Department of Earth and Environmental Sciences, The University of Texas at Arlington, Arlington, Texas 76019, United States ‡ Geotech Environmental Equipment Inc., Carrollton, Texas 75006, United States § Assure Controls Inc., Vista, California 92081, United States *S Supporting Information ABSTRACT: Natural gas has become a leading source of alternative energy with the advent of techniques to economically extract gas reserves from deep shale formations. Here, we present an assessment of private well water quality in aquifers overlying the Barnett Shale formation of North Texas. We evaluated samples from 100 private drinking water wells using analytical chemistry techniques. Analyses revealed that arsenic, selenium, strontium and total dissolved solids (TDS) exceeded the Environmental Protection Agency’s Drinking Water Maximum Contaminant Limit (MCL) in some samples from private water wells located within 3 km of active natural gas wells. Lower levels of arsenic, selenium, strontium, and barium were detected at reference sites outside the Barnett Shale region as well as sites within the Barnett Shale region located more than 3 km from active natural gas wells. Methanol and ethanol were also detected in 29% of samples. Samples exceeding MCL levels were randomly distributed within areas of active natural gas extraction, and the spatial patterns in our data suggest that elevated constituent levels could be due to a variety of factors including mobilization of natural constituents, hydrogeochemical changes from lowering of the water table, or industrial accidents such as faulty gas well casings. 1. INTRODUCTION Recent advances in technology have facilitated a rapid and widespread expansion of natural gas production from hydro- carbon-rich deep shale formations.1−3 The increase in drilling activity has raised concern over the potential for environmental contamination.2,4−6 Contamination of groundwater aquifers overlying shale formations is particularly problematic because they provide drinking water in rural areas where private wells are unregulated. A study of the Marcellus Shale formation in the northeastern United States reported increased concen- trations of methane5 in private drinking water wells near natural gas extraction sites. While this study does suggest that natural gas extraction could cause systematic groundwater contami- nation, most confirmed cases of contamination are the result of mechanical failures in which methane, drilling fluids, or waste products leak through faulty gas well casings.3,7 Despite a number of recent investigations, the impact of natural gas extraction on groundwater quality remains poorly understood. In a review of scientific literature on natural gas extraction, Vidic et al.8 point out that there is very little information on groundwater quality prior to natural gas extraction activities. In the past 10 years, the 48 000 km2 Barnett Shale formation in Texas has become one of the most heavily drilled shale formations in the United States with approximately 16 743 active wells as of May 2013 (http://www.rrc.state.tx.us/data/ index.php). The Barnett Shale formation, located 1500−2400 m below the surface of approximately 17 counties in North Texas, is composed of compressed sedimentary rocks that form a shale layer. The shale traps natural gas in interstitial pores, and modern techniques, such as hydraulic fracturing, have allowed access to these gas reserves. Natural gas extraction in the Barnett Shale formation should have little effect on the overlying Trinity and Woodbine aquifers as they are separated from the shale formation by over a thousand meters of impermeable rock. The United States Geological Survey (USGS) sampled arsenic9 as well as pesticides, nitrates, and volatile organic compounds (VOCs) in drinking water wells, including wells from aquifers overlying the Barnett Shale formation.10 Using these data and other data from the Texas Water Development Board,11 Reedy et al.12 characterized groundwater in the Trinity and Woodbine aquifers as generally good quality with very few exceedances for constituents such as arsenic, selenium, strontium, and barium. Slightly elevated Received: March 19, 2013 Revised: June 17, 2013 Accepted: July 25, 2013 Article pubs.acs.org/est © XXXX American Chemical Society A dx.doi.org/10.1021/es4011724 | Environ. Sci. Technol. XXXX, XXX, XXX−XXX
- 2. levels of total dissolved solids (TDS) in these aquifers could be attributed to evaporite and gypsum beds and potentially to legacy oil and gas activities. Here, we evaluate water quality in 100 private drinking water wells from the Trinity and Woodbine aquifers overlying the Barnett Shale formation and the Nacatoch aquifer east of the Barnett Shale formation (Figure 1). Samples were collected from areas within the Barnett Shale region both with and without active natural gas extraction, and from areas outside the Barnett Shale region unaffected by natural gas extraction. Analytical tests were conducted to detect volatile and semivolatile compounds identified as contaminants of concern in a congressional report on hydraulic fracturing fluid components,13 and to detect arsenic, barium, selenium, and strontium. These constituents are often included on lists of natural gas extraction waste components.7,13,14 These data were compared to a historical data set from the same aquifers prior to the expansion of natural gas extraction activities.11 This study provides information about the potential impact of natural gas extraction activities on groundwater quality in aquifers overlying the Barnett Shale formation by (1) determining if constituents thought to be associated with natural gas extraction techniques are present in private well water samples; (2) evaluating the relationship between water quality and geographic proximity to natural gas extraction activities; and (3) discussing scenarios to explain elevated constituent concentrations. 2. MATERIALS AND METHODS 2.1. Sampling. A total of 95 water samples were collected from private drinking water wells that draw from the Trinity and Woodbine aquifers. Five reference wells were sampled from the Nacatoch aquifer (Figure 1). We sampled from areas of active natural gas extraction within the Barnett Shale (private wells with one or more gas wells located within a 5 km radius; n = 91), nonactive natural gas extraction areas within the Barnett Shale (private wells with no gas wells located within a 14 km radius; n = 4), and reference sites outside of the Barnett Shale (private wells with no gas wells located within a 60 km radius; n = 5). Private well samples were obtained from a pool of volunteers who responded to a press release calling for study volunteers from 13 counties located in or near the Barnett Shale region (Bosque, Denton, Hamilton, Hood, Hunt, Jack, Johnson, Kaufman, Palo Pinto, Parker, Somervell, Tarrant, and Wise counties; Figure 1). Reference samples from the Nacatoch aquifer were obtained by traveling door-to-door to find volunteers willing to participate, since well owners from this region are not impacted by natural gas extraction and did not respond to our call for volunteers. Sampled water wells drew from the Trinity aquifer (n = 76), the Woodbine aquifer (n = 15), the Nacatoch aquifer (n = 5), and the Palo Pinto and Mineral Wells formations (n = 4) at depths ranging from 9 to 427 m with an average of 105 m. Water wells were overwhelmingly used for drinking water in rural areas without public drinking water systems (n = 82). The remaining wells were used to irrigate private lawns or provide drinking water for livestock (n = 18). To avoid contamination from pesticides, we did not sample water wells that were used for irrigating large agricultural crops. Water wells were purged for a minimum of 20 min, until measurements of pH, dissolved oxygen (DO), and temperature stabilized, indicating fresh well water was flowing. All samples were collected as close to the outdoor wellhead as possible, bypassing filters or treatment systems. To ensure samples were representative of shallow groundwater quality, wells that could not be purged, could only be accessed through taps, or that could not be sampled before treatment or filtration were excluded. Water quality data collected on site included DO, pH, specific conductance, conductivity, temperature, salinity, TDS, Figure 1. Location of private water well samples and natural gas wells in the Barnett Shale Formation of Texas. Private water wells are classified as coming from areas of active natural gas extraction if there are one or more natural gas wells located within a 5 km radius from the water well. Environmental Science & Technology Article dx.doi.org/10.1021/es4011724 | Environ. Sci. Technol. XXXX, XXX, XXX−XXXB
- 3. turbidity, and oxidation−reduction potential (ORP). Four duplicate water samples were collected in 40 mL glass vials without headspace and held at 4 °C during transport to The University of Texas at Arlington for chemical analyses. Because the objective of this study was to assess potential exposure risks of drinking water from wells in this region, we chose not to use filtration and acidification techniques. This allowed us to obtain samples representing the quality of water our participants would consume, as well as increased versatility in the number of constituents that could be probed by analytical techniques. We acknowledge that foregoing filtration and acidification can introduce a negative bias into metals analysis; however, this would result in a conservative underestimation of concen- trations.15 Furthermore, the MCL values for drinking water are based on unfiltered samples that have not been acidified.15 2.2. Analysis. Chemical analyses were conducted using gas chromatography−mass spectrometry (GC-MS), headspace-gas chromatography (HS-GC), and inductively coupled plasma- mass spectrometry (ICP-MS). See the Supporting Information (SI) Table S1 for a list of compounds screened. Arsenic, selenium, strontium, barium, methanol, ethanol, TDS, and volatile organic compounds (VOCs) such as benzene, toluene, ethylbenzene, and xylenes (collectively referred to as BTEX) were the primary targets of chemical analyses. Historical data for the concentrations of target compounds (except alcohols) in private water well samples from this region were obtained to evaluate their occurrence before the expansion of natural gas extraction activities.11 This historical data set is comprised of 330 private drinking water wells from the Trinity, Woodbine, and Nacatoch aquifers sampled over a ten year period (1989− 1999) before natural gas activities began. Wells were located in the same counties that we sampled in this study (SI Figure S1). All wells were used for water withdrawal and ranged in depth from 14 to 1090 m with an average depth of 207 m. For more detailed description of methods and analyses, see the SI Methods. 3. RESULTS AND DISCUSSION 3.1. Water Quality. The data set detailing well depth, distance to the nearest natural gas well, concentration of constituents, and the suite of general water quality parameters of each private well sample is provided in the Supporting Information (SI). We found no evidence of BTEX compounds using both LC-UV-MS and GCMS. Levels of TDS in active extraction areas averaged 585 mg/L and ranged 200−1900 mg/ L, while TDS in nonactive/reference areas averaged 500 mg/L and ranged 400−600 mg/L. Exceedances for the Environ- mental Protection Agency’s (EPA) TDS Drinking Water Maximum Contaminant Limit (MCL) of 500 mg/L were detected in 50 of 91 samples from active extraction areas and 7 of 9 samples from the nonactive/reference areas (Table 1). The maximum TDS values detected in the active extraction area were over three times higher than the maximum value from the nonactive/reference areas. These aquifers naturally show somewhat elevated levels of TDS, so these concentrations are not unusual for the area,12 and the mean TDS concentration in active extraction areas is similar to levels seen in historical data for this region (585 mg/L versus 670 mg/L). 3.2. Levels of Heavy Metals in Private Well Water. Arsenic, selenium, strontium, and barium are known to occur naturally at low levels in aquifers overlying the Barnett Shale formation.12,16 Chemical analysis using ICP-MS (see the SI Methods) detected arsenic in 90 of 91 samples from active Table1.ConcentrationsofConstituentsinBarnettShalePrivateWaterWellSamplesa historicaldata(1989−99)activeextractionareawells(N=91)nonactiveandreferenceareawells(N=9) Nrangemean±stderror%≥MCLNrangemean±stderror%≥MCLNrangemean±stderror%≥MCL TDS344129−3302670.3±21.56191200−1900585.1±35.1*54.99400−600500±31.677.8 arsenic2411−102.8±0.10902.2−161.212.6±2.2*32.294.7−9.06.9±0.7*0 selenium3290.1−503.9±0.20.31010−108.733.3±10.5*20 strontium9920−167001028.9±213.7N/Ab 9066.2−181952319.8±330.1*N/A952.4−7646.21610±787.1N/A barium3570.1−38257.2±2.90901.8−173.732.3±3.3*092.9−6022.4±11.3*0 methanolN/A241.3−32933.6±13.3N/A51.2−62.927.4±13.7N/A ethanolN/A81−10.64.5±1.2N/A42.3−11.36.8±2.4N/A a Allvaluesaremeasuredinμg/Lexcepttotaldissolvedsolids(TDS),methanol,andethanolinmg/L.Valuesdenotedbyasterisksrepresentstatisticallysignificantdifferencesfromhistoricaldatavalues (Mann-WhitneyUpairwiseanalysis;p<0.05).Historicaldataforthecountiessampledinthisstudywereobtainedonlineatwww.TWDB.state.TX.us/groundwater/.MaximumContaminantLimits (MCL)obtainedfromtheEnvironmentalProtectionAgency’s(EPA)NationalPrimaryDrinkingWaterRegulations,2009.TDSMCL=500mg/L,arsenicMCL=10μg/L,seleniumMCL=50μg/L, bariumMCL=2000μg/L,N/AindicatesnoMCLhasbeenestablished.b EPArecommendsstablestrontiumvaluesindrinkingwaterdonotexceed4000μg/L. Environmental Science & Technology Article dx.doi.org/10.1021/es4011724 | Environ. Sci. Technol. XXXX, XXX, XXX−XXXC
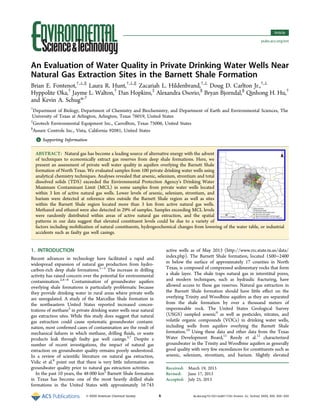
- 4. extraction areas and 9 of 9 samples from nonactive/reference areas. Concentrations were significantly higher in active extraction areas compared to reference samples and historical samples (Table 1). Arsenic concentrations in active extraction areas ranged from 2.2 to 161.2 μg/L, with an average of 12.6 μg/L. The maximum concentration of arsenic detected in a sample from an active extraction area was almost 18 times higher than both the maximum concentration among the nonactive/reference area samples and historical levels from this region. Notably, 29 of 90 water wells in active extraction areas exceeded EPA’s arsenic MCL for drinking water of 10 μg/L.17 Arsenic in this region is derived from Oligocene−Miocene volcanic ash and is adsorbed onto metal oxides and clays.18 Common forms of arsenic in groundwater are As(V) and As(III), also known as arsenate and arsenite, respectively.19 Arsenite, a reduced form of arsenate, is more mobile and toxic than arsenate.18,20,21 Sorption of arsenate is strongest at near- neutral pH, with adsorption rapidly weakening above pH ∼8.5;22 the pH values in our groundwater samples averaged 7.9, with values as high as 9.3. Although we cannot identify the biogeochemical processes that lead to higher pH values and subsequent arsenite mobilization, small perturbations such as lowering of the water table either through groundwater withdrawals or drought conditions could explain these results.18 Elevated arsenic concentrations can also occur in agricultural areas where pesticide application leads to arsenic introduc- tion,12 or in areas with cultivated cotton as arsenic was used as a defoliant.23 Reedy et al.24 showed that applied arsenic is limited to shallow surface soils due to strong interactions between arsenic and iron oxides and clays in soil. Given the low mobility of applied arsenic and the fact that none of our samples were collected from private wells in or adjacent to crop fields, we find agricultural arsenic introduction is unlikely to be the source of elevated arsenic concentrations. Moreover, if agriculture were the cause of elevated arsenic levels, then concentrations in the historical data would likely have been high as well, and we found no evidence of this. Selenium was less prevalent in the water samples, detected in 10 samples exclusively from active extraction areas. Selenium concentrations averaged 33 μg/L and ranged 10−109 μg/L, a stark contrast to the historical levels, which averaged 4 μg/L and ranged 0−50 μg/L. Two samples exceeded the selenium MCL of 50 μg/L,17 and concentrations in active extraction areas were significantly higher than historical levels although our sample size is too small to make definitive conclusions (Table 1). Strontium was detected in 90 of 91 samples from active extraction areas as well as 9 of 9 samples from the nonactive/ reference areas. Strontium concentrations in active extraction areas ranged 66−18 195 μg/L and were significantly higher than historical levels (Table 1). There is no established MCL for the stable strontium species analyzed in this study; however, Figure 2. (A) Total dissolved solids, (B) arsenic concentration, (C) selenium concentration, and (D) strontium concentration versus distance to the nearest natural gas well in Barnett Shale private water well samples. The dashed lines in A−C represent the Environmental Protection Agency’s Drinking Water Maximum Contaminant Limit (MCL) for each constituent. Note that the horizontal axis for C is a different scale. Environmental Science & Technology Article dx.doi.org/10.1021/es4011724 | Environ. Sci. Technol. XXXX, XXX, XXX−XXXD
- 5. an Agency for Toxic Substances and Disease Registry toxicological profile reports that the EPA currently recom- mends no more than 4000 μg/L in drinking water.28 Seventeen samples from the active extraction area and one sample from the nonactive/reference areas exceeded this recommended limit. Barium was also found in 90 of 91 samples from active extraction areas and 9 of 9 samples from nonactive/reference areas. None of the barium samples exceeded the MCL value of 2000 μg/L;17 however, the maximum value was much higher in the active extraction area compared to the nonactive/reference areas (174 μg/L and 60 μg/L, respectively). Additionally, the concentrations of arsenic and selenium as well as the concentrations of strontium and barium were positively correlated with one another (SI Table S2). These constituent concentrations could be due to mecha- nisms other than contamination of aquifers with fluids used in natural gas extraction. For example, lowering of the water table can lead to changes in pH that cause desorption of arsenic and selenium from iron oxide complexes or mobilization of arsenic through pyrite oxidation.22 The regional water table has slowly risen in recent years as the population has shifted from groundwater to surface water for drinking water (see SI Table S3).29 Recent drought conditions have also not had a severe impact on the water table, as levels in the Trinity and Woodbine aquifers are influenced more by the amount of groundwater withdrawal than the lack of recharge from decreased rainfall.30 While the regional water table has not decreased dramatically in the last 10 years, rural areas with high water withdrawal rates and/or withdrawal of large amounts of groundwater for use in hydraulic fracturing could lead to localized lowering of the water table. Bene et al.30 project that industrial use of groundwater for hydraulic fracturing will rise from 3% of total groundwater use in 2005 to 7% in 2025, which suggests that current and future industrial water use could cause localized water table reductions. Additionally, pyrite is not found at high levels in these aquifers,31 so it is an unlikely source of arsenic. Another potential mechanism is detailed in a report7 suggesting that mechanical disturbances, such as pressure waves from drilling activity, could loosen iron oxide particles from the casings of private water wells, leading to increased turbidity of well water. Arsenic and selenium could be mobilized into groundwater if iron oxide complexes are agitated. Strontium and barium form sulfate or carbonate scales on the interior casings of poorly maintained water wells Figure 3. Barnett Shale private water well depth versus (A) arsenic concentration (Spearman correlation coefficient = −0.28; p < 0.05; r2 = 0.023), (B) barium concentration (Spearman correlation coefficient = −0.359; p < 0.05; r2 = 0.075), (C) selenium concentration (Spearman correlation coefficient =0.142; p = 0.715; r2 = 0.057), and (D) strontium concentration (Spearman correlation coefficient = −0.35; p < 0.05; r2 = 0.05). Note that trend line is not shown for C due to small sample size. Environmental Science & Technology Article dx.doi.org/10.1021/es4011724 | Environ. Sci. Technol. XXXX, XXX, XXX−XXXE
- 6. and mechanical disturbance could also lead to mobilization of these constituents. While arsenic, selenium, strontium, and barium are present at low levels in many private water wells,9,24,25 the levels seen in this study warrant further investigation, as arsenic in groundwater is a health concern.26,27 3.3. Constituents and Distance to Nearest Gas Well. Arsenic, selenium, strontium, barium, and TDS reached their highest concentrations in areas of active extraction in close proximity to natural gas wells (Figure 2 and SI Figure S2). Samples that exceeded the MCL for TDS, arsenic, and selenium were located an average of 1.1 km from the nearest natural gas well. Similarly, the highest values for both strontium and barium were over twice as high in areas less than 2 km from the nearest natural gas well compared to more distant gas wells. The geographic patterns in our data suggest that lowering of the water table during a drought period cannot fully explain these elevated constituent levels. Concentrations that exceed the MCL occur only in close proximity to natural gas wells (Figure 2) suggesting that mechanical disturbances or localized groundwater withdrawals near natural gas wells could play a role in elevated constituent concentrations. If regional drought or widespread public water withdrawals were the cause of elevated constituent levels, then the geographic localities of MCL exceedances would be more evenly distributed throughout the study area, rather than in close proximity to natural gas wells. Additionally, regional lowering of the water table should have resulted in similar constituent concentrations in these aquifers during historical periods when groundwater withdrawal rates were even higher than present levels. 3.4. Constituents and Private Water Well Depth. Arsenic, strontium, and barium all showed significant negative correlations with the depth of private water wells (SI Table S2). This could be due to contact with surface sources as the highest concentrations of arsenic and other compounds occur at the shallowest depths of private water wells (Figure 3). Previous studies also found negative correlations with depth in studies of arsenic and other compounds in the Gulf Coast aquifer of Texas32 and the Paluxy aquifer,33 which is part of the larger Trinity aquifer. Glenn and Lester32 attributed their elevated constituent concentrations to a geologic origin, and we cannot rule out that scenario with these data. It is also possible that improper handling of waste materials and faulty gas well casings could result in the introduction of these compounds into shallow groundwater.34 Healy et al.35 demonstrated that fluid− matrix interactions in unlined wastewater tanks cause mobilization of naturally occurring salts and other constituents into groundwater, and Vidic et al.8 indicate that faulty casing seals in natural gas wells can cause groundwater contamination, although these casing failures occur infrequently (1−3% incidence rate in Marcellus Shale operations). 3.5. Heavy Metals and Total Dissolved Solids. Selenium was not correlated with TDS (likely due to small sample size), while strontium and barium showed significant negative correlations with TDS (SI Table S2). Arsenic showed a significant positive correlation with TDS (SI Figure S3 and SI Table S2), suggesting that it may be concurrently mobilized into groundwater with TDS during the natural gas extraction process. Again, mechanical disturbances (high pressure fluid injection, mechanical vibration, etc.) associated with natural gas extraction activities could be the cause of elevated levels of TDS and arsenic. Scanlon et al.23 also found a positive correlation between arsenic and TDS levels from the High Plains aquifer in a semiarid region of western Texas. They attributed this correlation to a counterion effect from an influx of saline water from the underlying Dockum aquifer that triggered a shift from calcium-rich to sodium-rich water, mobilizing arsenic from chemical complexes. Because arsenic levels in this region have historically been low (<10 μg/L) and TDS levels have not changed appreciably compared to historical levels, it seems unlikely that this scenario could explain the correlation between arsenic and TDS seen in this study.12 Additionally, the clay and nonkarstic carbonate layers separating the Woodbine and Trinity aquifers would not seem to allow a large influx of deep saline water to trigger a similar change in hydrogeochemistry. 3.6. Comparison to Historical Data. Concentrations of arsenic, strontium, and selenium were significantly higher in samples from active extraction areas compared to historical data (Table 1). Nonactive/reference area samples also showed a significant increase in arsenic compared to historical data (Table 1). Both active extraction and nonactive/reference areas showed a significant decrease in barium concentrations from historical levels (Table 1). Historical TDS concentrations were not significantly different from nonactive/reference area concentrations but were significantly higher than active extraction area samples (Table 1). On average, wells from the historical data set were 102 m deeper than our wells, and this could explain the difference in some constituents. While we cannot draw definitive conclusions due to the fact that the historical data was collected under different sampling conditions, these data do provide a baseline for comparison to preindustrial conditions, which is generally lacking in studies of this nature.8 3.7. Methanol and Ethanol in Private Well Water. SI Table S1 lists 29 compounds selected for GCMS analysis based on their inclusion in hydraulic fracturing fluid mixtures.13 Only methanol and ethanol, often included as anticorrosive agents in natural gas extraction, were detected in this study. Methanol and ethanol concentrations were quantified using HS-GC with flame ionization detection (see the SI Methods). Twenty-nine private water wells contained detectable amounts of methanol ranging 1−329 mg/L, with the highest concentrations from active extraction areas (Table 1). All six samples from Wise County contained methanol concentrations ranging 7−54 mg/ L, with an average concentration of 28 mg/L. These water wells are located between 215 and 610 m from the nearest natural gas wells and could represent concurrent contamination of multiple private wells, although we cannot identify the contamination source using these data. Ethanol was detected in 12 samples, ranging in concentration from 1 to 11 mg/L. Four out of nine samples from nonactive/reference areas contained both methanol and ethanol, suggesting that these chemicals are already present in groundwater in these areas and could have been introduced through something other than natural gas extraction. Methanol is known to occur naturally in groundwater as a byproduct of microbial metabolism,5,36 but it could also be introduced through contact with industrial wastewater. Similarly, ethanol can occur naturally or be introduced to groundwater through contact with industrial fuels.37 Naturally occurring ethanol is ephemeral and restricted to deep, anoxic environments different from shallow ground- water.38 Methanol and ethanol concentrations were not correlated with distance to the nearest gas well. The historical data did not include methanol and ethanol, so we cannot examine the historical occurrence of these constituents. The samples containing alcohol were collected and analyzed during multiple sampling and analysis events over Environmental Science & Technology Article dx.doi.org/10.1021/es4011724 | Environ. Sci. Technol. XXXX, XXX, XXX−XXXF
- 7. the entire study, ruling out laboratory contamination as the source. The occurrence of alcohols in our samples is relatively low, but it does warrant further research, as these compounds should have a very short lifespan in the environment and likely require an active source to sustain high concentrations. Our results show elevated concentrations of constituents in the Barnett Shale region; however, we are unable to determine the ultimate source of these elevated concentrations directly. Previous studies in the Marcellus Shale used geochemical and isotopic tracers to provide a direct link to the source of industrial or geological contamination (e.g., nonthermogenic methane and deep brine mixing with shallow groundwater5,6 ). Analyses to identify the origin of elevated constituent concentrations are beyond the scope of this study, which was intended simply to examine water quality in areas of natural gas extraction. In lieu of these analyses, we chose to evaluate the geographic occurrence and absolute concentration changes for these constituents over time by comparing this study’s data against previous characterizations of groundwater in this region from the scientific literature and a large historical data set from the same region. This comparison shows a significant increase in the mean concentration, maximum detected concentration, and MCL exceedances for As, Se, and Sr in our study area when compared to historical data and previous characterizations of these aquifers (Table 1).12,31 While our data indicate elevated levels of potentially harmful compounds in private water wells located near natural gas wells, it is important to recognize that there were also a number of private water wells in close proximity to natural gas wells that showed no elevated constituents. This indicates that natural gas extraction activities do not result in systematic contamination of groundwater. We suggest that episodic contamination of private water wells could be due to a variety of natural and anthropogenic factors such as the mobilization of naturally occurring constituents into private wells through mechanical disturbances caused by intense drilling activity, reduction of the water table from drought or groundwater withdrawals, and faulty drilling equipment and well casings. The geographic locations of elevated constituent levels in our study are consistent with the notion that mechanical disturbance of private water wells and industrial accidents (e.g., equipment failure, faulty well casings, fluid spills, etc.) are more frequent in areas where natural gas extraction is active. To draw definitive conclusions about the origin of elevated constituent levels in these water wells would require a focused study of groundwater before, during, and after natural gas extraction activities. This was logistically impossible as industrial activities have been ongoing for more than 10 years in this area. Given this limitation, our discussion of the source of elevated constituents is speculative, but we have provided plausible scenarios to explain our data in an effort to increase scientific understanding of this topic and spur future research. At a minimum, these data suggest that private wells located near natural gas wells may be at higher risk for elevated levels of constituents than those located further from natural gas wells. We advocate regular water monitoring utilizing targeted analytical chemistry along with toxicity assays to understand the complex interactions among groundwater constituents and biological organisms.39 Future research will focus on monitor- ing private wells in the Cline Shale in the Permian Basin region of Texas before, during, and after natural gas extraction activities, understanding the role of mechanical disturbances, in mobilizing naturally occurring constituents into groundwater, and evaluating the effects of industrial accidents and waste disposal practices. Water quality in the Barnett Shale region is likely to become an even more contentious issue as public concerns and prolonged drought conditions place pressure on water reserves in the region. ■ ASSOCIATED CONTENT *S Supporting Information Additional materials and methods, figures, tables, and the complete water quality data set referenced in the text. This information is available free of charge via the Internet at http:// pubs.acs.org. ■ AUTHOR INFORMATION Corresponding Author *Phone: 817-272-3541. E-mail: kschug@uta.edu. Present Address ∥ Water Quality Protection Division, United States Environ- mental Protection Agency, Dallas, Texas 75202 Author Contributions ⊥ These authors contributed equally to this work. Additionally, B.E.F., L.R.H., Z.L.H., D.D.C., B.B., and K.A.S. designed the research; B.E.F., L.R.H., Z.L.H., D.D.C., H.O., J.L.W., D.H., and A.O. performed the research; B.B., D.H., A.O., and K.A.S. contributed reagents, analytical machines, and field sampling equipment; B.E.F., Z.L.H., D.D.C., A.O., and J.L.W. analyzed data; and B.E.F., Z.L.H., D.D.C., L.R.H., and Q.H.H. wrote the paper. Notes Disclaimer. This work is not a product of the United States Government or the United States Environmental Protection Agency, and the authors did not do this work in any governmental capacity. The views expressed are those of the authors only and do not necessarily represent those of the United States or the United States Environmental Protection Agency. The authors declare no competing financial interest. ■ ACKNOWLEDGMENTS We thank M. Overbay and P. Crocker for providing valuable comments on an earlier version of this manuscript. Funds used to support this study were from an unrestricted and unrelated award to the corresponding author from Eli Lilly and Company. We wish to thank Guido Verbeck IV at The University of North Texas for assistance with ICP-MS metals analysis and The Shimadzu Center for Advanced Analytical Chemistry at The University of Texas at Arlington for use of GC instrumentation. Most importantly, we would like to thank the participating well owners for their invaluable contribution to this research. Q.H.H. is currently supported by the Department of Energy’s Research Partnership to Secure Energy for America to study the fracture-matrix interaction in gas recovery from the Barnett Shale. ■ REFERENCES (1) Nicot, J. P.; Scanlon, B. R. Water use for Shale-gas production in Texas, U.S. Environ. Sci. Technol. 2007, 46 (6), 3580−3586. (2) Kerr, R. A. Natural gas from shale bursts onto the scene. Science 2010, 328 (5986), 1624−1626. (3) Simon, J. A.; Fleming, M. E. Editor′s perspectiveShale gas development: Environmental issues and opportunities. Remediation 2011, 21 (4), 1−10. Environmental Science & Technology Article dx.doi.org/10.1021/es4011724 | Environ. Sci. Technol. XXXX, XXX, XXX−XXXG
- 8. (4) Otton, J. K. Environmental Aspects of Produced-water Salt Releases in Onshore and Coastal Petroleum-producing Areas of the Conterminous U.S.A Bibliography; Open-File Report 2006-1154; United States Geological Survey, United States Department of the Interior: Reston, VA, 2006; http://pubs.usgs.gov/of/2006/1154/pdf/of06-1154_508. pdf. (5) Osborn, S. G.; Vengosh, A.; Warner, N. R.; Jackson, R. B. Methane contamination of drinking water accompanying gas-well drilling and hydraulic fracturing. Proc. Natl. Acad. Sci. 2011, 108 (20), 8172−8176. (6) Warner, N. R.; Jackson, R. B.; Darrah, T. H.; Osborn, S. G.; Down, A.; Zhao, K.; White, A.; Vengosh, A. Geochemical evidence for possible natural migration of Marcellus Formation brine to shallow aquifers in Pennsylvania. Proc. Natl. Acad. Sci. 2012, 109 (30), 11961− 11966. (7) Groat, C. G.; Grimshaw, T. W. Fact-Based Regulation for Environmental Protection in Shale Gas Development; Energy Institute at The University of Texas at Austin: Austin, TX, 2006; http://cewc. colostate.edu/wp-content/uploads/2012/02/ei_shale_gas_ regulation120215.pdf. (8) Vidic, R. D.; Brantley, S. L.; Vandenbossche, J. M.; Yoxtheimer, D.; Abad, J. D. Impact of shale gas development on regional water quality. Science 2013, 340 (6134), DOI: 10.1126/science.1235009. (9) Welch, A. H.; Westjohn, D. B.; Helsel, D. R.; Wanty, R. B. Arsenic in ground water of the United States: Occurrence and geochemistry. Ground Water 2000, 38 (4), 589−604. (10) Squillace, P. J.; Scott, J. C.; Moran, M. J.; Nolan, B. T.; Kolpin, D. W. VOCs, pesticides, nitrate, and their mixtures in groundwater used for drinking water in the United States. Environ. Sci. Technol. 2002, 36 (9), 1923−1930. (11) Texas Water Development Board Groundwater Database Website; http://www.twdb.state.tx.us/groundwater/data/gwdbrpt.asp (accessed January 15, 2012). (12) Reedy, R. C.; Scanlon, B. R.; Walden, S.; Strassberg, G. Naturally Occurring Groundwater Contamination in Texas; Final Report 1004831125; Texas Water Development Board: Austin, TX, 2011; http://www.twdb.state.tx.us/publications/reports/contracted_ reports/doc/1004831125.pdf (13) Chemicals Used in Hydraulic Fracturing; United States House of Representatives Committee on Energy and Commerce: Washington DC, 2011; http://democrats.energycommerce.house.gov/sites/ default/files/documents/Hydraulic-Fracturing-Chemicals-2011-4-18. pdf. (14) Guerra, K.; Dahm, K.; Dundorf, S. Oil and Gas Produced Water Management and Beneficial Use in the Western United States; Science and Technology Program Report No. 157; Bureau of Reclamation, Department of the Interior: Washington DC, 2011; http://www.usbr. gov/research/AWT/reportpdfs/report157.pdf. (15) Nielson, D. M.; Nielson, G. L. Groundwater Sampling. In Practical Handbook of Environmental Site Characterization and Ground- Water Monitoring, 2nd ed.; Nielson, D. M., Ed.; CRC Press: Boca Raton, FL, 2006. (16) Bush, P. W.; Ardis, A. F.; Fahlquist, L.; Ging, P. B.; Hornig, C. E.; Lanning-Rush, J. Water Quality in South-Central Texas, 1996−98; US Geological Survey Circular 1212; United States Geological Survey: Washington DC, 2000; http://pubs.water.usgs.gov/circ1212/. (17) National Primary Drinking Water Regulations; Environmental Protection Agency: Washington DC, 2009; http://water.epa.gov/ drink/contaminants/upload/mcl-2.pdf. (18) Gates, J. B.; Nicot, J. P.; Scanlon, B. R.; Reedy, R. C. Arsenic enrichment in unconfined sections of the southern Gulf Coast aquifer system, Texas. Appl. Geochem. 2011, 26, 421−431. (19) Cullen, W. R.; Reimer, K. J. Arsenic speciation in the environment. Chem. Rev. 1989, 89, 713−764. (20) Goldberg, S. Competitive adsorption of arsenate and arsenite on oxide and clay minerals. Soil Sci. Soc. Am. J. 2002, 66, 413−421. (21) Hu, Q. H.; Sun, G. X.; Gao, X. B.; Zhu, Y. G. Conversion, sorption, and transport of arsenic species in geological media. Appl. Geochem. 2012, 27, 2197−2203. (22) Goldberg, S.; Johnson, C. T. Mechanisms of arsenic adsorption on amorphous oxides evaluated using macroscopic measurements, vibrational spectroscopy, and surface complexation modeling. J. Colloid Interface Sci. 2001, 234 (1), 204−216. (23) Scanlon, B. R.; Nicot, J. P.; Reedy, R. C.; Kurtzman, D.; Mukherjee, A.; Nordstrom, D. K. Elevated naturally occurring arsenic in a semiarid oxidizing system, Southern High Plains aquifer, Texas, U.S.A. Appl. Geochem. 2009, 24, 2061−2071. (24) Reedy, R. C.; Scanlon, B. R.; Nicot, J. P.; Tachovsky, J. A. Unsaturated zone arsenic distribution and implications for ground- water contamination. Environ. Sci. Technol. 2007, 41 (20), 6914−9. (25) Scanlon, B.; Nicot, J. P.; Reedy, R. C.; Tachovsky, J. A.; Nance, S. H.; Smyth, R. C.; Keese, K.; Ashburn, R. E.; Christian, L. Evaluation of Arsenic Contamination in Texas; Report Prepared for Texas Commission on Environmental Quality; Texas Commission on Environmental Quality: Austin, TX, 2005; http://www.beg.utexas. edu/staffinfo/pdf/Scanlon_As_r2005.pdf. (26) Sengupta, M. K.; Mukherjee, A.; Hossain, M. A.; Ahamed, S.; Rahman, M. M.; Lodh, D.; Chowdhury, U. K.; Biswas, B. K.; Nayak, B.; Das, B.; Saha, K. C.; Chakraborti, D.; Mukherjee, S. C.; Chatterjee, G.; Pati, S.; Dutta, R. N.; Quamruzzaman, Q. Groundwater arsenic contamination in the Ganga-Padma-Meghna-Brahmaputra plain of India and Bangladesh. Arch. Environ. Health 2003, 58 (11), 701−2. (27) Ahamed, S.; Sengupta, M. K.; Mukherjee, S. C.; Pati, S.; Mukherjeel, A.; Rahman, M. M.; Hossain, M. A.; Das, B.; Nayakl, B.; Pal, A.; Zafar, A.; Kabir, S.; Banu, S. A.; Morshed, S.; Islam, T.; Quamruzzaman, Q.; Chakraborti, D. An eight-year study report on arsenic contamination in groundwater and health effects in Eruani village, Bangladesh and an approach for its mitigation. J. Health Popul. Nutr. 2006, 24 (2), 129−41. (28) Toxicological Profile for Strontium; Agency for Toxic Substances and Disease Registry; U.S. Department of Health and Human Services, Public Health Service: Atlanta, GA, 2004; http://www.atsdr.cdc.gov/ toxprofiles/tp159.pdf. (29) Bene, J.; Harden, R. W.; Henkel, B.; Kaiser, R.; Spencer, K.; Zimmerman, J.; Burton, S.; Donnelly, A.; O’Rourke, D.; Shaw, K.; Griffin, S.; Schuster, S. Northern Trinity/Woodbine Aquifer Groundwater Availability Model; Texas Water Development Board: Austin, TX, 2004; http://www.twdb.state.tx.us/groundwater/models/gam/trnt_ n/TRNT_N_Model_Report.pdf. (30) Bene, J.; Harden, R. W.; Griffin, S.;Nicot, J. P. Northern Trinity/ Woodbine GAM Assessment of Groundwater Use in the Northern Trinity Aquifer Due to Urban Growth and Barnett Shale Development; Texas Water Development Board: Austin, TX, 2007; http://www.twdb.state. tx.us/groundwater/models/gam/trnt_n/TRNT_N_Barnett_Shale_ Report.pdf . (31) George, P. G.; Mace, R. E.; Petrossian, R. Aquifers of Texas; Texas Water Development Board: 2011; http://www.twdb.state.tx.us/ publications/reports/numbered_reports/doc/R380_AquifersofTexas. pdf (32) Glenn, S.; Lester, J. L. An analysis of the relationship between land use and arsenic, vanadium, nitrate, and boron contamination the Gulf Coast aquifer of Texas. J. Hydrol. 2010, 389 (1−2), 214−226. (33) Fritch, T. G.; McKnight, C. L.; Yelderman, J. C., Jr.; Arnold, J. G. Environmental Auditing: An aquifer vulnerability assessment of the Paluxy Aquifer, central Texas, U.S.A., Using GIS and a modified DRASTIC approach. Environ. Manage. 2000, 25 (3), 337−345. (34) Howarth, R. W.; Ingraffea, A.; Engelder, T. Natural gas: Should fracking stop? Nature 2011, 477 (7364), 271−5. (35) Healy, R. W.; Bartos, T. T.; Rice, C. A.; Mckinley, M. P.; Smith, B. D. Groundwater chemistry near an impoundment for produced water, Powder River Basin, Wyoming, U.S.A. J. Hydrol. 2011, 403 (1− 2), 37−48. (36) Grossman, E.; Coffman, B.; Fritz, S.; Wada, H. Bacterial production of methane and its influence on ground-water chemistry in east-central Texas aquifers. Geology 1989, 17, 495−499. (37) Oremland, R.; Whiticar, M.; Strohmaier, F.; Kiene, R. Bacterial ethane formation from reduced, ethylated sulfur compounds in anoxic sediments. Geochim. Cosmochim. Acta 1988, 52, 1895−1904. Environmental Science & Technology Article dx.doi.org/10.1021/es4011724 | Environ. Sci. Technol. XXXX, XXX, XXX−XXXH
- 9. (38) Ulrich, G. The Fate and Transport of Ethanol-Blended Gasoline in the Environment: A Literature Review and Transport Modeling; Governor’s Ethanol Coalition: Lincoln, NE, 1999; http://nlcs1.nlc. state.ne.us/epubs/E5700/B055-1999.pdf (39) Lapota, D.; Osorio, A. R.; Liao, C.; Bjorndal, B. The use of bioluminescent dinoflagellates as an environmental risk assessment tool. Mar. Pollut. Bull. 2007, 54 (12), 1857−67. Environmental Science & Technology Article dx.doi.org/10.1021/es4011724 | Environ. Sci. Technol. XXXX, XXX, XXX−XXXI