CUI PAPER Bahrain v2 - 7April2015 (2)- edited 02 November 2015 Short
860686
1. IBP555_03
RISK BASED INSPECTION PLANNING OF THE OLAPA PIPELINE
Renato Mendes1
, Álvaro Correia Neto2
, Maher Nessim3
, Amir Muradali4
Copyright 2003, Brazilian Petroleum and Gas Institute - IBPilian Petroleum and Gas Institute - IBP
This paper was prepared for presentation at the Rio Pipeline Conference & Exposition 2003, held in October, 22-24, Brazil, Rio de Janeiro.This paper was prepared for presentation at the Rio Pipeline Conference & Exposition 2003, held in October, 22-24, Brazil, Rio de Janeiro.
This paper was selected for presentation by the Event Technical Committee following review of information contained in an abstract
submitted by the author(s). Contents of the paper, as presented, have not been reviewed by the IBP. Organizers will neither translate nor
correct texts received. The material, as presented, does not necessarily reflect any position of the Brazilian Petroleum and Gas Institute, its
officers, or members. It’s Author’s knowledge and approval that this Technical Paper will be published in the Rio Pipeline Conference &
Exposition 2003 “brouchure”
Abstract
OLAPA is a 93.5 km, 12.75 inch pipeline transporting low and high vapor liquid products in
both directions between the REPAR refinery and a terminal near Paranagua, TEPAR.
Initially installed in 1976 with X46 steel and coal tar coating, OLAPA traverses various types
of land use and crosses a number of major roads and waterways. A quantitative risk-based
maintenance planning study is being carried out on OLAPA. The objectives of the study are
to identify key hazards that could lead to pipeline failure, estimate the operating risk
associated with these hazards, carry out risk sensitivity analyses for key parameters, and
identify optimal future maintenance activities. This analysis is being carried out using the
quantitative risk analysis model PIRAMID™, which makes extensive use of engineering
models to calculate probabilities and consequences of failure. This paper describes the
quantitative risk analysis approach used in the study and preliminary outcomes from this
study.
Introduction
This paper summarizes a Risk Based Inspection (RBI) study on Petrobras’ OLAPA pipeline
conducted by C-FER Technologies (C-FER) under sub contract to Bureau Veritas (BV). The
objectives of the study were to identify key hazards that could lead to pipeline failure,
estimate the operating risk associated with these hazards, carry out risk sensitivity analyses
for key parameters, and identify optimal future maintenance activities.
1 – Pipeline System
OLAPA is a 93.5 km, 12.75 inch pipeline transporting liquid products between the Petrobras
Parana refinery (REPAR) and terminal near Paranagua (TEPAR). The pipeline transports
Low Vapor Pressure (LVP) liquids as well as High Vapor Pressure (HVP) Liquefied
Petroleum Gases (LPG) in both directions.
1
PETROBRAS/ENGENHARIA, Rio de Janeiro, Brazil.
2
PETROBRAS/TRANSPETRO, Rio de Janeiro, Brazil.
3,4
C-FER Technologies, Edmonton, AB. Canada.
2. IBP555_03
OLAPA was initially installed in 1976 using X46 grade steel and coal tar external coating. In
addition to the two remote control end valves, 11 manually operated valves are installed at
different locations along the pipeline length. The pipeline traverses various types of land use
including residential, commercial, industrial, agricultural, parkland and remote. It also
crosses a number of waterways, streams and roadways. The 3 km segment immediately
adjacent to the terminal is located offshore in Paranagua Bay, running parallel to the shoreline
in an average water depth of 1.7 m in high tide. The pipeline has an elevation differential of
approximately 900m, most of which occurs between the terminal and the mid-point of the
pipeline.
Since the year 2001, the pipeline has been inspected for metal loss with a Magnetic Flux
Leakage (MFL) tool. Most of the defects reported have been excavated and repairs were
carried out where necessary. In addition, sections subject to slope movement have been stress
relieved and an extensive slope-monitoring program has been put in place. To prevent
mechanical damage, the pipeline is buried to a depth between 0.8 and 1.34 m, patrolled
monthly, and marked with highly visible and closely spaced signs.
2 – Project Methodology
The analysis was carried out using C-FER’s pipeline risk analysis model PIRAMID™
(PIpeline Risk Analysis for Maintenance and Inspection Decisions) (Nessim et al 1996, 1998,
2000). The following tasks were undertaken to achieve the project objectives:
1. Data transfer. The key failure causes for OLAPA were identified and data required
for PIRAMID™ analysis (failure cause and consequence modeling) was collected
under this task. BV and Petrobras performed majority the data collection, with C-FER
providing assistance and advice.
2. Risk analysis. Using information on the characteristics of the pipeline and right-of-
way, the probabilities and of small leak, large leak and rupture failures were estimated
for key failure causes including equipment impact, corrosion (external and internal),
manufacturing defects, seam weld cracks, and ground movement (transverse and
longitudinal). The consequences of failure were also calculated for small leaks, large
leaks and ruptures. Consequences are expressed in terms of total cost as a measure of
financial impact, expected number of fatalities as a measure of safety impact and
expected spill volume (adjusted for site sensitivity) as a measure of environmental
impact. The probability and consequence measures were calculated as functions of
km post along the pipeline. Risk at any location along the line was then calculated as
the sum of the failure probability multiplied by the failure consequences for all failure
causes and failure modes (i.e. small leak, large leak and rupture).
2
3. IBP555_03
3. Scenario analysis. A “what-if” scenario is defined as a copy of the original pipeline
model, in which one or more parameters are changed to reflect proposed inspection
and maintenance activities (or any other changes in operational parameters) or other
operational changes. A number of scenarios were defined in consultation with
Petrobras and each scenario was analyzed to calculate the impact of the proposed
changes on the overall risk. Where appropriate, scenarios were evaluated on a cost-
benefit basis to identify the most cost effective inspection and maintenance strategies.
4. Development of conclusions and recommendations. The results of the risk and
scenario analyses were used to develop a set of recommendations regarding inspection
and maintenance of the OLAPA pipeline.
3 – Risk Analysis
The following highlights the assumptions made in analyzing the OLAPA pipeline. Presented
are the primary inputs used to estimate the failure probability (for each hazard) and the
consequences for the pipeline. All failure causes, with the exception of “seam weld cracks”
and “other causes”, are estimated using structural reliability based models in PIRAMID™
(Nessim et al. 1996, 1998, 2000). Seam weld cracks are estimated using a simplified
historical based model in PIRAMID™
(Nessim et al. 1996, 1998, 2000).
Equipment Impact. Both the onshore and offshore sections of OLAPA face the possibility of
damage due to third party. For onshore sections, typical pipelines face the threat of damage
due to third party excavations. Whereas offshore pipelines face the threat of damage due to
dragged objects (anchors and fishing nets) as well as boat grounding. In further evaluating
the offshore section for OLAPA (in Paranagua Bay), the threat for damage was considered to
be negligible considering the bathymetry of the bay, the types of boats in this vicinity and the
pipeline depth of burial. Therefore only the onshore section of OLAPA is being evaluated for
equipment impact hazard.
External and Internal Corrosion. In 2001, an In Line Inspection (ILI) was carried out. All
metal loss defects with maximum depths greater than 25% of the wall thickness are
conservatively considered for this failure cause analysis since these are significant in size and
can potentially grow due to corrosion. This calculation is being refined further to account for
all defects smaller than 25% wall thickness.
Mill Defects. The ILI tool also detected metal loss defects due to mill construction. A mill
defect that has survived the commissioning pressure test does not represent a concern unless it
grows with time. If these defects were formed by cold working (e.g. a gouge), they could
have hardened metal at the base, from which a sharp crack could initiate and further grow by
fatigue under pressure cycling. Since the mechanism by which these defects were formed is
not known, this scenario is conservatively assumed to apply to all defects whose maximum
3
4. IBP555_03
depths are greater than 25% wall thickness. Similar to the case for corrosion, this calculation
is also being refined further to consider the smaller defects.
Seam Weld Cracks. The failure rate due to seam weld cracks is calculated from the magnitude
and frequency of hoop stress cycles using an S-N relationship.
Ground Movement. The OLAPA pipeline traverses a number of moving slopes between km
45 and km 61. In 2001, Petrobras undertook an extensive ground movement management
program, which included a) excavation of all locations experiencing significant soil
movement, replacement of damaged sections, stress relief of the pipeline, and installation of
surface drains to reduce the soil moisture content and limit the amount of ground movement,
b) Installation of a number of inclinometers on each slope to monitor the magnitude and
direction of movement, and c) pipe-soil interaction analyses, which involved characterizing
the soil mechanical properties and developing force-displacement relationships for soil loads
on the pipe in both the transverse and longitudinal directions. All ground movement failure
rate calculations are based on information developed by Petrobras under this program and
provided to C-FER for the RBI study. This information includes ground movement
characterizations from inclinometer data at specific locations and soil stiffness and strength
values from the pipe-soil interaction analysis. Further refinement of this analysis will include
considering potential ground movement at all sloped locations.
Stress Corrosion Cracking. No significant evidence of SCC was found and therefore this
failure cause is not considered in the analysis.
Other Causes. This failure cause covers failures due to miscellaneous events such as
defective girth, fabrication and repair welds, operator error, lightning and vandalism.
Consequences Estimation. Of primary concern for OLAPA in the event of a failure are the
costs associated to site restoration, compensation costs, environmental fines and costs due to
loss of production. Petrobras provided all relevant costs, which are used to estimate the
consequences of product spilled using PIRAMID™
(Nessim et al. 1996, 1998, 2000).
Figure 1 shows the Expected Cost (financial risk) profiles by failure cause. Apart from the
miscellaneous failures category (referred to as other causes), equipment impact is the highest
contributor to overall risk at present. Corrosion, mill defects and seam weld cracks have a
negligible contribution to risk at present; however, the contributions of these cause increase
with time. Figure 2 shows the change in Expected Cost by failure cause over time at one
point along the pipeline (km 55). Corrosion risk increases to a value similar to equipment
impact within approximately 10 years. Mill defects and seam weld fatigue remain
insignificant for 30 years, although they reach perceptible levels for the thinnest segment of
the pipeline (km 0 to 36.5). Transverse and longitudinal ground movements contribute to the
4
5. IBP555_03
risk at specific locations, and similar to corrosion, their contributions could become
significant within the 30-year analysis period.
Figure 1 Expected Cost by Failure Cause
Figure 2 Expected Cost by Failure Cause Over Time at km 55
5
6. IBP555_03
4 – Inspection and Maintenance Planning
The proposed inspection and maintenance plan focuses on mitigating risks due to the primary
contributors namely, equipment impact, metal loss corrosion defects, and ground movement.
Prevention of equipment impact. A number of possible mitigation strategies are considered
including installation of above ground markers consisting of closely spaced posts at selected
locations, installation of mechanical protection at high risk locations and increasing the right-
of-way patrol frequency from once per month to twice per week. PIRAMID™ results from a
benefit-cost analysis for these actions are shown in Figure 3. A benefit-cost ratio below one
indicates that the scenario is not economically viable as its costs exceed its economic benefits.
Figure 3 indicates that installation of mechanical protection and increasing the right-of-way
patrol frequency are not cost-effective. Installation of above ground alignment markers is
economically viable (after 6 years) and a sustained reduction in risk over the entire 30-year
analysis period.
Figure 3 Benefit-Cost Ratio for Equipment Impact Mitigation Actions
Defect rehabilitation. The rehabilitation scenarios considered included, hydrostatic testing at
a pressure of 1.25 MAOP and inspection with a high-resolution magnetic flux leakage tool.
Combined with the inspection, two possible repair criteria were considered based on
minimum required thickness values of 70% and 75% of the original wall. Figure 4 shows
results from a cost optimization analysis using PIRAMID™. The most cost-effective solution
can be identified as the lowest cost point on this figure. Figure 4 shows that the status quo
(do nothing) is the most cost-effective option for a period of 20 years. This indicates that an
6
7. IBP555_03
ILI or Hydrostatic test need not be undertaken in the near future. Although, the results
suggest that the status quo is optimal for 20 years, it is considered prudent to re-visit this
conclusion within a shorter period (e.g. 10 years). This conclusion is preliminary and is based
on assessing defects larger than 25% wall thickness.
Figure 4 Cost Optimization for Defect Rehabilitation Actions
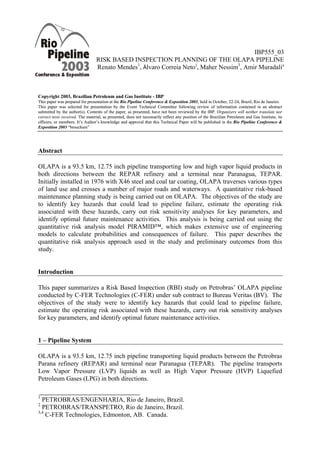
Ground movement mitigation. Since Petrobras has an extensive program in monitoring the
ground movement at hilly locations where the pipeline crosses, this mitigation action involved
providing some correlation of the failure rate and risk to the amount of ground movement.
The probability of failure due to ground movement was estimated as a function of soil
movement magnitude (see Figure 5). Since the pipe and soil properties are the same in all
locations involving slope movement, the results of this analysis apply to all such locations.
The results show that transverse ground movement is initially more likely to lead to a failure,
but that the failure probability due to longitudinal ground movement increases at a higher rate
and surpasses the failure probability due to transverse movement at 400 mm of total
movement.
7
8. IBP555_03
1.00E-12
1.00E-11
1.00E-10
1.00E-09
1.00E-08
1.00E-07
1.00E-06
1.00E-05
1.00E-04
1.00E-03
1.00E-02
1.00E-01
1.00E+00
0 200 400 600 800 1000 1200 1400 1600 1800 2000
Ground Movement (mm)
ProbabilityofFailure(perlocation)
Longitudinal
Transverse
Figure 5 Probability of Failure as a Function of Ground Movement Magnitude
5 – Summary
A Risk Based Inspection (RBI) study is being performed on Petrobras’ pipeline, OLAPA, the
approach of which is summarized in this paper. OLAPA is 93.5 km in length transporting
liquid products together with High Vapor Product (HVP) Liquefied Propane Gas (LPG). For
this pipeline, the risk analysis and scenario analysis considering various risk mitigative
actions is being performed by C-FER using PIRAMID™ software. Preliminary results from
this study indicate that the dominant failure causes for this pipeline are metal loss corrosion,
ground movement and third party damage, and the main driver for total economic risk is spill
volume.
6 – Acknowledgements
The authors would like to thank Bureau Veritas Brazil for their support during the data-
gathering phase of this project and their continued support in making this work possible.
7 – References
Nessim, M.A., Stephens, M.J. and Zimmerman, T.J.E. Risk-based Maintenance Planning for
Offshore Pipelines. Presented at the 2000 Offshore Technology Conference (OTC), Houston,
Texas, May 1-4
Nessim, M.A. and Stephens, M.J. 1998. Managing the Operating Risk Posed by Metal Loss
Corrosion and Mechanical Interference. Pipe Line and Gas Industry, Gulf Publishing, Part 1-
June and Part 2-August, 1998.
Stephens, M.J. and Nessim, M.A. 1996. Pipeline Maintenance Planning Based on
Quantitative Risk Analysis. Proceedings of the International Pipeline Conference, 1996.
Sponsored by the American Society of Mechanical Engineers (ASME). Calgary, Alberta.
8