Comparing and Selecting Solutions Using TCO Analysis
•
1 gefällt mir•782 views

TCO comparison calculators and tools can drive incremental wins and competitive advantage for B2B solution providers.

Empfohlen
Empfohlen
Weitere ähnliche Inhalte
Mehr von Alinean, Inc.
Mehr von Alinean, Inc. (20)
Kürzlich hochgeladen
Kürzlich hochgeladen (20)
Comparing and Selecting Solutions Using TCO Analysis
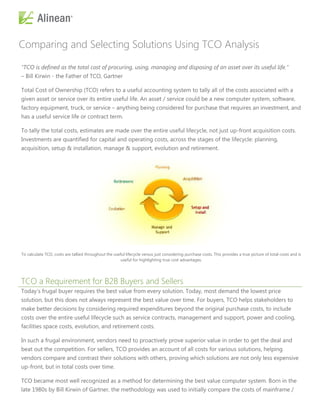
- 1. Comparing and Selecting Solutions Using TCO Analysis "TCO is defined as the total cost of procuring, using, managing and disposing of an asset over its useful life.” – Bill Kirwin - the Father of TCO, Gartner Total Cost of Ownership (TCO) refers to a useful accounting system to tally all of the costs associated with a given asset or service over its entire useful life. An asset / service could be a new computer system, software, factory equipment, truck, or service – anything being considered for purchase that requires an investment, and has a useful service life or contract term. To tally the total costs, estimates are made over the entire useful lifecycle, not just up-front acquisition costs. Investments are quantified for capital and operating costs, across the stages of the lifecycle: planning, acquisition, setup & installation, manage & support, evolution and retirement. To calculate TCO, costs are tallied throughout the useful lifecycle versus just considering purchase costs. This provides a true picture of total costs and is useful for highlighting true cost advantages. TCO a Requirement for B2B Buyers and Sellers Today’s frugal buyer requires the best value from every solution. Today, most demand the lowest price solution, but this does not always represent the best value over time. For buyers, TCO helps stakeholders to make better decisions by considering required expenditures beyond the original purchase costs, to include costs over the entire useful lifecycle such as service contracts, management and support, power and cooling, facilities space costs, evolution, and retirement costs. In such a frugal environment, vendors need to proactively prove superior value in order to get the deal and beat out the competition. For sellers, TCO provides an account of all costs for various solutions, helping vendors compare and contrast their solutions with others, proving which solutions are not only less expensive up-front, but in total costs over time. TCO became most well recognized as a method for determining the best value computer system. Born in the late 1980s by Bill Kirwin of Gartner, the methodology was used to initially compare the costs of mainframe /
- 2. minicomputers with PCs and networks. In these studies of early IT investments, the purchase price of the hardware and software was found to be only 15% of the total cost of owning the asset. Management, direct support and hidden user support accounted for 85% of the total cost over the useful life of the asset. At the time, a PC that cost $2,000 to $3,000 might actually cost the organization over $8,000 per year or more to keep in service. A sample 1994 comparison of TCO for PCs showing the top level ―chart of account‖ line items Since that time, total cost of ownership comparisons have been applied to many asset and service purchase comparisons, helping buyers and sellers make better purchase decisions. TCO has proven most useful when comparing different solution options, to determine which provides not just the cheapest purchase price, but the lowest total cost of ownership solution over the lifecycle. To accomplish this, TCO first uses an accounting system to tally all costs for the solutions being compared, when done correctly assuring that no costs are overlooked. The accounting system is called the ―Chart of Accounts‖. Second, for all the solutions being compared, the costs are tallied for each cost category. Placing these costs in the chart of accounts and comparing them head to head illustrates where some solutions are more expensive than others. Totaling the costs for each solution and comparing the totals indicates the lowest total cost of ownership solution.
- 3. A TCO head-to-head comparison illustrating the top-level chart of account items used for comparison. TCO versus ROI When comparing solutions, TCO only shows a portion of the decision making criteria. TCO is focused on costs, but places little on comparing the different business value of the asset. For example, to lower the TCO of productivity tools for users, desktop computers could be replaced with pen and pad, which has a TCO of $1.50, compared to an estimated $3,000 per year for the typical Windows computer system. As Lenny Liebmann of ComputerWorld indicates, ―Lower TCO doesn't mean higher ROI: This is a classic error. The assumption is that if you whittle down the cost of a resource, it will provide a higher return on investment. Not! If I buy a cheap used car and lose my job because I can't get to work reliably, did I really save money? Sure, buyers must control costs, but not through some arbitrary goal that isn't linked to real business drivers.‖ Obviously, more needs to go into the consideration than just TCO, but TCO is very useful in bringing the discussion beyond mere purchase price. Rightly so, by focusing on costs alone, the dramatic benefit differences of and between proposed solutions could be overlooked. It is therefore important to compare not just the TCO of different solutions, but the ROI differences as well (where ROI takes into account total cost of ownership versus benefits for each proposed solution). The Bottom Line For sellers, TCO is a requirement, assuring buyers that they are getting the best value solution – a requirement in today’s frugal environment. Alinean can help automate the calculation and presentation of TCO advantages for your solutions. Alinean works with extensive proprietary research and your team to develop on-line self-service TCO Calculators and more detailed sales driven TCO Comparison Sales Tools. Click here for more information on on-line TCO Calculators and TCO Comparison Sales Tools.
- 4. About Alinean Alinean, the leading provider of dynamic sales and marketing tools, empowers B2B vendors to better sell to today's economic-focused buyer. Alinean-powered interactive white papers, assessments, ROI calculators and TCO comparison tools create more compelling value-based connections, workshops, presentations and proposals — delivering customized diagnostics, benchmarks, solution recommendations, benefits, investments, ROI, payback and TCO advantage proof points. Leading B2B firms leveraging Alinean tools include: HP, IBM, Microsoft, EMC, Dell, Intel, IDC/IDG, AT&T, Siemens, Unisys, Thomson Reuters, NetApp, Citrix, Symantec, Novell, Cisco, Oracle, Sybase, and CA. Learn more: at the Fight FrugalnomicsTM Resource Center http://www.fightfrugalnomics.com, by visiting http://www.alinean.com, or calling 407.382.0005. ©2010 Alinean is a trademark of Alinean, Inc., in the United States. All other brands, products or service names are or may be trademarks, registered trademarks or service marks of, and used to identify, products or services of their respective owners. For more information, please visit www.alinean.com Alinean, Inc., 111 North Magnolia, Suite 1050, Orlando, FL 32801 TEL: 407.382.0005 | FAX: 407.382.0906 | TOLL FREE 866.693.6271