SlideShare ist ein Scribd-Unternehmen logo
1 von 11
Downloaden Sie, um offline zu lesen
Journal of Economics and Sustainable Development
ISSN 2222-1700 (Paper) ISSN 2222-2855 (Online)
Vol.4, No.18, 2013

www.iiste.org

Analysis of the Significance of Fishing on Food Security Status of
Rural Households Around Lake Ziway and Langano in Ethiopia
Dawit Garoma1*, Asefa Admassie2, Gezahegn Ayele3 and Fekadu Beyene1
1. Collage of Agriculture, School of Agricultural Economics and Agricultural Business, Haramaya University
Dire Dawa, Ethiopia
2. Principal Researcher IFPRI, Ethiopian Economics Association, Addis Ababa, Ethiopia;
3. Capacity building, USAID, Addis Ababa, Ethiopia;
*e-mail of corresponding author: dgaromaa@yahoo.com
Abstract
This research work was conducted to investigate the significance of fishing on food security status of rural
households around Lake Ziway and Langano in Ethiopia. The studied districts were selected using purposive
sampling, as they are adjacent to the two lakes. Simple random sampling was employed to select 344 rural
households for primary data collection. For this particular work, respondents were further classified into food
secured fishing households and food insecure non-fishing households by employing food security index method.
As a result, 156 households were identified constituting of 51.3% food secure fishing households and 48.7%
food insecure non-fishing households.
The range of data collected were comprises of household socio-economic characteristics, food production, food
consumption, food purchases, fish income, non-fish income, and the like. Data analysis were made using
descriptive statistics, food security index and the propensity score matching.
Descriptive statistics examines distribution and socioeconomic characteristics of respondents using frequency
distribution tables. Considering, the equivalent male adult scale and energy composition of foods commonly
consumed by average household, the food security index was computed. Accordingly, the available food energy
was 31234kcal and 9283kcal for the food secure fishing household and food insecure non-fishing household,
respectively. On the contrary, the required food energy was greater for the food insecure household as compared
to the food secure once, indicating 14145kcal and 12523kcal, respectively. The mean difference were significant
at 5% level.
To examine the impact of fishing on food security status of rural household we employed the propensity score
matching method. This has been used to balance the observed distribution of covariate across the food secured
fishing and food insecure non-fishing household. Balancing test was made after matching that ascertained
absence of significant differences in covariate between fishing and non-fishing households in the matched
sample. Thus, the matched comparison groups were considered to be a plausible counterfactual. Accordingly, the
result of impact analysis verified the significance of fishing on food energy intake of average household using
the matched samples. In this regards, food secured fishing household was able to obtain extra energy from food
consumption as compared to the non-fishing food insecure counterpart indicating ATT of 27375 kcal and 27213
kcal using KBM and NNM algorithms, respectively. The results were statistically significant at 5% level.
Consequently, the stability of the findings were tested using Rosenbaum bounds approach that confirmed
absence of hidden bias due to unobserved confounders, thus supporting the positive treatment effect of fishing
activity.
In this regard; promotion of income diversification opportunities, awareness promotion on family planning and
in-depth investigation of household food security situation were suggested.
Keywords: Lake Ziway, Lake Langano, Food security, Energy intake, PSM, ATT, Ethiopia
1. INRODUCTION
Food is a basic necessity for the existence of man. Food in the appropriate quantities and quality is required for a
healthy and productive life (Ajibola, 2000). Food-insecure people are defined as those consuming less than the
nutritional target of roughly 2,100 calories per day per person (Rosen et al., 2012). Thus, food insecure occurs
when per capita food consumption for a country or income deciles fall short of the nutritional target of roughly
2,100 calories per person per day.
Johnson (1986) explained food security as the degree of accessibility to food, adequacy in quality and quantity,
to fulfill the dietary requirements of all household members during the whole year.
Though food security as a problem at the national level was first felt in Ethiopia in the 1960s, it only started
influencing policy in the 1980s, when food self-sufficiency became one of the objectives of the Ten-year
Perspective Plan (TYPP) in the early 1980s. This took place after the
1983/84 drought and famine, which claimed millions of lives (Alemu, et al, 2002). While efforts to ensure
adequate food supplies at the national level are laudable, these efforts on their own cannot ensure food

1
Journal of Economics and Sustainable Development
ISSN 2222-1700 (Paper) ISSN 2222-2855 (Online)
Vol.4, No.18, 2013

www.iiste.org

availability for households and individuals.
According to FAO (1999), employment in off-farm and non-farm activities is crucial for expansion of the
sources of farm households’ livelihoods. It minimizes the danger of food shortage during the time of
unanticipated crops failure through food purchases.
In many countries, a great chance of famishment for themselves and their families during periods of chronic or
transitory food insecurity has always been avoided and reduced to a great extent because of diversification of
sources of income that has been a strategy for survival for such a long time (Devereux 1993, Maxwell and
Frankenburger, 1992).
Ensuring access to food, not merely increasing food supplies, should be regarded as the major pillar of food
security. This assertion is borne out by empirical evidence that suggests that, even in times when countries
experience famine, food supplies have been generally available, even in regions where large numbers of people
died of starvation. The problem is that those who needed the food do not have the means to acquire it (Sen,
1986). Households diversify their incomes by selling firewood, working on farms as daily labourers, and selling
crafts (Haile, 2005).
To determine the impacts of fishing on household food security status, this study analysis data from household
survey conducted in four districts adjacent to Lake Ziway and Lake Langano in the 2011/12 agricultural
production season. The objective of the study were; to examine household socio-economic characteristics, to
determine household's food security status and to analyze the impact of fishing on household food security.
2. RESEARCH METHODOLOGY
2.1. Study Area
This study was conducted in the communities residing in four districts around Lake Ziway and Langano in the
Oromia national regional state, in Ethiopia. Lake Ziway and Lake Langano are found in the South- eastern
direction of Addis Ababa at a distance of 175km and 190 km, respectively. The two lakes are found in the Great
East African Rift Valley and located between 70 51’N to 80 57’N and 380 43’E to 380 57’E. Lake Ziway is
situated at altitude of 1636 meter above sea level having a water surface of 440km2 with a maximum depth of
8.95meters and average depth of 2.5meters. Lake Langano is situated at altitude of 1582 meters above sea level,
owning water surface of 241km2 with a maximum depth of 47.9meters and average depth of 17meter. The
annual fish potential of Lake Ziway and Langano is estimated at 2941tons and 1000tons, respectively.
Figure 1 shows the geographic location of the studied district in Ethiopia and the respective zones. We found
that fishing and non-fishing households were geographically mixed, which enhance the relevance of control
groups to evaluate the impact of fishing on household income.
0 0

0

4 4 0

0

L o c a t i o n M a p o f t h e s tu d y d i s tr i c t s

0 0

4 6 0

0 0

0

4 8 0

0 0

0

5 0 0

0 0

0

5 2 0

0 0

0

5 4 0

0 0

0

0 0

0

5 4 0

0 0

0

9 2 0 0 0 0

9 2 0 0 0 0

4 2 0

9 0 0 0 0 0

9 0 0 0 0 0

B ora

D ugd a
Ze w a y
D ug da

L o c a t i o n o f s t u d y d i s tr c ts i n E th io p i a

8 6 0 0 0 0

8 8 0 0 0 0
8 6 0 0 0 0

8 8 0 0 0 0

La ke
Z iw a y

A .T u lu J .
K o m b o lc h a

Eas t S hew a

L o c a t i o n o f s t u d y d i s tr i c t s i n Z o n e s
Ze w a y
D ug d a

A b ija t a
S h a la la k e

La k e
Z i wa y

A rs i
8 2 0 0 0 0

A b ij a t a
S h a la l a k e

A rs i
N e g e le

8 0 0 0 0 0

8 0 0 0 0 0

A rs i
N e g e le

W e st A rs i

8 2 0 0 0 0

L a n g an o
La k e

8 4 0 0 0 0

L a n g an o
L ak e

8 4 0 0 0 0

Bo ra

D ug da

A . T u lu J .
K o m b olch a

4 2 0

0 0

0

4 4 0

0 0

0

4 6 0

0 0

0

4 8 0

0 0

0

5 0 0

0 0

0

5 2 0

1 :1 0 0 0 0 0 0

Figure 1. Geographical location of the study area
The study area enjoys bi-modal rainfall. Belg1 rain usually commences in March & ends in April. Meher2 season
usually takes place from June-August is considered to be the long rainy season during which major crops like
cereals, pulses, oil crops and the like are cultivated. The average annual rainfall of the area ranges from 800mm
to 1100mm while the mean annual temperature varies between 11oc and 29 oc. The human population of the
study area is 770,799. Population density is 138persons per km2 with an average family size of 6.01.

1
2

Belg season represents the shorter rainy season usually from March-April in the study area.
Meher season represents the longer rainy season usually from June_August in the study area.

2
Journal of Economics and Sustainable Development
ISSN 2222-1700 (Paper) ISSN 2222-2855 (Online)
Vol.4, No.18, 2013

www.iiste.org

2.2. The data
The four districts adjacent to the two lakes were purposively selected to define the study population. In the
second stage, random sampling was used to select households from the respective district with whom detail
interview was carried out.
The data for the research was obtained from a survey of 344 farm households in the four districts of the three
zones that emphasis on 2011/2012 agricultural production season. The sampled households were further
decomposed into 179 fishing households and 165 non-fishing households.
The data for the research was obtained from a survey of 344 farm households in the four districts of the three
zones that emphasis on 2011/2012 agricultural production season. The sampled households were further
decomposed into 179 fishing households and 165 non-fishing households.
A structured questionnaire was used to interview the households. Data collected from the households includes
household general characteristics, fishing participation, asset holding, farmland holding, crops and livestock
production, sources of income, food consumption, availability of social infrastructure services, and other relevant
information.
2.3. Data analysis
The analytical tools used were descriptive statistics, food security index and econometric analysis. Descriptive
statistics employed statistical tools such as mean, frequency, percentage and the like to characterize households'
socio-economic situation.
2.4. Food security index
To measure household food security a food security index was constructed. This defines a minimum level of
nutrition necessary to maintain healthy living, the food security line, below which households are classified as
food insecure (Muhammad-Lawal and Omotesho,2008).
The nutrients content of both produced and purchased food items are used to estimate both calorie and protein
availability to the household. Hence, a daily recommended level of 2,100 calories per day per person (Rosen et
al., 2012) and 65gm of protein per capita per day (Muhammad-Lawal and Omotesho,2008) defines the food
security line.
Although definitions of food security and insecurity revolve mostly around “food”, the main player behind is
calorie and not protein, micro-nutrients, etc. This is due to the fact that analysis operates on the principle that
other needs are usually met when calorie intake is satisfactory (Maxwell and Smith, 1992). Accordingly, much
importance has been placed on food calorie consumption by different literatures. Hence, it is useful to look food
security measured as food calorie intake among the households.
The intensity of food insecurity may be measured in terms of levels of food intake. One option is to relate the
severity of food insecurity to how consumption falls below a threshold of 2,100 kcal per day (Asatiani, 2009),
with an indicator could be Energy intake measured in kilocalories.
The food security index can be expressed as below
A
(1)
Z
=
I

Where;
Z= Food security index
A= Household's daily per capita calorie or protein availability
I= Household's daily per capita calorie or protein requirement
For the purpose of this study, a household is defined as a group of people living together and eating from the
same pot.
2.5. The Propensity Score Matching Methods
Rural households involve in fishing, based on resource base, awareness, legal enforcement mechanism (both
observable and unobservable). Given these, simple comparisons of mean differences in food energy intake of
fishermen with non-fishing group are likely to give biased estimates of the impacts of fishing when observational
data are used. Hence, estimation of the impacts of fishing on food energy intake requires a solution to the
counterfactual question of how food energy consumption would have performed had the fishermen not been
involving in the fishing business. Hence, we used propensity score matching methods to overcome this and other
econometric problems and ensure robust results.
The propensity score is the probability of participation rather than nonparticipation of an individual in a
treatment group. In the treatment- effect literature, this predictor given observable variables is an important
intermediate step, even though ultimate interest lies in outcomes of that treatment (Cameron and Trivedi, 2009 ).
After estimating the propensity scores, the average treatment effect for the treated (ATT) can then be estimated.
Several matching methods have been developed to match treated with non-treated of similar propensity scores.
Asymptotically, all matching methods should yield the same results. However, in practice, there are tradeoffs in
terms of bias and efficiency with each method (Caliendo and Kopeinig, 2008).

3
Journal of Economics and Sustainable Development
ISSN 2222-1700 (Paper) ISSN 2222-2855 (Online)
Vol.4, No.18, 2013

www.iiste.org

The balancing test is normally required after matching to ascertain whether the differences in covariates between
the two groups in the matched sample have been eliminated, in which case the matched comparison group can be
considered as a plausible counterfactual (Lee, 2008).
After matching, there should be no systematic differences in the distribution of covariate between the treated and
control groups. As a result, the standardized mean difference, pseudo-R2 should be lower and the joint
significance of covariate should be rejected (Sianesi, 2004).
If there are unobserved variables that simultaneously affect the participation decision and the outcome variable, a
selection or hidden bias problem might arise, to which matching estimators are not robust. While we controlled
for many observable, we check the sensitivity of the estimated average participation effects to hidden bias, using
the Rosenbaum (2002) bounds sensitivity approach. The purpose is to investigate whether inferences about
treatment effects may be changed by unobserved variables.
Our main parameter of interest was the average treatment effect on the treated, which is given by:

ATT = Ε(Y 1 − Y 0 D = 1) = Ε(Y 1 D = 1) − Ε(Y 0 D = 1)

(1)

Where Y1 is the treated outcome, Y0 is the untreated outcome, D indicates treatment status and is equal to 1 if the
individual receives treatment and 0 otherwise.
The evaluation problem arises from the fact that the untreated outcome for a treated individual, E(Y0 | D =1),
can never be observed. Using the outcome for untreated individuals as an estimate of the counterfactual will
generate bias equal to:

b = Ε(Y 0 D = 1) − Ε(Y 0 D = 0)

(2)

If the selection is based on variables that are observable to the analyst, the problem of selection bias can be
solved by controlling for these variables in a regression analysis or the propensity score matching method.
However, if the selection is based on variables that are unknown to the analyst, other methods need to be
applied. In the impact analysis, treatment is largely based on household characteristics and asset holding that are
observable both to the community and to the analyst; we therefore applied propensity score matching in this
study.
The advantage of using propensity score matching, compared to regression analysis, is that it is a non-parametric
approach in which the functional relationship between the dependent and independent variables is not specified,
and in which no distributional assumptions are made for the outcome variable (Rosenbaum and Rubin 1983;
Heckman et al., 1998).
Accordingly, PSM relies heavily on two assumptions that formally can be written as:
Assumption 1 (conditional independence)
(3)
Y 0 ⊥ D / X
Where ⊥ indicates stochastic independence and X is a set of observable characteristics; and
Assumption 2 (common support)
(4)
Pr (D = 1 X ) < 1
Assumption 1 implies, conditional on a set of observed characteristics, the untreated outcome is independent of
treatment status, i.e., E(Y0 |D = 1) = E(Y0 | D = 0) . This implies that the untreated outcome can be used as an
unbiased estimation of the counterfactual outcome for the treated individuals, which solves the evaluation
problem described in the previous section.
Rosenbaum and Rubin (1983) were the first to show that matching on the probability of treatment p(x) =
Pr(D=1|X), referred to as the propensity score, is valid.
Assumption 2 implies no explanatory variable is allowed to perfectly predict treatment. In order to control for
time invariant unobserved heterogeneity, we followed the approach suggested by Heckman et al. (1997) and
used change in Y as the outcome variable.
When estimating the propensity score, it is important that the variables used to predict the probability of
participation into treatment are unaffected by treatment, i.e., they should be measured before a household involve
in the treatment. Given this analytical technique, the outcome variable for this study is defined as Food Energy
Intake in kilo calories of a household from food consumption in 2011/12 agricultural production season.
3. RESULTS AND DISCUSSION
3.1. Household classification based on food security index
To analyze food security status, the study has considered a total of 344 households. The composition of
household food consumption were examined during questionnaire administration at field level. In this regard,
attention were given to women members to obtain relevant information on meal service. Considering the total
available food to a household from own production and purchase, total food available during the year were
worked out based on food energy and protein composition of foods commonly used in Ethiopia. Given, the

4
Journal of Economics and Sustainable Development
ISSN 2222-1700 (Paper) ISSN 2222-2855 (Online)
Vol.4, No.18, 2013

www.iiste.org

equivalent male adult scale weights to determine adjusted household size household food requirement was
computed taking 2100kcal/AE/day as a threshold. Consequently, food security index was constructed based on
which household with food security index greater than one recognized as food secure and those with less than
one as food insecure. Accordingly, from 179 fishing households 45 percent were food secure and 55 percent
were food insecure. Likewise from 165 non-fishing households, 54percent were food secure and 46 percent were
food insecure. Household classification using food security index were presented in Table 1 below.
Table 1. Household classification using food security index
District
Adami Tulu Jido Arsi
Ziway
Household category Dugda
Kombolcha
Negelle
Dugda
Total
Percentage
Fishing
37
61
41
40
179
100
Food secure
19
29
18
14
80
45
Food insecure
18
32
23
26
99
55
Non-fishing
37
53
37
38
165
100
Food secure
20
27
20
22
89
54
76
46
Food insecure
17
26
17
16
Source: Computed from data of 2011/12 household survey
Based on the food security index, the total sample households of 344 were further decomposed to arrive at food
secure fishing households and food insecure non-fishing households for the subsequent analysis. Based on the
analysis result, 156 households were identified comprises of 51.3percent food secure fishing households and
48.7percent non-fishing households.
3.2. Socio-economic characteristics
As presented in Table 2 below, female comprises of 16.7percent and out of the female and male heads 11 and 69
are food secure, respectively. The food secure fishing household were relatively younger than the food insecure
non-fishing household with average age of 32.3 years. Age difference is statistically significant at 1% level.
Moreover, food secure fishing households have attained, relatively better education level than the food insecure
one with average of 2.9 and 1.8, respectively. The equality of mean wase rejected at 1% level. The mean
Tropical Livestock Unit (TLU) holding was 4.9. The average farmland holding appeared to be greater for food
insecure compared to food secured households, which is statistically significant at 1% level. Food insecure
households have better access to irrigation use indicating 1.7 hectares of land cultivation. Both food secure and
insecure households were equally accessing credit from formal sources indicating mean result of 0.5. Food
insecure households were found at a distant location from market compared to the food secured partners with
average distance of 3.8 and 0.8 kilometer, respectively, the difference is also statistically significant at 1% level.
Likewise, participation in Equib contribution showed significant difference with better involvement of food
secured fishing households, which is statistically significant at 1% level.
Table 2. Households socio-economic characteristics
Food
secure Food insecure nonCharacteristics
Total
t-value
fishing households fishing households
Gender of household head (1/0)
Male
69
61
130
Female
11
15
26
Age of household head in year
32.3
43.3
37.6
6.8***
Household family size (unadjusted)
5.9
6.1
2.4
1.2
Household family size (adjusted AE)
5.9
6.7
6.3
2.1**
Education level of household head
2.4
(grade)
2.9
1.8
-4.2***
Livestock holding (TLU)
4.3
5.5
4.9
1.5
Farmland holding (ha)
1.9
2.8
2.4
4.1***
Irrigation area (ha)
0.6
1.7
1.1
0.89
Access to formal finance (1/0)
0.5
0.5
0.5
0.29
Location from big market (km)
0.8
3.8
2.3
21.1***
Access to telephone service (1/0)
0.6
0.7
0.6
0.92
Participation in Equib contribution (1/0)
0.6
0.1
0.5
-3.8***
Household income in Birr
22,944.8
19,369.4
21,202.9 -1.15
Home improvement cost in Birr
2,329.0
2,244.7
2,287.9
-0.11
Remittance income to the hh in Birr
462.4
338.5
686.8
1.16
Grain stored in the preceding year in KG
32.5
121.6
99.8
1.15
*Significant at 10% level, ** significant at 5% level *** significant at 1% level
5
Journal of Economics and Sustainable Development
ISSN 2222-1700 (Paper) ISSN 2222-2855 (Online)
Vol.4, No.18, 2013

www.iiste.org

Source: Computed from data of 2011/12 household survey
3.3. Composition of household food consumption
According to the study result, household food consumption is dominated with cereals (100%) followed by fish
(80%). Cereals appear in every meal services. Pulses, vegetables and animal products were serving as an
ingredient to the major household meal constituting of cereals such as Maize, Teff, Wheat, Sorghum and Barley.
Almost 63% of the surveyed households were consuming root crops, while 25% were using fruits as
complementary to their major dish. Local drinks were comprises of coffee and homemade beer usually serve as
gap filler to overcome food shortage. In most of the cases, coffee drink were used to cover household meal
especially breakfast. Table 3 below shows response on composition of food consumed by the surveyed
households.
Table 3. Households food composition
Household
Food composition
Food secure
Food insecure
Total
Percentage
Cereals
80
76
156
100
Fish
80
45
125
80
Root crops
43
55
98
63
Vegetables
44
52
96
62
Pulses
72
63
135
87
Fruits
16
23
39
25
Animal products
12
37
49
31
Local drinks
42
34
76
49
Obs. 156
Source: Computed from data of 2011/12 household survey
3.4. Household food energy intake
Given the equivalent male adult scale weight, energy composition of foods commonly used in the study area, the
total available food to a given household per day was computed to know the food energy intake of average
household in kilo calorie. The result reflected, households commonly get food energy from own production and
through purchases in the proportion of 82% and 18%, respectively. The amount of available food to food secure
household was highest compared to the food insecure once, showing statistical significance of the mean. On the
contrary, the food energy requirement of food insecure household was beyond the food secure once indicating
more AE for the former, with mean difference inr energy required significant at 5% level.
Table 4. Average energy intake (kcal)
Food
insecure
non-fishing Food secure fishing
Indicator
households
households
Combined t-value
Available
food
9283
31234
20540
-8.5***
energy
Required
food
14145
12523
13314
2.03**
energy
**Significant at 5% level *** Significant at 1% level
Source: Computed from data of 2011/12 household survey
3.5. EMPRICAL RESULTS
This section examines the impact of fishing on food energy intake of average household based on the outcome of
the propensity score matching (PSM). In the first step, we employed the logit model to obtain the propensity
score. The purpose was not to identify particular relationships, but rather to maximize the predictive power of the
model. Matching was done on 11 covariates, which were found to generate best balance between the treated and
control group (fishing and non-fishing households). The covariates were used to generate propensity scores for
the non-fishing households living in the area, determining which would probably have participated had they had
interest in the activity. The Logit estimate of determinants of food energy intake of fishing households were
presented in the Table 5 below.

6
Journal of Economics and Sustainable Development
ISSN 2222-1700 (Paper) ISSN 2222-2855 (Online)
Vol.4, No.18, 2013

www.iiste.org

Table 5. Logit estimate of determinants of food security status
Covariates
Coefficient
P-value
Gender of household head (1/0)
-0.53
0.80
Household family size
-0.55
0.10*
Education level of household head (grade level)
1.20
0.02**
Livestock holding (TLU)
-0.73
0.03**
Farmland holding (ha)
0.08
0.92
Irrigation area (ha)
-0.30
0.78
Access to formal finance (1/0)
1.12
0.40
Access to market(km)
-5.30
0.00***
Access to telephone service (1/0)
-5.00
0.02**
Participation in Equib contribution (1/0)
8.90
0.02**
Home improvement cost in Birr
-0.001
0.30
Constant
11.50
0.02**
Number of obs =156
Food secure fishing HH=
80
Food insecure non-fishing HH= 76
Pseudo R2
=0.71
LR chi2(12) =158.10
*Significant at 10% level, ** significant at 5% level *** significant at 1% level
Source: Computed from data of 2011/12 household survey
Fishing and non-fishing households were matched using Kernel Based Matching (KBM) and Nearest Neighbor
Matching (NNM). To ensure maximum comparability of the two groups, the sample were restricted to the
common support region, defined as the values of propensity scores where both treated and control cases can be
found. As presented in Table 6 below, the unmatched sample failed to satisfy the balancing properties, in that
food secure fishing households were significantly different in several aspects from the food insecure non-fishing
households (Column 1). However, using KBM and NNM most (90%) of the covariates supported insignificant
difference among the two groups, showing good much. Hence, matched samples are adequate to perform an
impact analysis, whereas the unmatched samples are not.
Table 6. Balancing test of matched samples
2. Kernel
(KBM)

1. Unmatched samples

Covariates
Gender of household head (1/0)
Household family size
Education level of household head (grade)
Livestock holding (TLU)
Farmland holding (ha)
Irrigation area (ha)
Access to formal finance (1/0)
Access to market(km)
Access to telephone service (1/0)
Participation in Equib contribution (1/0)
Home improvement cost in ETB

based

Treatment
HH

Control
HH

Diff:
p-value

Treatment
HH

Control
HH

0.86
5.90
2.94
4.28
1.90
0.60
0.45
0.79
0.60
0.60
2,329.00

0.99
5.51
0.34
16.27
3.28
1.38
0.80
0.13
0.13
0.80
571.25

0.00***
0.15
0.00***
0.00***
0.00***
0.00***
0.00***
0.00***
0.00***
0.01***
0.00 ***

1.00
6.20
2.10
4.82
1.83
0.38
0.30
0.90
0.20
0.20
5,131.50

0.90
5.98
1.10
9.22
2.13
0.78
0.52
0.40
0.38
0.42
2,110.00

matching
Diff:
pvalue
0.33
0.81
0.23
0.22
0.63
0.25
0.35
0.05**
0.40
0.31
0.26

3. Nearest Neighbor Matching
NNM (4)
Treatment
HH

Control
HH

Diff:
p-value

1.00
6.20
2.10
4.82
1.83
0.38
0.30
0.90
0.20
0.20
5,131.50

0.90
6.05
1.10
7.83
1.85
0.66
0.45
0.40
0.45
0.35
2,110.00

0.33
0.87
0.23
0.38
0.97
0.41
0.51
0.05 **
0.26
0.48
0.26

*significant at 10% level, **significant at 5% level, ***significant at 1% level
Source: Computed from data of 2011/12 household survey
As presented in Table 7 below, low standardized bias, and the joint insignificant p-values of the likelihood ratio
tests suggested absence of systematic difference in the distribution of covariates between the groups after
matching. Thus, the result helped to evaluate fishing impacts on food energy intake of food secure and food
insecure with similar observed characteristics.
Table 7. Covariate balancing indicators before and after matching (food secured fishing household)
After matching
Indicators
Before matching
1. KBM
2. NNM (4)
Mean standardized difference (bias)
80.6
39
33.3
Pseudo R2
0.71
0.92
0.87

χ 2 P-value of LR

0.00***

**significant at 5% level, ****significant at 1% level
Note: NNM = nearest neighbor matching; KBM = kernel-based matching
Source: Computed from data of 2011/12 household survey

7

0.11

0.14
Journal of Economics and Sustainable Development
ISSN 2222-1700 (Paper) ISSN 2222-2855 (Online)
Vol.4, No.18, 2013

www.iiste.org

As indicated in Table 8 below, due to matching exercise the sub-sample comprises of 86 households using
KBM and NNM. These were observations whose propensity scores fall in the common support region.
Table 8. Number of observations within common support
Samples
KBM
NNM (4)
Food insecure non-fishing households
76
76
Food secure fishing households
10
10
Total
86
86
Note: NNM = nearest neighbor matching; KBM = kernel-based matching
Source: Computed from data of 2011/12 household survey
Consequently, the impact of fishing on food energy intake of the household were computed based on matched
sample, which was presented in Table 9. Using the Average Treatment Effect on the Treated (ATT) that
measures the average difference between food energy intake (kcal) of food secure fishing household and the
food insecure non-fishing household of the corresponding match, there appear to be statistically significant
difference of changes in income between the two. Thus, our findings confirmed that there were substantial
increment in average food energy intake of household's as a result of participation in the fishing activities.
Table 9. Estimation of average fishing impact using propensity score matching methods
KBM
NNM (4)
27375
27213
Average fishing impact (ATT)
10827**
10823**
Standard error
**Significant at 5% level
Source: Computed from data of 2011/12 household survey
The sensitivity of our finding to hidden biases were examined using the Rosenbaum bound approach, as
presented in Table 10 below. Accordingly, we can conclude that the estimates of the average fishing impacts
reported in Table 9 above were insensitive to hidden bias, thus the findings result were a reliable indicator of the
impact of fishing on household food energy intake.
Table 10. Sensitivity analysis
Wilcoxon Signed Rank
Hodges-Lehmann point estimate
Gamma
(Г)
sensitivity P-value
parameter
L. Bound P- U. Bound P- L. Bound HL U. Bound HL
Value
Value
Est.
Est.
1
0
0
16,094
16,094
1.5
0
0
13,732
19,086
2
0
0.0000009
12,377
22,025
2.5
0
0.000004
11,418
25,194
3
0
0.00002
10,748
27,578
Source: Computed from data of 2011/12 household survey
4. CONCLUSION
In this paper, we used descriptive analysis, food security index and propensity score matching to examine the
impacts of fishing on food security status of 156 households. We used cross sectional data of the 2011/12
agricultural production season.
Using an equivalent male adult scale weight, the average family size of food secure household and food insecure
household were 5.9AE and 6.7AE, respectively. The mean difference was significant at 5% level. Consequently,
the available food energy to food secured household was 31234kcal while it was 9283kcal to the food insecure
once. On the contrary, the required food energy was 14145kcal to food insecure households and 12523kcal to
the food secure fishing households, with mean difference significant at 5% level.
According to the study result, household food consumption were largely dependnet on cereal grain (100%),
pulses ingredient (87%), fish product (80%), root crops (63%) and vegetables (62%). Consumption of animal
products were reported by 31% of respondents indicating difficulty of getting such products. Animal products
were mostly sold rather than using for home consumption.
In the effort to analyze the impact of fishing on food security of households, this study has identified and
elaborated the potential self-selection biases that emerge from simple comparisons of food energy intake of food
secure fishing households with food insecure non-fishing counterparts. These biases have to do with the
attributes of the study area as well as the attributes of household themselves. Thus, the research has shown how
one might use the propensity score matching method to evaluate the impact of fishing. The matching was
undertaken between food secure fishing households and food insecure non-fishing partners, considering specific
household characteristics. This careful selection and matching process ensures a relatively unbiased estimate of

8
Journal of Economics and Sustainable Development
ISSN 2222-1700 (Paper) ISSN 2222-2855 (Online)
Vol.4, No.18, 2013

www.iiste.org

the true impacts of fishing on household food security.
Accordingly, the result of impact analysis verified the significance of fishing on food security of average
household using the matched samples. The stability of the matching result were tested using the Rosenbaum
Sensitivity test for presence of hidden bias. Hence, the finding has confirmed an absence of hidden bias due to
unobserved confounder that support the positive treatment effect of fishing activity.
Hence, based on the study results the following suggestions were drawn;
• Promote income diversification opportunities among household to bring more income improvement.
• Carryout massive awareness promotion on using family planning services to improve household food
security situation.
• Encourage in-depth investigation of household food security situation for better understanding and
realistic planning.
5.
1.
2.
3.
4.
5.
6.

7.

8.

9.

10.

11.
12.
13.

14.

15.
16.
17.
18.
19.

REFERENCES
Ajibola, O. (2000). Institutional Analysis of the National Food storage Programme. Research report 23
Development Policy Centre, Ibadan.
Alemu, ZG, Oosthuizen, LK & Van schalkwyk, HD. (2002). Agricultural development policies of Ethiopia
since 1957. South African Journal of Economic History, Volume 17, No. 1 & 2: 1:24.
Asatiani, S. (2009). Food Security Concept, Condition and Trends in Georgia. IBSU Scientific Journal, 3(2),
35-54. journal.ibsu.edu.ge/index
Devereux S. (1993). Goats Before Ploughs: Dilemmas of Household Response Sequencing during Food
Shortages. Institute for Development Studies Bulletin 24: 29-43.
Devereux, S. (1993). Goats Before Ploughs: Dilemmas of Household Response Sequencing during Food
Shortages”, Institute for Development Studies Bulletin, Volume 24 No. 4, pp. 52-59.
Elzak, R.M., Elbushra, A.A., Ahmed, S.E.H. and Mubarak, A.M. (2011). The role of livestock production
on food security in Sudan: Rural White Nile State. Online Journal of Animal and Feed Research . 1( 6):
439-443 . ISSN 2228-7701 . http://www.ojafr.ir
Food & Agricultural Organization (FAO). (2001). Crop and food supply assessment mission to Ethiopia.
FAO Global Information and Early Warning System on Food and Agriculture. World Food Program.Rome,
Italy.
Food and Agricultural Organization (FAO). (1998). Crop and food supply assessment mission to Ethiopia.
FAO Global Information and Early Warning System on Food and Agriculture. World Food Program. Rome,
Italy.
Food and Agricultural Organization (FAO). (1998). Crop and food supply assessment mission to Ethiopia.
FAO Global Information and Early Warning System on Food and Agriculture. World Food Program. Rome,
Italy.
Food and Agriculture Organization (FAO). (1999). North and South Gonder-Food Security Assessment in
Parts of the Tekeze River Watershed. United Nations Development Programme (UNDP), Emergencies Unit
for Ethiopia, Assessment Mission: May 26- June 7, 199, Addis Ababa, Ethiopia.
Haile, H.K., Alemu, Z.G. and Kudhlande G.(2005). Causes of household food insecurity in Koredegaga
peasant association, Oromiya Zone, Ethiopia. Working Paper.
Johnson, U. (1986), Nutrition, Household Food Security and Women: Experience from Tanzania, Dar es
Salaam, UNICEF.
Kayunze, K.A. and Salisali, B. (2006). “Organizations and Farmer’s Access to Agricultural Technologies
for Food Security: The Case of Meatu District in Tanzania, Journal of Management and Development
Dynamics, Volume. 18 No.1, pp. 46-66.
Maliwichi, L.L, Oni, S.A, and Obadire, O.S. (2012). An investigation into the factors affecting food
availability, choices and nutritional adequacy of smallholder farming households under irrigation and
dryland farming in Vhembe district of Limpopo, province, South Africa. Journal of Agricultural Research
Vol. 7(25), pp. 3653-3664. http//. http://www.academicjournals.org/AJAR.
Maxwell, S and M Smith. (1992). Household Food Security: A Conceptual Review. University of Sussex,
Institute of Development Studies. Mimeo, Brighton, UK. www.wudpeckerresearchjournals.org/
Maxwell, S. and Frankenberger, T. (1992). Household Food Security: Concepts, Indicators Measurements,
New York, UNICEF and IFAD Dan Strum Gardanni, Inc.
Mbukwa, J. (2013). A model for predicting food security status among households in developing countries.
International Journal of Development and Sustainability, Vol. 2 No. 2 (In Press). http://isdsnet.com
Ministry of Finance and Economic Development (MOFED). (2013). National Economic Accounts Statistics
of Ethiopia. Estimates of the 2010/11 base year Series (2003 Ethiopian Fiscal Year). Addis Ababa.
Muhammad-Lawal, A. and Omotesho, O.A. (2008). Cereals and Farming Households’ Food Security in

9
Journal of Economics and Sustainable Development
ISSN 2222-1700 (Paper) ISSN 2222-2855 (Online)
Vol.4, No.18, 2013

www.iiste.org

Kwara State, Nigeria. Agricultural Journal 3 (3): 235-240, ISSN: 1816-9155. Medwell Journals .
20. Najafi, B. (2003). “An Overview of Current Land Utilization Systems and Their Contribution to
Agricultural Productivity”. Report of APO Seminar on Impact of System on Agricultural Productivity.
Agricultural Productivity Organization (APO), Iran.
21. Paddy, F. (2003). Gender Differentials in Land Ownership and Their Impact on Household Food Security: A
Case Study of Masaka District, MA Dissertation, Uganda Press, Baltimore and London.
http://www.troz.unihohenheim.de
22. Rosegrant, M.W., Cline, S.A., Li, W. Sulser, T B. and Valmonte-Santos, R.A. (2005). Looking Ahead Long
Term Prospects for Africa’s Agricultural Development and Food Security. 2020 Discussion Paper 41,
International Food Policy Research Institute (IFPRI), Washington, DC.
23. Rosen, S., Meade, B., Shapouri, S., D'Souza, A., and Rada, N. (2012). International Food Security
Assessment, 2012-22. A Report from the Economic Research Service. United States Department of
Agriculture GFA-23. www.ers.usda.gov
24. Sen, A. (1986). Food, Economics, and Entitlements. Lloyd’s Bank Review. 160: 1-20.
25. Shiferaw, F., Kilmer, R.L, Gladwin, C. (2003). Determinants of food security in Southern Ethiopia: A
selected paper presented at the 2003 American Agricultural Economics Association Meetings in Montreal,
Canada.
26. United Nations Country Team (UN). (2011). Ethiopia United Nations Development Assistance Framework
2012 to 2015. United Nations Country Team. http://ethiopia.unfpa.org
27. Zerihun Nigussie and Getachew Alemayehu. (2012). Levels of household food insecurity in rural areas of
Guraghe zone, Southern Ethiopia. Vol. 2(1), pp. 008 - 014, Wudpecker Journal of Agricultural Research.

10
This academic article was published by The International Institute for Science,
Technology and Education (IISTE). The IISTE is a pioneer in the Open Access
Publishing service based in the U.S. and Europe. The aim of the institute is
Accelerating Global Knowledge Sharing.
More information about the publisher can be found in the IISTE’s homepage:
http://www.iiste.org
CALL FOR JOURNAL PAPERS
The IISTE is currently hosting more than 30 peer-reviewed academic journals and
collaborating with academic institutions around the world. There’s no deadline for
submission. Prospective authors of IISTE journals can find the submission
instruction on the following page: http://www.iiste.org/journals/
The IISTE
editorial team promises to the review and publish all the qualified submissions in a
fast manner. All the journals articles are available online to the readers all over the
world without financial, legal, or technical barriers other than those inseparable from
gaining access to the internet itself. Printed version of the journals is also available
upon request of readers and authors.
MORE RESOURCES
Book publication information: http://www.iiste.org/book/
Recent conferences: http://www.iiste.org/conference/
IISTE Knowledge Sharing Partners
EBSCO, Index Copernicus, Ulrich's Periodicals Directory, JournalTOCS, PKP Open
Archives Harvester, Bielefeld Academic Search Engine, Elektronische
Zeitschriftenbibliothek EZB, Open J-Gate, OCLC WorldCat, Universe Digtial
Library , NewJour, Google Scholar

Weitere ähnliche Inhalte

Was ist angesagt?

Geographical and temporal patterns of household food security in maize-growin...
Geographical and temporal patterns of household food security in maize-growin...Geographical and temporal patterns of household food security in maize-growin...
Geographical and temporal patterns of household food security in maize-growin...ILRI
 
Early-Life Undernourishment in Developing Countries: Prevalence, Impacts over...
Early-Life Undernourishment in Developing Countries: Prevalence, Impacts over...Early-Life Undernourishment in Developing Countries: Prevalence, Impacts over...
Early-Life Undernourishment in Developing Countries: Prevalence, Impacts over...Young Lives Oxford
 
Nutritional status of Girls through Anthropometric and Dietary Assessment
Nutritional status of Girls through Anthropometric and Dietary AssessmentNutritional status of Girls through Anthropometric and Dietary Assessment
Nutritional status of Girls through Anthropometric and Dietary Assessmentiosrjce
 
Hidden hunger among pre schoolers in matisi peri-urban location, tran-nzoia d...
Hidden hunger among pre schoolers in matisi peri-urban location, tran-nzoia d...Hidden hunger among pre schoolers in matisi peri-urban location, tran-nzoia d...
Hidden hunger among pre schoolers in matisi peri-urban location, tran-nzoia d...Alexander Decker
 
Changes in nutrition outcomes in Ethiopia, 2000-2016
Changes in nutrition outcomes in Ethiopia, 2000-2016Changes in nutrition outcomes in Ethiopia, 2000-2016
Changes in nutrition outcomes in Ethiopia, 2000-2016essp2
 
Malnutrition project proposal ( Increasing knowlege about importance of a bal...
Malnutrition project proposal ( Increasing knowlege about importance of a bal...Malnutrition project proposal ( Increasing knowlege about importance of a bal...
Malnutrition project proposal ( Increasing knowlege about importance of a bal...Oriba Dan Langoya
 
Association Between Bio-fortification and Child Nutrition Among Smallholder H...
Association Between Bio-fortification and Child Nutrition Among Smallholder H...Association Between Bio-fortification and Child Nutrition Among Smallholder H...
Association Between Bio-fortification and Child Nutrition Among Smallholder H...Premier Publishers
 
Influence of Mothers’ Participation in Intra-Household Decision Making on Nut...
Influence of Mothers’ Participation in Intra-Household Decision Making on Nut...Influence of Mothers’ Participation in Intra-Household Decision Making on Nut...
Influence of Mothers’ Participation in Intra-Household Decision Making on Nut...Hudu Zakaria
 
Prevalence of undernutrition and determinant factors among preschool children...
Prevalence of undernutrition and determinant factors among preschool children...Prevalence of undernutrition and determinant factors among preschool children...
Prevalence of undernutrition and determinant factors among preschool children...Alexander Decker
 
Linkage of agriculture nutrition education and income
Linkage of agriculture nutrition education and incomeLinkage of agriculture nutrition education and income
Linkage of agriculture nutrition education and incomesayednaim
 
International Journal of Humanities and Social Science Invention (IJHSSI)
International Journal of Humanities and Social Science Invention (IJHSSI)International Journal of Humanities and Social Science Invention (IJHSSI)
International Journal of Humanities and Social Science Invention (IJHSSI)inventionjournals
 
Nutritional status of boarding and non boarding children in selected schools ...
Nutritional status of boarding and non boarding children in selected schools ...Nutritional status of boarding and non boarding children in selected schools ...
Nutritional status of boarding and non boarding children in selected schools ...Alexander Decker
 
Number of meals consumed by the pre school age going children
Number of meals consumed by the pre school age going childrenNumber of meals consumed by the pre school age going children
Number of meals consumed by the pre school age going childrenAlexander Decker
 
Nutritional Knowledge and Practices of Pre-School Teachers in Homa Bay County
Nutritional Knowledge and Practices of Pre-School Teachers in Homa Bay CountyNutritional Knowledge and Practices of Pre-School Teachers in Homa Bay County
Nutritional Knowledge and Practices of Pre-School Teachers in Homa Bay Countypaperpublications3
 

Was ist angesagt? (20)

Geographical and temporal patterns of household food security in maize-growin...
Geographical and temporal patterns of household food security in maize-growin...Geographical and temporal patterns of household food security in maize-growin...
Geographical and temporal patterns of household food security in maize-growin...
 
Malabsorption
MalabsorptionMalabsorption
Malabsorption
 
Mal3
Mal3Mal3
Mal3
 
Early-Life Undernourishment in Developing Countries: Prevalence, Impacts over...
Early-Life Undernourishment in Developing Countries: Prevalence, Impacts over...Early-Life Undernourishment in Developing Countries: Prevalence, Impacts over...
Early-Life Undernourishment in Developing Countries: Prevalence, Impacts over...
 
Nutritional status of Girls through Anthropometric and Dietary Assessment
Nutritional status of Girls through Anthropometric and Dietary AssessmentNutritional status of Girls through Anthropometric and Dietary Assessment
Nutritional status of Girls through Anthropometric and Dietary Assessment
 
Hidden hunger among pre schoolers in matisi peri-urban location, tran-nzoia d...
Hidden hunger among pre schoolers in matisi peri-urban location, tran-nzoia d...Hidden hunger among pre schoolers in matisi peri-urban location, tran-nzoia d...
Hidden hunger among pre schoolers in matisi peri-urban location, tran-nzoia d...
 
Changes in nutrition outcomes in Ethiopia, 2000-2016
Changes in nutrition outcomes in Ethiopia, 2000-2016Changes in nutrition outcomes in Ethiopia, 2000-2016
Changes in nutrition outcomes in Ethiopia, 2000-2016
 
Food and Nutrition Security Dimensions, Indicators and Framework
Food and Nutrition Security Dimensions, Indicators and FrameworkFood and Nutrition Security Dimensions, Indicators and Framework
Food and Nutrition Security Dimensions, Indicators and Framework
 
Malnutrition project proposal ( Increasing knowlege about importance of a bal...
Malnutrition project proposal ( Increasing knowlege about importance of a bal...Malnutrition project proposal ( Increasing knowlege about importance of a bal...
Malnutrition project proposal ( Increasing knowlege about importance of a bal...
 
Association Between Bio-fortification and Child Nutrition Among Smallholder H...
Association Between Bio-fortification and Child Nutrition Among Smallholder H...Association Between Bio-fortification and Child Nutrition Among Smallholder H...
Association Between Bio-fortification and Child Nutrition Among Smallholder H...
 
Research proposal
Research proposalResearch proposal
Research proposal
 
Influence of Mothers’ Participation in Intra-Household Decision Making on Nut...
Influence of Mothers’ Participation in Intra-Household Decision Making on Nut...Influence of Mothers’ Participation in Intra-Household Decision Making on Nut...
Influence of Mothers’ Participation in Intra-Household Decision Making on Nut...
 
Prevalence of undernutrition and determinant factors among preschool children...
Prevalence of undernutrition and determinant factors among preschool children...Prevalence of undernutrition and determinant factors among preschool children...
Prevalence of undernutrition and determinant factors among preschool children...
 
Final wala kapishtone
Final wala kapishtoneFinal wala kapishtone
Final wala kapishtone
 
Linkage of agriculture nutrition education and income
Linkage of agriculture nutrition education and incomeLinkage of agriculture nutrition education and income
Linkage of agriculture nutrition education and income
 
International Journal of Humanities and Social Science Invention (IJHSSI)
International Journal of Humanities and Social Science Invention (IJHSSI)International Journal of Humanities and Social Science Invention (IJHSSI)
International Journal of Humanities and Social Science Invention (IJHSSI)
 
Nutritional status of boarding and non boarding children in selected schools ...
Nutritional status of boarding and non boarding children in selected schools ...Nutritional status of boarding and non boarding children in selected schools ...
Nutritional status of boarding and non boarding children in selected schools ...
 
Number of meals consumed by the pre school age going children
Number of meals consumed by the pre school age going childrenNumber of meals consumed by the pre school age going children
Number of meals consumed by the pre school age going children
 
Nutritional Knowledge and Practices of Pre-School Teachers in Homa Bay County
Nutritional Knowledge and Practices of Pre-School Teachers in Homa Bay CountyNutritional Knowledge and Practices of Pre-School Teachers in Homa Bay County
Nutritional Knowledge and Practices of Pre-School Teachers in Homa Bay County
 
Urban rural disparity
Urban rural disparityUrban rural disparity
Urban rural disparity
 

Ähnlich wie Analysis of the significance of fishing on food security status of

Effect of Yam-Based Production on Food Security Status of Farm Households in...
Effect of Yam-Based  Production on Food Security Status of Farm Households in...Effect of Yam-Based  Production on Food Security Status of Farm Households in...
Effect of Yam-Based Production on Food Security Status of Farm Households in...Agriculture Journal IJOEAR
 
Comparative analysis of fresh and smoked catfish marketing in ekiti and ondo ...
Comparative analysis of fresh and smoked catfish marketing in ekiti and ondo ...Comparative analysis of fresh and smoked catfish marketing in ekiti and ondo ...
Comparative analysis of fresh and smoked catfish marketing in ekiti and ondo ...Alexander Decker
 
Assessment of productive and reproductive performances of cross
Assessment of productive and reproductive performances of crossAssessment of productive and reproductive performances of cross
Assessment of productive and reproductive performances of crossAlexander Decker
 
Assessment of productive and reproductive performances of cross
Assessment of productive and reproductive performances of crossAssessment of productive and reproductive performances of cross
Assessment of productive and reproductive performances of crossAlexander Decker
 
Land use intensity and efficiency of food crops production in osun state of n...
Land use intensity and efficiency of food crops production in osun state of n...Land use intensity and efficiency of food crops production in osun state of n...
Land use intensity and efficiency of food crops production in osun state of n...Alexander Decker
 
The role of bushmeat in food security and nutrition
The role of bushmeat in food security and nutrition The role of bushmeat in food security and nutrition
The role of bushmeat in food security and nutrition CIFOR-ICRAF
 
Analysis of Rural Households Food Security Status in Dibatie District, Wester...
Analysis of Rural Households Food Security Status in Dibatie District, Wester...Analysis of Rural Households Food Security Status in Dibatie District, Wester...
Analysis of Rural Households Food Security Status in Dibatie District, Wester...Premier Publishers
 
Risk aversion among farmers of the national program for food security in imo ...
Risk aversion among farmers of the national program for food security in imo ...Risk aversion among farmers of the national program for food security in imo ...
Risk aversion among farmers of the national program for food security in imo ...Alexander Decker
 
Constraints of onion (alluim cepa.var.cepa l.) yield production and food pref...
Constraints of onion (alluim cepa.var.cepa l.) yield production and food pref...Constraints of onion (alluim cepa.var.cepa l.) yield production and food pref...
Constraints of onion (alluim cepa.var.cepa l.) yield production and food pref...Alexander Decker
 
Production challenges and socio economic impact of dairy goat farming amongst...
Production challenges and socio economic impact of dairy goat farming amongst...Production challenges and socio economic impact of dairy goat farming amongst...
Production challenges and socio economic impact of dairy goat farming amongst...Alexander Decker
 
economic analysis of fish farming Toyin
economic analysis of fish farming Toyin economic analysis of fish farming Toyin
economic analysis of fish farming Toyin Oladeinde Oluwakayode
 
Demand response for caborhydrate and food insecurity dynamics in imo state, n...
Demand response for caborhydrate and food insecurity dynamics in imo state, n...Demand response for caborhydrate and food insecurity dynamics in imo state, n...
Demand response for caborhydrate and food insecurity dynamics in imo state, n...Alexander Decker
 
The Limit of Chill Method as a Non-Lethal Deterrent in Mitigating Human Eleph...
The Limit of Chill Method as a Non-Lethal Deterrent in Mitigating Human Eleph...The Limit of Chill Method as a Non-Lethal Deterrent in Mitigating Human Eleph...
The Limit of Chill Method as a Non-Lethal Deterrent in Mitigating Human Eleph...inventionjournals
 
Catch Per Unit Effort (CPUE) of Bivalves in Northwestern Bohol, Philippines
Catch Per Unit Effort (CPUE) of Bivalves in Northwestern Bohol, PhilippinesCatch Per Unit Effort (CPUE) of Bivalves in Northwestern Bohol, Philippines
Catch Per Unit Effort (CPUE) of Bivalves in Northwestern Bohol, PhilippinesAI Publications
 
The Influence Of Socio-Economic Characteristics on Consumers’ Preference on F...
The Influence Of Socio-Economic Characteristics on Consumers’ Preference on F...The Influence Of Socio-Economic Characteristics on Consumers’ Preference on F...
The Influence Of Socio-Economic Characteristics on Consumers’ Preference on F...Agriculture Journal IJOEAR
 
The Roles of Women in Fish Processing Activities in Some Local Government Are...
The Roles of Women in Fish Processing Activities in Some Local Government Are...The Roles of Women in Fish Processing Activities in Some Local Government Are...
The Roles of Women in Fish Processing Activities in Some Local Government Are...BRNSS Publication Hub
 

Ähnlich wie Analysis of the significance of fishing on food security status of (20)

Effect of Yam-Based Production on Food Security Status of Farm Households in...
Effect of Yam-Based  Production on Food Security Status of Farm Households in...Effect of Yam-Based  Production on Food Security Status of Farm Households in...
Effect of Yam-Based Production on Food Security Status of Farm Households in...
 
Comparative analysis of fresh and smoked catfish marketing in ekiti and ondo ...
Comparative analysis of fresh and smoked catfish marketing in ekiti and ondo ...Comparative analysis of fresh and smoked catfish marketing in ekiti and ondo ...
Comparative analysis of fresh and smoked catfish marketing in ekiti and ondo ...
 
2
22
2
 
Assessment of productive and reproductive performances of cross
Assessment of productive and reproductive performances of crossAssessment of productive and reproductive performances of cross
Assessment of productive and reproductive performances of cross
 
Assessment of productive and reproductive performances of cross
Assessment of productive and reproductive performances of crossAssessment of productive and reproductive performances of cross
Assessment of productive and reproductive performances of cross
 
Land use intensity and efficiency of food crops production in osun state of n...
Land use intensity and efficiency of food crops production in osun state of n...Land use intensity and efficiency of food crops production in osun state of n...
Land use intensity and efficiency of food crops production in osun state of n...
 
G0145458
G0145458G0145458
G0145458
 
The role of bushmeat in food security and nutrition
The role of bushmeat in food security and nutrition The role of bushmeat in food security and nutrition
The role of bushmeat in food security and nutrition
 
Analysis of Rural Households Food Security Status in Dibatie District, Wester...
Analysis of Rural Households Food Security Status in Dibatie District, Wester...Analysis of Rural Households Food Security Status in Dibatie District, Wester...
Analysis of Rural Households Food Security Status in Dibatie District, Wester...
 
Risk aversion among farmers of the national program for food security in imo ...
Risk aversion among farmers of the national program for food security in imo ...Risk aversion among farmers of the national program for food security in imo ...
Risk aversion among farmers of the national program for food security in imo ...
 
Constraints of onion (alluim cepa.var.cepa l.) yield production and food pref...
Constraints of onion (alluim cepa.var.cepa l.) yield production and food pref...Constraints of onion (alluim cepa.var.cepa l.) yield production and food pref...
Constraints of onion (alluim cepa.var.cepa l.) yield production and food pref...
 
Constraints of onion (alluim cepa.var.cepa l.) yield production and food pref...
Constraints of onion (alluim cepa.var.cepa l.) yield production and food pref...Constraints of onion (alluim cepa.var.cepa l.) yield production and food pref...
Constraints of onion (alluim cepa.var.cepa l.) yield production and food pref...
 
Production challenges and socio economic impact of dairy goat farming amongst...
Production challenges and socio economic impact of dairy goat farming amongst...Production challenges and socio economic impact of dairy goat farming amongst...
Production challenges and socio economic impact of dairy goat farming amongst...
 
economic analysis of fish farming Toyin
economic analysis of fish farming Toyin economic analysis of fish farming Toyin
economic analysis of fish farming Toyin
 
Demand response for caborhydrate and food insecurity dynamics in imo state, n...
Demand response for caborhydrate and food insecurity dynamics in imo state, n...Demand response for caborhydrate and food insecurity dynamics in imo state, n...
Demand response for caborhydrate and food insecurity dynamics in imo state, n...
 
Lateef et al pdf
Lateef et al pdfLateef et al pdf
Lateef et al pdf
 
The Limit of Chill Method as a Non-Lethal Deterrent in Mitigating Human Eleph...
The Limit of Chill Method as a Non-Lethal Deterrent in Mitigating Human Eleph...The Limit of Chill Method as a Non-Lethal Deterrent in Mitigating Human Eleph...
The Limit of Chill Method as a Non-Lethal Deterrent in Mitigating Human Eleph...
 
Catch Per Unit Effort (CPUE) of Bivalves in Northwestern Bohol, Philippines
Catch Per Unit Effort (CPUE) of Bivalves in Northwestern Bohol, PhilippinesCatch Per Unit Effort (CPUE) of Bivalves in Northwestern Bohol, Philippines
Catch Per Unit Effort (CPUE) of Bivalves in Northwestern Bohol, Philippines
 
The Influence Of Socio-Economic Characteristics on Consumers’ Preference on F...
The Influence Of Socio-Economic Characteristics on Consumers’ Preference on F...The Influence Of Socio-Economic Characteristics on Consumers’ Preference on F...
The Influence Of Socio-Economic Characteristics on Consumers’ Preference on F...
 
The Roles of Women in Fish Processing Activities in Some Local Government Are...
The Roles of Women in Fish Processing Activities in Some Local Government Are...The Roles of Women in Fish Processing Activities in Some Local Government Are...
The Roles of Women in Fish Processing Activities in Some Local Government Are...
 

Mehr von Alexander Decker

Abnormalities of hormones and inflammatory cytokines in women affected with p...
Abnormalities of hormones and inflammatory cytokines in women affected with p...Abnormalities of hormones and inflammatory cytokines in women affected with p...
Abnormalities of hormones and inflammatory cytokines in women affected with p...Alexander Decker
 
A validation of the adverse childhood experiences scale in
A validation of the adverse childhood experiences scale inA validation of the adverse childhood experiences scale in
A validation of the adverse childhood experiences scale inAlexander Decker
 
A usability evaluation framework for b2 c e commerce websites
A usability evaluation framework for b2 c e commerce websitesA usability evaluation framework for b2 c e commerce websites
A usability evaluation framework for b2 c e commerce websitesAlexander Decker
 
A universal model for managing the marketing executives in nigerian banks
A universal model for managing the marketing executives in nigerian banksA universal model for managing the marketing executives in nigerian banks
A universal model for managing the marketing executives in nigerian banksAlexander Decker
 
A unique common fixed point theorems in generalized d
A unique common fixed point theorems in generalized dA unique common fixed point theorems in generalized d
A unique common fixed point theorems in generalized dAlexander Decker
 
A trends of salmonella and antibiotic resistance
A trends of salmonella and antibiotic resistanceA trends of salmonella and antibiotic resistance
A trends of salmonella and antibiotic resistanceAlexander Decker
 
A transformational generative approach towards understanding al-istifham
A transformational  generative approach towards understanding al-istifhamA transformational  generative approach towards understanding al-istifham
A transformational generative approach towards understanding al-istifhamAlexander Decker
 
A time series analysis of the determinants of savings in namibia
A time series analysis of the determinants of savings in namibiaA time series analysis of the determinants of savings in namibia
A time series analysis of the determinants of savings in namibiaAlexander Decker
 
A therapy for physical and mental fitness of school children
A therapy for physical and mental fitness of school childrenA therapy for physical and mental fitness of school children
A therapy for physical and mental fitness of school childrenAlexander Decker
 
A theory of efficiency for managing the marketing executives in nigerian banks
A theory of efficiency for managing the marketing executives in nigerian banksA theory of efficiency for managing the marketing executives in nigerian banks
A theory of efficiency for managing the marketing executives in nigerian banksAlexander Decker
 
A systematic evaluation of link budget for
A systematic evaluation of link budget forA systematic evaluation of link budget for
A systematic evaluation of link budget forAlexander Decker
 
A synthetic review of contraceptive supplies in punjab
A synthetic review of contraceptive supplies in punjabA synthetic review of contraceptive supplies in punjab
A synthetic review of contraceptive supplies in punjabAlexander Decker
 
A synthesis of taylor’s and fayol’s management approaches for managing market...
A synthesis of taylor’s and fayol’s management approaches for managing market...A synthesis of taylor’s and fayol’s management approaches for managing market...
A synthesis of taylor’s and fayol’s management approaches for managing market...Alexander Decker
 
A survey paper on sequence pattern mining with incremental
A survey paper on sequence pattern mining with incrementalA survey paper on sequence pattern mining with incremental
A survey paper on sequence pattern mining with incrementalAlexander Decker
 
A survey on live virtual machine migrations and its techniques
A survey on live virtual machine migrations and its techniquesA survey on live virtual machine migrations and its techniques
A survey on live virtual machine migrations and its techniquesAlexander Decker
 
A survey on data mining and analysis in hadoop and mongo db
A survey on data mining and analysis in hadoop and mongo dbA survey on data mining and analysis in hadoop and mongo db
A survey on data mining and analysis in hadoop and mongo dbAlexander Decker
 
A survey on challenges to the media cloud
A survey on challenges to the media cloudA survey on challenges to the media cloud
A survey on challenges to the media cloudAlexander Decker
 
A survey of provenance leveraged
A survey of provenance leveragedA survey of provenance leveraged
A survey of provenance leveragedAlexander Decker
 
A survey of private equity investments in kenya
A survey of private equity investments in kenyaA survey of private equity investments in kenya
A survey of private equity investments in kenyaAlexander Decker
 
A study to measures the financial health of
A study to measures the financial health ofA study to measures the financial health of
A study to measures the financial health ofAlexander Decker
 

Mehr von Alexander Decker (20)

Abnormalities of hormones and inflammatory cytokines in women affected with p...
Abnormalities of hormones and inflammatory cytokines in women affected with p...Abnormalities of hormones and inflammatory cytokines in women affected with p...
Abnormalities of hormones and inflammatory cytokines in women affected with p...
 
A validation of the adverse childhood experiences scale in
A validation of the adverse childhood experiences scale inA validation of the adverse childhood experiences scale in
A validation of the adverse childhood experiences scale in
 
A usability evaluation framework for b2 c e commerce websites
A usability evaluation framework for b2 c e commerce websitesA usability evaluation framework for b2 c e commerce websites
A usability evaluation framework for b2 c e commerce websites
 
A universal model for managing the marketing executives in nigerian banks
A universal model for managing the marketing executives in nigerian banksA universal model for managing the marketing executives in nigerian banks
A universal model for managing the marketing executives in nigerian banks
 
A unique common fixed point theorems in generalized d
A unique common fixed point theorems in generalized dA unique common fixed point theorems in generalized d
A unique common fixed point theorems in generalized d
 
A trends of salmonella and antibiotic resistance
A trends of salmonella and antibiotic resistanceA trends of salmonella and antibiotic resistance
A trends of salmonella and antibiotic resistance
 
A transformational generative approach towards understanding al-istifham
A transformational  generative approach towards understanding al-istifhamA transformational  generative approach towards understanding al-istifham
A transformational generative approach towards understanding al-istifham
 
A time series analysis of the determinants of savings in namibia
A time series analysis of the determinants of savings in namibiaA time series analysis of the determinants of savings in namibia
A time series analysis of the determinants of savings in namibia
 
A therapy for physical and mental fitness of school children
A therapy for physical and mental fitness of school childrenA therapy for physical and mental fitness of school children
A therapy for physical and mental fitness of school children
 
A theory of efficiency for managing the marketing executives in nigerian banks
A theory of efficiency for managing the marketing executives in nigerian banksA theory of efficiency for managing the marketing executives in nigerian banks
A theory of efficiency for managing the marketing executives in nigerian banks
 
A systematic evaluation of link budget for
A systematic evaluation of link budget forA systematic evaluation of link budget for
A systematic evaluation of link budget for
 
A synthetic review of contraceptive supplies in punjab
A synthetic review of contraceptive supplies in punjabA synthetic review of contraceptive supplies in punjab
A synthetic review of contraceptive supplies in punjab
 
A synthesis of taylor’s and fayol’s management approaches for managing market...
A synthesis of taylor’s and fayol’s management approaches for managing market...A synthesis of taylor’s and fayol’s management approaches for managing market...
A synthesis of taylor’s and fayol’s management approaches for managing market...
 
A survey paper on sequence pattern mining with incremental
A survey paper on sequence pattern mining with incrementalA survey paper on sequence pattern mining with incremental
A survey paper on sequence pattern mining with incremental
 
A survey on live virtual machine migrations and its techniques
A survey on live virtual machine migrations and its techniquesA survey on live virtual machine migrations and its techniques
A survey on live virtual machine migrations and its techniques
 
A survey on data mining and analysis in hadoop and mongo db
A survey on data mining and analysis in hadoop and mongo dbA survey on data mining and analysis in hadoop and mongo db
A survey on data mining and analysis in hadoop and mongo db
 
A survey on challenges to the media cloud
A survey on challenges to the media cloudA survey on challenges to the media cloud
A survey on challenges to the media cloud
 
A survey of provenance leveraged
A survey of provenance leveragedA survey of provenance leveraged
A survey of provenance leveraged
 
A survey of private equity investments in kenya
A survey of private equity investments in kenyaA survey of private equity investments in kenya
A survey of private equity investments in kenya
 
A study to measures the financial health of
A study to measures the financial health ofA study to measures the financial health of
A study to measures the financial health of
 

Kürzlich hochgeladen

Transcript: New from BookNet Canada for 2024: Loan Stars - Tech Forum 2024
Transcript: New from BookNet Canada for 2024: Loan Stars - Tech Forum 2024Transcript: New from BookNet Canada for 2024: Loan Stars - Tech Forum 2024
Transcript: New from BookNet Canada for 2024: Loan Stars - Tech Forum 2024BookNet Canada
 
Use of FIDO in the Payments and Identity Landscape: FIDO Paris Seminar.pptx
Use of FIDO in the Payments and Identity Landscape: FIDO Paris Seminar.pptxUse of FIDO in the Payments and Identity Landscape: FIDO Paris Seminar.pptx
Use of FIDO in the Payments and Identity Landscape: FIDO Paris Seminar.pptxLoriGlavin3
 
How to write a Business Continuity Plan
How to write a Business Continuity PlanHow to write a Business Continuity Plan
How to write a Business Continuity PlanDatabarracks
 
Take control of your SAP testing with UiPath Test Suite
Take control of your SAP testing with UiPath Test SuiteTake control of your SAP testing with UiPath Test Suite
Take control of your SAP testing with UiPath Test SuiteDianaGray10
 
SALESFORCE EDUCATION CLOUD | FEXLE SERVICES
SALESFORCE EDUCATION CLOUD | FEXLE SERVICESSALESFORCE EDUCATION CLOUD | FEXLE SERVICES
SALESFORCE EDUCATION CLOUD | FEXLE SERVICESmohitsingh558521
 
unit 4 immunoblotting technique complete.pptx
unit 4 immunoblotting technique complete.pptxunit 4 immunoblotting technique complete.pptx
unit 4 immunoblotting technique complete.pptxBkGupta21
 
New from BookNet Canada for 2024: BNC CataList - Tech Forum 2024
New from BookNet Canada for 2024: BNC CataList - Tech Forum 2024New from BookNet Canada for 2024: BNC CataList - Tech Forum 2024
New from BookNet Canada for 2024: BNC CataList - Tech Forum 2024BookNet Canada
 
A Deep Dive on Passkeys: FIDO Paris Seminar.pptx
A Deep Dive on Passkeys: FIDO Paris Seminar.pptxA Deep Dive on Passkeys: FIDO Paris Seminar.pptx
A Deep Dive on Passkeys: FIDO Paris Seminar.pptxLoriGlavin3
 
Anypoint Exchange: It’s Not Just a Repo!
Anypoint Exchange: It’s Not Just a Repo!Anypoint Exchange: It’s Not Just a Repo!
Anypoint Exchange: It’s Not Just a Repo!Manik S Magar
 
A Journey Into the Emotions of Software Developers
A Journey Into the Emotions of Software DevelopersA Journey Into the Emotions of Software Developers
A Journey Into the Emotions of Software DevelopersNicole Novielli
 
How AI, OpenAI, and ChatGPT impact business and software.
How AI, OpenAI, and ChatGPT impact business and software.How AI, OpenAI, and ChatGPT impact business and software.
How AI, OpenAI, and ChatGPT impact business and software.Curtis Poe
 
The Ultimate Guide to Choosing WordPress Pros and Cons
The Ultimate Guide to Choosing WordPress Pros and ConsThe Ultimate Guide to Choosing WordPress Pros and Cons
The Ultimate Guide to Choosing WordPress Pros and ConsPixlogix Infotech
 
What's New in Teams Calling, Meetings and Devices March 2024
What's New in Teams Calling, Meetings and Devices March 2024What's New in Teams Calling, Meetings and Devices March 2024
What's New in Teams Calling, Meetings and Devices March 2024Stephanie Beckett
 
Nell’iperspazio con Rocket: il Framework Web di Rust!
Nell’iperspazio con Rocket: il Framework Web di Rust!Nell’iperspazio con Rocket: il Framework Web di Rust!
Nell’iperspazio con Rocket: il Framework Web di Rust!Commit University
 
Passkey Providers and Enabling Portability: FIDO Paris Seminar.pptx
Passkey Providers and Enabling Portability: FIDO Paris Seminar.pptxPasskey Providers and Enabling Portability: FIDO Paris Seminar.pptx
Passkey Providers and Enabling Portability: FIDO Paris Seminar.pptxLoriGlavin3
 
Time Series Foundation Models - current state and future directions
Time Series Foundation Models - current state and future directionsTime Series Foundation Models - current state and future directions
Time Series Foundation Models - current state and future directionsNathaniel Shimoni
 
Gen AI in Business - Global Trends Report 2024.pdf
Gen AI in Business - Global Trends Report 2024.pdfGen AI in Business - Global Trends Report 2024.pdf
Gen AI in Business - Global Trends Report 2024.pdfAddepto
 
Developer Data Modeling Mistakes: From Postgres to NoSQL
Developer Data Modeling Mistakes: From Postgres to NoSQLDeveloper Data Modeling Mistakes: From Postgres to NoSQL
Developer Data Modeling Mistakes: From Postgres to NoSQLScyllaDB
 
WordPress Websites for Engineers: Elevate Your Brand
WordPress Websites for Engineers: Elevate Your BrandWordPress Websites for Engineers: Elevate Your Brand
WordPress Websites for Engineers: Elevate Your Brandgvaughan
 
Merck Moving Beyond Passwords: FIDO Paris Seminar.pptx
Merck Moving Beyond Passwords: FIDO Paris Seminar.pptxMerck Moving Beyond Passwords: FIDO Paris Seminar.pptx
Merck Moving Beyond Passwords: FIDO Paris Seminar.pptxLoriGlavin3
 

Kürzlich hochgeladen (20)

Transcript: New from BookNet Canada for 2024: Loan Stars - Tech Forum 2024
Transcript: New from BookNet Canada for 2024: Loan Stars - Tech Forum 2024Transcript: New from BookNet Canada for 2024: Loan Stars - Tech Forum 2024
Transcript: New from BookNet Canada for 2024: Loan Stars - Tech Forum 2024
 
Use of FIDO in the Payments and Identity Landscape: FIDO Paris Seminar.pptx
Use of FIDO in the Payments and Identity Landscape: FIDO Paris Seminar.pptxUse of FIDO in the Payments and Identity Landscape: FIDO Paris Seminar.pptx
Use of FIDO in the Payments and Identity Landscape: FIDO Paris Seminar.pptx
 
How to write a Business Continuity Plan
How to write a Business Continuity PlanHow to write a Business Continuity Plan
How to write a Business Continuity Plan
 
Take control of your SAP testing with UiPath Test Suite
Take control of your SAP testing with UiPath Test SuiteTake control of your SAP testing with UiPath Test Suite
Take control of your SAP testing with UiPath Test Suite
 
SALESFORCE EDUCATION CLOUD | FEXLE SERVICES
SALESFORCE EDUCATION CLOUD | FEXLE SERVICESSALESFORCE EDUCATION CLOUD | FEXLE SERVICES
SALESFORCE EDUCATION CLOUD | FEXLE SERVICES
 
unit 4 immunoblotting technique complete.pptx
unit 4 immunoblotting technique complete.pptxunit 4 immunoblotting technique complete.pptx
unit 4 immunoblotting technique complete.pptx
 
New from BookNet Canada for 2024: BNC CataList - Tech Forum 2024
New from BookNet Canada for 2024: BNC CataList - Tech Forum 2024New from BookNet Canada for 2024: BNC CataList - Tech Forum 2024
New from BookNet Canada for 2024: BNC CataList - Tech Forum 2024
 
A Deep Dive on Passkeys: FIDO Paris Seminar.pptx
A Deep Dive on Passkeys: FIDO Paris Seminar.pptxA Deep Dive on Passkeys: FIDO Paris Seminar.pptx
A Deep Dive on Passkeys: FIDO Paris Seminar.pptx
 
Anypoint Exchange: It’s Not Just a Repo!
Anypoint Exchange: It’s Not Just a Repo!Anypoint Exchange: It’s Not Just a Repo!
Anypoint Exchange: It’s Not Just a Repo!
 
A Journey Into the Emotions of Software Developers
A Journey Into the Emotions of Software DevelopersA Journey Into the Emotions of Software Developers
A Journey Into the Emotions of Software Developers
 
How AI, OpenAI, and ChatGPT impact business and software.
How AI, OpenAI, and ChatGPT impact business and software.How AI, OpenAI, and ChatGPT impact business and software.
How AI, OpenAI, and ChatGPT impact business and software.
 
The Ultimate Guide to Choosing WordPress Pros and Cons
The Ultimate Guide to Choosing WordPress Pros and ConsThe Ultimate Guide to Choosing WordPress Pros and Cons
The Ultimate Guide to Choosing WordPress Pros and Cons
 
What's New in Teams Calling, Meetings and Devices March 2024
What's New in Teams Calling, Meetings and Devices March 2024What's New in Teams Calling, Meetings and Devices March 2024
What's New in Teams Calling, Meetings and Devices March 2024
 
Nell’iperspazio con Rocket: il Framework Web di Rust!
Nell’iperspazio con Rocket: il Framework Web di Rust!Nell’iperspazio con Rocket: il Framework Web di Rust!
Nell’iperspazio con Rocket: il Framework Web di Rust!
 
Passkey Providers and Enabling Portability: FIDO Paris Seminar.pptx
Passkey Providers and Enabling Portability: FIDO Paris Seminar.pptxPasskey Providers and Enabling Portability: FIDO Paris Seminar.pptx
Passkey Providers and Enabling Portability: FIDO Paris Seminar.pptx
 
Time Series Foundation Models - current state and future directions
Time Series Foundation Models - current state and future directionsTime Series Foundation Models - current state and future directions
Time Series Foundation Models - current state and future directions
 
Gen AI in Business - Global Trends Report 2024.pdf
Gen AI in Business - Global Trends Report 2024.pdfGen AI in Business - Global Trends Report 2024.pdf
Gen AI in Business - Global Trends Report 2024.pdf
 
Developer Data Modeling Mistakes: From Postgres to NoSQL
Developer Data Modeling Mistakes: From Postgres to NoSQLDeveloper Data Modeling Mistakes: From Postgres to NoSQL
Developer Data Modeling Mistakes: From Postgres to NoSQL
 
WordPress Websites for Engineers: Elevate Your Brand
WordPress Websites for Engineers: Elevate Your BrandWordPress Websites for Engineers: Elevate Your Brand
WordPress Websites for Engineers: Elevate Your Brand
 
Merck Moving Beyond Passwords: FIDO Paris Seminar.pptx
Merck Moving Beyond Passwords: FIDO Paris Seminar.pptxMerck Moving Beyond Passwords: FIDO Paris Seminar.pptx
Merck Moving Beyond Passwords: FIDO Paris Seminar.pptx
 

Analysis of the significance of fishing on food security status of

  • 1. Journal of Economics and Sustainable Development ISSN 2222-1700 (Paper) ISSN 2222-2855 (Online) Vol.4, No.18, 2013 www.iiste.org Analysis of the Significance of Fishing on Food Security Status of Rural Households Around Lake Ziway and Langano in Ethiopia Dawit Garoma1*, Asefa Admassie2, Gezahegn Ayele3 and Fekadu Beyene1 1. Collage of Agriculture, School of Agricultural Economics and Agricultural Business, Haramaya University Dire Dawa, Ethiopia 2. Principal Researcher IFPRI, Ethiopian Economics Association, Addis Ababa, Ethiopia; 3. Capacity building, USAID, Addis Ababa, Ethiopia; *e-mail of corresponding author: dgaromaa@yahoo.com Abstract This research work was conducted to investigate the significance of fishing on food security status of rural households around Lake Ziway and Langano in Ethiopia. The studied districts were selected using purposive sampling, as they are adjacent to the two lakes. Simple random sampling was employed to select 344 rural households for primary data collection. For this particular work, respondents were further classified into food secured fishing households and food insecure non-fishing households by employing food security index method. As a result, 156 households were identified constituting of 51.3% food secure fishing households and 48.7% food insecure non-fishing households. The range of data collected were comprises of household socio-economic characteristics, food production, food consumption, food purchases, fish income, non-fish income, and the like. Data analysis were made using descriptive statistics, food security index and the propensity score matching. Descriptive statistics examines distribution and socioeconomic characteristics of respondents using frequency distribution tables. Considering, the equivalent male adult scale and energy composition of foods commonly consumed by average household, the food security index was computed. Accordingly, the available food energy was 31234kcal and 9283kcal for the food secure fishing household and food insecure non-fishing household, respectively. On the contrary, the required food energy was greater for the food insecure household as compared to the food secure once, indicating 14145kcal and 12523kcal, respectively. The mean difference were significant at 5% level. To examine the impact of fishing on food security status of rural household we employed the propensity score matching method. This has been used to balance the observed distribution of covariate across the food secured fishing and food insecure non-fishing household. Balancing test was made after matching that ascertained absence of significant differences in covariate between fishing and non-fishing households in the matched sample. Thus, the matched comparison groups were considered to be a plausible counterfactual. Accordingly, the result of impact analysis verified the significance of fishing on food energy intake of average household using the matched samples. In this regards, food secured fishing household was able to obtain extra energy from food consumption as compared to the non-fishing food insecure counterpart indicating ATT of 27375 kcal and 27213 kcal using KBM and NNM algorithms, respectively. The results were statistically significant at 5% level. Consequently, the stability of the findings were tested using Rosenbaum bounds approach that confirmed absence of hidden bias due to unobserved confounders, thus supporting the positive treatment effect of fishing activity. In this regard; promotion of income diversification opportunities, awareness promotion on family planning and in-depth investigation of household food security situation were suggested. Keywords: Lake Ziway, Lake Langano, Food security, Energy intake, PSM, ATT, Ethiopia 1. INRODUCTION Food is a basic necessity for the existence of man. Food in the appropriate quantities and quality is required for a healthy and productive life (Ajibola, 2000). Food-insecure people are defined as those consuming less than the nutritional target of roughly 2,100 calories per day per person (Rosen et al., 2012). Thus, food insecure occurs when per capita food consumption for a country or income deciles fall short of the nutritional target of roughly 2,100 calories per person per day. Johnson (1986) explained food security as the degree of accessibility to food, adequacy in quality and quantity, to fulfill the dietary requirements of all household members during the whole year. Though food security as a problem at the national level was first felt in Ethiopia in the 1960s, it only started influencing policy in the 1980s, when food self-sufficiency became one of the objectives of the Ten-year Perspective Plan (TYPP) in the early 1980s. This took place after the 1983/84 drought and famine, which claimed millions of lives (Alemu, et al, 2002). While efforts to ensure adequate food supplies at the national level are laudable, these efforts on their own cannot ensure food 1
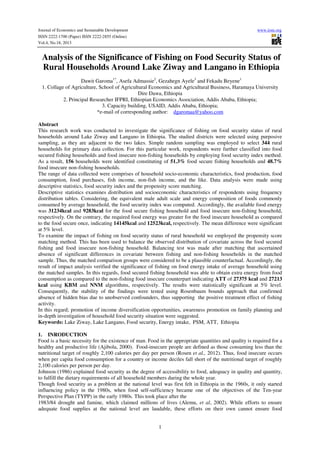
  • 2. Journal of Economics and Sustainable Development ISSN 2222-1700 (Paper) ISSN 2222-2855 (Online) Vol.4, No.18, 2013 www.iiste.org availability for households and individuals. According to FAO (1999), employment in off-farm and non-farm activities is crucial for expansion of the sources of farm households’ livelihoods. It minimizes the danger of food shortage during the time of unanticipated crops failure through food purchases. In many countries, a great chance of famishment for themselves and their families during periods of chronic or transitory food insecurity has always been avoided and reduced to a great extent because of diversification of sources of income that has been a strategy for survival for such a long time (Devereux 1993, Maxwell and Frankenburger, 1992). Ensuring access to food, not merely increasing food supplies, should be regarded as the major pillar of food security. This assertion is borne out by empirical evidence that suggests that, even in times when countries experience famine, food supplies have been generally available, even in regions where large numbers of people died of starvation. The problem is that those who needed the food do not have the means to acquire it (Sen, 1986). Households diversify their incomes by selling firewood, working on farms as daily labourers, and selling crafts (Haile, 2005). To determine the impacts of fishing on household food security status, this study analysis data from household survey conducted in four districts adjacent to Lake Ziway and Lake Langano in the 2011/12 agricultural production season. The objective of the study were; to examine household socio-economic characteristics, to determine household's food security status and to analyze the impact of fishing on household food security. 2. RESEARCH METHODOLOGY 2.1. Study Area This study was conducted in the communities residing in four districts around Lake Ziway and Langano in the Oromia national regional state, in Ethiopia. Lake Ziway and Lake Langano are found in the South- eastern direction of Addis Ababa at a distance of 175km and 190 km, respectively. The two lakes are found in the Great East African Rift Valley and located between 70 51’N to 80 57’N and 380 43’E to 380 57’E. Lake Ziway is situated at altitude of 1636 meter above sea level having a water surface of 440km2 with a maximum depth of 8.95meters and average depth of 2.5meters. Lake Langano is situated at altitude of 1582 meters above sea level, owning water surface of 241km2 with a maximum depth of 47.9meters and average depth of 17meter. The annual fish potential of Lake Ziway and Langano is estimated at 2941tons and 1000tons, respectively. Figure 1 shows the geographic location of the studied district in Ethiopia and the respective zones. We found that fishing and non-fishing households were geographically mixed, which enhance the relevance of control groups to evaluate the impact of fishing on household income. 0 0 0 4 4 0 0 L o c a t i o n M a p o f t h e s tu d y d i s tr i c t s 0 0 4 6 0 0 0 0 4 8 0 0 0 0 5 0 0 0 0 0 5 2 0 0 0 0 5 4 0 0 0 0 0 0 0 5 4 0 0 0 0 9 2 0 0 0 0 9 2 0 0 0 0 4 2 0 9 0 0 0 0 0 9 0 0 0 0 0 B ora D ugd a Ze w a y D ug da L o c a t i o n o f s t u d y d i s tr c ts i n E th io p i a 8 6 0 0 0 0 8 8 0 0 0 0 8 6 0 0 0 0 8 8 0 0 0 0 La ke Z iw a y A .T u lu J . K o m b o lc h a Eas t S hew a L o c a t i o n o f s t u d y d i s tr i c t s i n Z o n e s Ze w a y D ug d a A b ija t a S h a la la k e La k e Z i wa y A rs i 8 2 0 0 0 0 A b ij a t a S h a la l a k e A rs i N e g e le 8 0 0 0 0 0 8 0 0 0 0 0 A rs i N e g e le W e st A rs i 8 2 0 0 0 0 L a n g an o La k e 8 4 0 0 0 0 L a n g an o L ak e 8 4 0 0 0 0 Bo ra D ug da A . T u lu J . K o m b olch a 4 2 0 0 0 0 4 4 0 0 0 0 4 6 0 0 0 0 4 8 0 0 0 0 5 0 0 0 0 0 5 2 0 1 :1 0 0 0 0 0 0 Figure 1. Geographical location of the study area The study area enjoys bi-modal rainfall. Belg1 rain usually commences in March & ends in April. Meher2 season usually takes place from June-August is considered to be the long rainy season during which major crops like cereals, pulses, oil crops and the like are cultivated. The average annual rainfall of the area ranges from 800mm to 1100mm while the mean annual temperature varies between 11oc and 29 oc. The human population of the study area is 770,799. Population density is 138persons per km2 with an average family size of 6.01. 1 2 Belg season represents the shorter rainy season usually from March-April in the study area. Meher season represents the longer rainy season usually from June_August in the study area. 2
  • 3. Journal of Economics and Sustainable Development ISSN 2222-1700 (Paper) ISSN 2222-2855 (Online) Vol.4, No.18, 2013 www.iiste.org 2.2. The data The four districts adjacent to the two lakes were purposively selected to define the study population. In the second stage, random sampling was used to select households from the respective district with whom detail interview was carried out. The data for the research was obtained from a survey of 344 farm households in the four districts of the three zones that emphasis on 2011/2012 agricultural production season. The sampled households were further decomposed into 179 fishing households and 165 non-fishing households. The data for the research was obtained from a survey of 344 farm households in the four districts of the three zones that emphasis on 2011/2012 agricultural production season. The sampled households were further decomposed into 179 fishing households and 165 non-fishing households. A structured questionnaire was used to interview the households. Data collected from the households includes household general characteristics, fishing participation, asset holding, farmland holding, crops and livestock production, sources of income, food consumption, availability of social infrastructure services, and other relevant information. 2.3. Data analysis The analytical tools used were descriptive statistics, food security index and econometric analysis. Descriptive statistics employed statistical tools such as mean, frequency, percentage and the like to characterize households' socio-economic situation. 2.4. Food security index To measure household food security a food security index was constructed. This defines a minimum level of nutrition necessary to maintain healthy living, the food security line, below which households are classified as food insecure (Muhammad-Lawal and Omotesho,2008). The nutrients content of both produced and purchased food items are used to estimate both calorie and protein availability to the household. Hence, a daily recommended level of 2,100 calories per day per person (Rosen et al., 2012) and 65gm of protein per capita per day (Muhammad-Lawal and Omotesho,2008) defines the food security line. Although definitions of food security and insecurity revolve mostly around “food”, the main player behind is calorie and not protein, micro-nutrients, etc. This is due to the fact that analysis operates on the principle that other needs are usually met when calorie intake is satisfactory (Maxwell and Smith, 1992). Accordingly, much importance has been placed on food calorie consumption by different literatures. Hence, it is useful to look food security measured as food calorie intake among the households. The intensity of food insecurity may be measured in terms of levels of food intake. One option is to relate the severity of food insecurity to how consumption falls below a threshold of 2,100 kcal per day (Asatiani, 2009), with an indicator could be Energy intake measured in kilocalories. The food security index can be expressed as below A (1) Z = I Where; Z= Food security index A= Household's daily per capita calorie or protein availability I= Household's daily per capita calorie or protein requirement For the purpose of this study, a household is defined as a group of people living together and eating from the same pot. 2.5. The Propensity Score Matching Methods Rural households involve in fishing, based on resource base, awareness, legal enforcement mechanism (both observable and unobservable). Given these, simple comparisons of mean differences in food energy intake of fishermen with non-fishing group are likely to give biased estimates of the impacts of fishing when observational data are used. Hence, estimation of the impacts of fishing on food energy intake requires a solution to the counterfactual question of how food energy consumption would have performed had the fishermen not been involving in the fishing business. Hence, we used propensity score matching methods to overcome this and other econometric problems and ensure robust results. The propensity score is the probability of participation rather than nonparticipation of an individual in a treatment group. In the treatment- effect literature, this predictor given observable variables is an important intermediate step, even though ultimate interest lies in outcomes of that treatment (Cameron and Trivedi, 2009 ). After estimating the propensity scores, the average treatment effect for the treated (ATT) can then be estimated. Several matching methods have been developed to match treated with non-treated of similar propensity scores. Asymptotically, all matching methods should yield the same results. However, in practice, there are tradeoffs in terms of bias and efficiency with each method (Caliendo and Kopeinig, 2008). 3
  • 4. Journal of Economics and Sustainable Development ISSN 2222-1700 (Paper) ISSN 2222-2855 (Online) Vol.4, No.18, 2013 www.iiste.org The balancing test is normally required after matching to ascertain whether the differences in covariates between the two groups in the matched sample have been eliminated, in which case the matched comparison group can be considered as a plausible counterfactual (Lee, 2008). After matching, there should be no systematic differences in the distribution of covariate between the treated and control groups. As a result, the standardized mean difference, pseudo-R2 should be lower and the joint significance of covariate should be rejected (Sianesi, 2004). If there are unobserved variables that simultaneously affect the participation decision and the outcome variable, a selection or hidden bias problem might arise, to which matching estimators are not robust. While we controlled for many observable, we check the sensitivity of the estimated average participation effects to hidden bias, using the Rosenbaum (2002) bounds sensitivity approach. The purpose is to investigate whether inferences about treatment effects may be changed by unobserved variables. Our main parameter of interest was the average treatment effect on the treated, which is given by: ATT = Ε(Y 1 − Y 0 D = 1) = Ε(Y 1 D = 1) − Ε(Y 0 D = 1) (1) Where Y1 is the treated outcome, Y0 is the untreated outcome, D indicates treatment status and is equal to 1 if the individual receives treatment and 0 otherwise. The evaluation problem arises from the fact that the untreated outcome for a treated individual, E(Y0 | D =1), can never be observed. Using the outcome for untreated individuals as an estimate of the counterfactual will generate bias equal to: b = Ε(Y 0 D = 1) − Ε(Y 0 D = 0) (2) If the selection is based on variables that are observable to the analyst, the problem of selection bias can be solved by controlling for these variables in a regression analysis or the propensity score matching method. However, if the selection is based on variables that are unknown to the analyst, other methods need to be applied. In the impact analysis, treatment is largely based on household characteristics and asset holding that are observable both to the community and to the analyst; we therefore applied propensity score matching in this study. The advantage of using propensity score matching, compared to regression analysis, is that it is a non-parametric approach in which the functional relationship between the dependent and independent variables is not specified, and in which no distributional assumptions are made for the outcome variable (Rosenbaum and Rubin 1983; Heckman et al., 1998). Accordingly, PSM relies heavily on two assumptions that formally can be written as: Assumption 1 (conditional independence) (3) Y 0 ⊥ D / X Where ⊥ indicates stochastic independence and X is a set of observable characteristics; and Assumption 2 (common support) (4) Pr (D = 1 X ) < 1 Assumption 1 implies, conditional on a set of observed characteristics, the untreated outcome is independent of treatment status, i.e., E(Y0 |D = 1) = E(Y0 | D = 0) . This implies that the untreated outcome can be used as an unbiased estimation of the counterfactual outcome for the treated individuals, which solves the evaluation problem described in the previous section. Rosenbaum and Rubin (1983) were the first to show that matching on the probability of treatment p(x) = Pr(D=1|X), referred to as the propensity score, is valid. Assumption 2 implies no explanatory variable is allowed to perfectly predict treatment. In order to control for time invariant unobserved heterogeneity, we followed the approach suggested by Heckman et al. (1997) and used change in Y as the outcome variable. When estimating the propensity score, it is important that the variables used to predict the probability of participation into treatment are unaffected by treatment, i.e., they should be measured before a household involve in the treatment. Given this analytical technique, the outcome variable for this study is defined as Food Energy Intake in kilo calories of a household from food consumption in 2011/12 agricultural production season. 3. RESULTS AND DISCUSSION 3.1. Household classification based on food security index To analyze food security status, the study has considered a total of 344 households. The composition of household food consumption were examined during questionnaire administration at field level. In this regard, attention were given to women members to obtain relevant information on meal service. Considering the total available food to a household from own production and purchase, total food available during the year were worked out based on food energy and protein composition of foods commonly used in Ethiopia. Given, the 4
  • 5. Journal of Economics and Sustainable Development ISSN 2222-1700 (Paper) ISSN 2222-2855 (Online) Vol.4, No.18, 2013 www.iiste.org equivalent male adult scale weights to determine adjusted household size household food requirement was computed taking 2100kcal/AE/day as a threshold. Consequently, food security index was constructed based on which household with food security index greater than one recognized as food secure and those with less than one as food insecure. Accordingly, from 179 fishing households 45 percent were food secure and 55 percent were food insecure. Likewise from 165 non-fishing households, 54percent were food secure and 46 percent were food insecure. Household classification using food security index were presented in Table 1 below. Table 1. Household classification using food security index District Adami Tulu Jido Arsi Ziway Household category Dugda Kombolcha Negelle Dugda Total Percentage Fishing 37 61 41 40 179 100 Food secure 19 29 18 14 80 45 Food insecure 18 32 23 26 99 55 Non-fishing 37 53 37 38 165 100 Food secure 20 27 20 22 89 54 76 46 Food insecure 17 26 17 16 Source: Computed from data of 2011/12 household survey Based on the food security index, the total sample households of 344 were further decomposed to arrive at food secure fishing households and food insecure non-fishing households for the subsequent analysis. Based on the analysis result, 156 households were identified comprises of 51.3percent food secure fishing households and 48.7percent non-fishing households. 3.2. Socio-economic characteristics As presented in Table 2 below, female comprises of 16.7percent and out of the female and male heads 11 and 69 are food secure, respectively. The food secure fishing household were relatively younger than the food insecure non-fishing household with average age of 32.3 years. Age difference is statistically significant at 1% level. Moreover, food secure fishing households have attained, relatively better education level than the food insecure one with average of 2.9 and 1.8, respectively. The equality of mean wase rejected at 1% level. The mean Tropical Livestock Unit (TLU) holding was 4.9. The average farmland holding appeared to be greater for food insecure compared to food secured households, which is statistically significant at 1% level. Food insecure households have better access to irrigation use indicating 1.7 hectares of land cultivation. Both food secure and insecure households were equally accessing credit from formal sources indicating mean result of 0.5. Food insecure households were found at a distant location from market compared to the food secured partners with average distance of 3.8 and 0.8 kilometer, respectively, the difference is also statistically significant at 1% level. Likewise, participation in Equib contribution showed significant difference with better involvement of food secured fishing households, which is statistically significant at 1% level. Table 2. Households socio-economic characteristics Food secure Food insecure nonCharacteristics Total t-value fishing households fishing households Gender of household head (1/0) Male 69 61 130 Female 11 15 26 Age of household head in year 32.3 43.3 37.6 6.8*** Household family size (unadjusted) 5.9 6.1 2.4 1.2 Household family size (adjusted AE) 5.9 6.7 6.3 2.1** Education level of household head 2.4 (grade) 2.9 1.8 -4.2*** Livestock holding (TLU) 4.3 5.5 4.9 1.5 Farmland holding (ha) 1.9 2.8 2.4 4.1*** Irrigation area (ha) 0.6 1.7 1.1 0.89 Access to formal finance (1/0) 0.5 0.5 0.5 0.29 Location from big market (km) 0.8 3.8 2.3 21.1*** Access to telephone service (1/0) 0.6 0.7 0.6 0.92 Participation in Equib contribution (1/0) 0.6 0.1 0.5 -3.8*** Household income in Birr 22,944.8 19,369.4 21,202.9 -1.15 Home improvement cost in Birr 2,329.0 2,244.7 2,287.9 -0.11 Remittance income to the hh in Birr 462.4 338.5 686.8 1.16 Grain stored in the preceding year in KG 32.5 121.6 99.8 1.15 *Significant at 10% level, ** significant at 5% level *** significant at 1% level 5
  • 6. Journal of Economics and Sustainable Development ISSN 2222-1700 (Paper) ISSN 2222-2855 (Online) Vol.4, No.18, 2013 www.iiste.org Source: Computed from data of 2011/12 household survey 3.3. Composition of household food consumption According to the study result, household food consumption is dominated with cereals (100%) followed by fish (80%). Cereals appear in every meal services. Pulses, vegetables and animal products were serving as an ingredient to the major household meal constituting of cereals such as Maize, Teff, Wheat, Sorghum and Barley. Almost 63% of the surveyed households were consuming root crops, while 25% were using fruits as complementary to their major dish. Local drinks were comprises of coffee and homemade beer usually serve as gap filler to overcome food shortage. In most of the cases, coffee drink were used to cover household meal especially breakfast. Table 3 below shows response on composition of food consumed by the surveyed households. Table 3. Households food composition Household Food composition Food secure Food insecure Total Percentage Cereals 80 76 156 100 Fish 80 45 125 80 Root crops 43 55 98 63 Vegetables 44 52 96 62 Pulses 72 63 135 87 Fruits 16 23 39 25 Animal products 12 37 49 31 Local drinks 42 34 76 49 Obs. 156 Source: Computed from data of 2011/12 household survey 3.4. Household food energy intake Given the equivalent male adult scale weight, energy composition of foods commonly used in the study area, the total available food to a given household per day was computed to know the food energy intake of average household in kilo calorie. The result reflected, households commonly get food energy from own production and through purchases in the proportion of 82% and 18%, respectively. The amount of available food to food secure household was highest compared to the food insecure once, showing statistical significance of the mean. On the contrary, the food energy requirement of food insecure household was beyond the food secure once indicating more AE for the former, with mean difference inr energy required significant at 5% level. Table 4. Average energy intake (kcal) Food insecure non-fishing Food secure fishing Indicator households households Combined t-value Available food 9283 31234 20540 -8.5*** energy Required food 14145 12523 13314 2.03** energy **Significant at 5% level *** Significant at 1% level Source: Computed from data of 2011/12 household survey 3.5. EMPRICAL RESULTS This section examines the impact of fishing on food energy intake of average household based on the outcome of the propensity score matching (PSM). In the first step, we employed the logit model to obtain the propensity score. The purpose was not to identify particular relationships, but rather to maximize the predictive power of the model. Matching was done on 11 covariates, which were found to generate best balance between the treated and control group (fishing and non-fishing households). The covariates were used to generate propensity scores for the non-fishing households living in the area, determining which would probably have participated had they had interest in the activity. The Logit estimate of determinants of food energy intake of fishing households were presented in the Table 5 below. 6
  • 7. Journal of Economics and Sustainable Development ISSN 2222-1700 (Paper) ISSN 2222-2855 (Online) Vol.4, No.18, 2013 www.iiste.org Table 5. Logit estimate of determinants of food security status Covariates Coefficient P-value Gender of household head (1/0) -0.53 0.80 Household family size -0.55 0.10* Education level of household head (grade level) 1.20 0.02** Livestock holding (TLU) -0.73 0.03** Farmland holding (ha) 0.08 0.92 Irrigation area (ha) -0.30 0.78 Access to formal finance (1/0) 1.12 0.40 Access to market(km) -5.30 0.00*** Access to telephone service (1/0) -5.00 0.02** Participation in Equib contribution (1/0) 8.90 0.02** Home improvement cost in Birr -0.001 0.30 Constant 11.50 0.02** Number of obs =156 Food secure fishing HH= 80 Food insecure non-fishing HH= 76 Pseudo R2 =0.71 LR chi2(12) =158.10 *Significant at 10% level, ** significant at 5% level *** significant at 1% level Source: Computed from data of 2011/12 household survey Fishing and non-fishing households were matched using Kernel Based Matching (KBM) and Nearest Neighbor Matching (NNM). To ensure maximum comparability of the two groups, the sample were restricted to the common support region, defined as the values of propensity scores where both treated and control cases can be found. As presented in Table 6 below, the unmatched sample failed to satisfy the balancing properties, in that food secure fishing households were significantly different in several aspects from the food insecure non-fishing households (Column 1). However, using KBM and NNM most (90%) of the covariates supported insignificant difference among the two groups, showing good much. Hence, matched samples are adequate to perform an impact analysis, whereas the unmatched samples are not. Table 6. Balancing test of matched samples 2. Kernel (KBM) 1. Unmatched samples Covariates Gender of household head (1/0) Household family size Education level of household head (grade) Livestock holding (TLU) Farmland holding (ha) Irrigation area (ha) Access to formal finance (1/0) Access to market(km) Access to telephone service (1/0) Participation in Equib contribution (1/0) Home improvement cost in ETB based Treatment HH Control HH Diff: p-value Treatment HH Control HH 0.86 5.90 2.94 4.28 1.90 0.60 0.45 0.79 0.60 0.60 2,329.00 0.99 5.51 0.34 16.27 3.28 1.38 0.80 0.13 0.13 0.80 571.25 0.00*** 0.15 0.00*** 0.00*** 0.00*** 0.00*** 0.00*** 0.00*** 0.00*** 0.01*** 0.00 *** 1.00 6.20 2.10 4.82 1.83 0.38 0.30 0.90 0.20 0.20 5,131.50 0.90 5.98 1.10 9.22 2.13 0.78 0.52 0.40 0.38 0.42 2,110.00 matching Diff: pvalue 0.33 0.81 0.23 0.22 0.63 0.25 0.35 0.05** 0.40 0.31 0.26 3. Nearest Neighbor Matching NNM (4) Treatment HH Control HH Diff: p-value 1.00 6.20 2.10 4.82 1.83 0.38 0.30 0.90 0.20 0.20 5,131.50 0.90 6.05 1.10 7.83 1.85 0.66 0.45 0.40 0.45 0.35 2,110.00 0.33 0.87 0.23 0.38 0.97 0.41 0.51 0.05 ** 0.26 0.48 0.26 *significant at 10% level, **significant at 5% level, ***significant at 1% level Source: Computed from data of 2011/12 household survey As presented in Table 7 below, low standardized bias, and the joint insignificant p-values of the likelihood ratio tests suggested absence of systematic difference in the distribution of covariates between the groups after matching. Thus, the result helped to evaluate fishing impacts on food energy intake of food secure and food insecure with similar observed characteristics. Table 7. Covariate balancing indicators before and after matching (food secured fishing household) After matching Indicators Before matching 1. KBM 2. NNM (4) Mean standardized difference (bias) 80.6 39 33.3 Pseudo R2 0.71 0.92 0.87 χ 2 P-value of LR 0.00*** **significant at 5% level, ****significant at 1% level Note: NNM = nearest neighbor matching; KBM = kernel-based matching Source: Computed from data of 2011/12 household survey 7 0.11 0.14
  • 8. Journal of Economics and Sustainable Development ISSN 2222-1700 (Paper) ISSN 2222-2855 (Online) Vol.4, No.18, 2013 www.iiste.org As indicated in Table 8 below, due to matching exercise the sub-sample comprises of 86 households using KBM and NNM. These were observations whose propensity scores fall in the common support region. Table 8. Number of observations within common support Samples KBM NNM (4) Food insecure non-fishing households 76 76 Food secure fishing households 10 10 Total 86 86 Note: NNM = nearest neighbor matching; KBM = kernel-based matching Source: Computed from data of 2011/12 household survey Consequently, the impact of fishing on food energy intake of the household were computed based on matched sample, which was presented in Table 9. Using the Average Treatment Effect on the Treated (ATT) that measures the average difference between food energy intake (kcal) of food secure fishing household and the food insecure non-fishing household of the corresponding match, there appear to be statistically significant difference of changes in income between the two. Thus, our findings confirmed that there were substantial increment in average food energy intake of household's as a result of participation in the fishing activities. Table 9. Estimation of average fishing impact using propensity score matching methods KBM NNM (4) 27375 27213 Average fishing impact (ATT) 10827** 10823** Standard error **Significant at 5% level Source: Computed from data of 2011/12 household survey The sensitivity of our finding to hidden biases were examined using the Rosenbaum bound approach, as presented in Table 10 below. Accordingly, we can conclude that the estimates of the average fishing impacts reported in Table 9 above were insensitive to hidden bias, thus the findings result were a reliable indicator of the impact of fishing on household food energy intake. Table 10. Sensitivity analysis Wilcoxon Signed Rank Hodges-Lehmann point estimate Gamma (Г) sensitivity P-value parameter L. Bound P- U. Bound P- L. Bound HL U. Bound HL Value Value Est. Est. 1 0 0 16,094 16,094 1.5 0 0 13,732 19,086 2 0 0.0000009 12,377 22,025 2.5 0 0.000004 11,418 25,194 3 0 0.00002 10,748 27,578 Source: Computed from data of 2011/12 household survey 4. CONCLUSION In this paper, we used descriptive analysis, food security index and propensity score matching to examine the impacts of fishing on food security status of 156 households. We used cross sectional data of the 2011/12 agricultural production season. Using an equivalent male adult scale weight, the average family size of food secure household and food insecure household were 5.9AE and 6.7AE, respectively. The mean difference was significant at 5% level. Consequently, the available food energy to food secured household was 31234kcal while it was 9283kcal to the food insecure once. On the contrary, the required food energy was 14145kcal to food insecure households and 12523kcal to the food secure fishing households, with mean difference significant at 5% level. According to the study result, household food consumption were largely dependnet on cereal grain (100%), pulses ingredient (87%), fish product (80%), root crops (63%) and vegetables (62%). Consumption of animal products were reported by 31% of respondents indicating difficulty of getting such products. Animal products were mostly sold rather than using for home consumption. In the effort to analyze the impact of fishing on food security of households, this study has identified and elaborated the potential self-selection biases that emerge from simple comparisons of food energy intake of food secure fishing households with food insecure non-fishing counterparts. These biases have to do with the attributes of the study area as well as the attributes of household themselves. Thus, the research has shown how one might use the propensity score matching method to evaluate the impact of fishing. The matching was undertaken between food secure fishing households and food insecure non-fishing partners, considering specific household characteristics. This careful selection and matching process ensures a relatively unbiased estimate of 8
  • 9. Journal of Economics and Sustainable Development ISSN 2222-1700 (Paper) ISSN 2222-2855 (Online) Vol.4, No.18, 2013 www.iiste.org the true impacts of fishing on household food security. Accordingly, the result of impact analysis verified the significance of fishing on food security of average household using the matched samples. The stability of the matching result were tested using the Rosenbaum Sensitivity test for presence of hidden bias. Hence, the finding has confirmed an absence of hidden bias due to unobserved confounder that support the positive treatment effect of fishing activity. Hence, based on the study results the following suggestions were drawn; • Promote income diversification opportunities among household to bring more income improvement. • Carryout massive awareness promotion on using family planning services to improve household food security situation. • Encourage in-depth investigation of household food security situation for better understanding and realistic planning. 5. 1. 2. 3. 4. 5. 6. 7. 8. 9. 10. 11. 12. 13. 14. 15. 16. 17. 18. 19. REFERENCES Ajibola, O. (2000). Institutional Analysis of the National Food storage Programme. Research report 23 Development Policy Centre, Ibadan. Alemu, ZG, Oosthuizen, LK & Van schalkwyk, HD. (2002). Agricultural development policies of Ethiopia since 1957. South African Journal of Economic History, Volume 17, No. 1 & 2: 1:24. Asatiani, S. (2009). Food Security Concept, Condition and Trends in Georgia. IBSU Scientific Journal, 3(2), 35-54. journal.ibsu.edu.ge/index Devereux S. (1993). Goats Before Ploughs: Dilemmas of Household Response Sequencing during Food Shortages. Institute for Development Studies Bulletin 24: 29-43. Devereux, S. (1993). Goats Before Ploughs: Dilemmas of Household Response Sequencing during Food Shortages”, Institute for Development Studies Bulletin, Volume 24 No. 4, pp. 52-59. Elzak, R.M., Elbushra, A.A., Ahmed, S.E.H. and Mubarak, A.M. (2011). The role of livestock production on food security in Sudan: Rural White Nile State. Online Journal of Animal and Feed Research . 1( 6): 439-443 . ISSN 2228-7701 . http://www.ojafr.ir Food & Agricultural Organization (FAO). (2001). Crop and food supply assessment mission to Ethiopia. FAO Global Information and Early Warning System on Food and Agriculture. World Food Program.Rome, Italy. Food and Agricultural Organization (FAO). (1998). Crop and food supply assessment mission to Ethiopia. FAO Global Information and Early Warning System on Food and Agriculture. World Food Program. Rome, Italy. Food and Agricultural Organization (FAO). (1998). Crop and food supply assessment mission to Ethiopia. FAO Global Information and Early Warning System on Food and Agriculture. World Food Program. Rome, Italy. Food and Agriculture Organization (FAO). (1999). North and South Gonder-Food Security Assessment in Parts of the Tekeze River Watershed. United Nations Development Programme (UNDP), Emergencies Unit for Ethiopia, Assessment Mission: May 26- June 7, 199, Addis Ababa, Ethiopia. Haile, H.K., Alemu, Z.G. and Kudhlande G.(2005). Causes of household food insecurity in Koredegaga peasant association, Oromiya Zone, Ethiopia. Working Paper. Johnson, U. (1986), Nutrition, Household Food Security and Women: Experience from Tanzania, Dar es Salaam, UNICEF. Kayunze, K.A. and Salisali, B. (2006). “Organizations and Farmer’s Access to Agricultural Technologies for Food Security: The Case of Meatu District in Tanzania, Journal of Management and Development Dynamics, Volume. 18 No.1, pp. 46-66. Maliwichi, L.L, Oni, S.A, and Obadire, O.S. (2012). An investigation into the factors affecting food availability, choices and nutritional adequacy of smallholder farming households under irrigation and dryland farming in Vhembe district of Limpopo, province, South Africa. Journal of Agricultural Research Vol. 7(25), pp. 3653-3664. http//. http://www.academicjournals.org/AJAR. Maxwell, S and M Smith. (1992). Household Food Security: A Conceptual Review. University of Sussex, Institute of Development Studies. Mimeo, Brighton, UK. www.wudpeckerresearchjournals.org/ Maxwell, S. and Frankenberger, T. (1992). Household Food Security: Concepts, Indicators Measurements, New York, UNICEF and IFAD Dan Strum Gardanni, Inc. Mbukwa, J. (2013). A model for predicting food security status among households in developing countries. International Journal of Development and Sustainability, Vol. 2 No. 2 (In Press). http://isdsnet.com Ministry of Finance and Economic Development (MOFED). (2013). National Economic Accounts Statistics of Ethiopia. Estimates of the 2010/11 base year Series (2003 Ethiopian Fiscal Year). Addis Ababa. Muhammad-Lawal, A. and Omotesho, O.A. (2008). Cereals and Farming Households’ Food Security in 9
  • 10. Journal of Economics and Sustainable Development ISSN 2222-1700 (Paper) ISSN 2222-2855 (Online) Vol.4, No.18, 2013 www.iiste.org Kwara State, Nigeria. Agricultural Journal 3 (3): 235-240, ISSN: 1816-9155. Medwell Journals . 20. Najafi, B. (2003). “An Overview of Current Land Utilization Systems and Their Contribution to Agricultural Productivity”. Report of APO Seminar on Impact of System on Agricultural Productivity. Agricultural Productivity Organization (APO), Iran. 21. Paddy, F. (2003). Gender Differentials in Land Ownership and Their Impact on Household Food Security: A Case Study of Masaka District, MA Dissertation, Uganda Press, Baltimore and London. http://www.troz.unihohenheim.de 22. Rosegrant, M.W., Cline, S.A., Li, W. Sulser, T B. and Valmonte-Santos, R.A. (2005). Looking Ahead Long Term Prospects for Africa’s Agricultural Development and Food Security. 2020 Discussion Paper 41, International Food Policy Research Institute (IFPRI), Washington, DC. 23. Rosen, S., Meade, B., Shapouri, S., D'Souza, A., and Rada, N. (2012). International Food Security Assessment, 2012-22. A Report from the Economic Research Service. United States Department of Agriculture GFA-23. www.ers.usda.gov 24. Sen, A. (1986). Food, Economics, and Entitlements. Lloyd’s Bank Review. 160: 1-20. 25. Shiferaw, F., Kilmer, R.L, Gladwin, C. (2003). Determinants of food security in Southern Ethiopia: A selected paper presented at the 2003 American Agricultural Economics Association Meetings in Montreal, Canada. 26. United Nations Country Team (UN). (2011). Ethiopia United Nations Development Assistance Framework 2012 to 2015. United Nations Country Team. http://ethiopia.unfpa.org 27. Zerihun Nigussie and Getachew Alemayehu. (2012). Levels of household food insecurity in rural areas of Guraghe zone, Southern Ethiopia. Vol. 2(1), pp. 008 - 014, Wudpecker Journal of Agricultural Research. 10
  • 11. This academic article was published by The International Institute for Science, Technology and Education (IISTE). The IISTE is a pioneer in the Open Access Publishing service based in the U.S. and Europe. The aim of the institute is Accelerating Global Knowledge Sharing. More information about the publisher can be found in the IISTE’s homepage: http://www.iiste.org CALL FOR JOURNAL PAPERS The IISTE is currently hosting more than 30 peer-reviewed academic journals and collaborating with academic institutions around the world. There’s no deadline for submission. Prospective authors of IISTE journals can find the submission instruction on the following page: http://www.iiste.org/journals/ The IISTE editorial team promises to the review and publish all the qualified submissions in a fast manner. All the journals articles are available online to the readers all over the world without financial, legal, or technical barriers other than those inseparable from gaining access to the internet itself. Printed version of the journals is also available upon request of readers and authors. MORE RESOURCES Book publication information: http://www.iiste.org/book/ Recent conferences: http://www.iiste.org/conference/ IISTE Knowledge Sharing Partners EBSCO, Index Copernicus, Ulrich's Periodicals Directory, JournalTOCS, PKP Open Archives Harvester, Bielefeld Academic Search Engine, Elektronische Zeitschriftenbibliothek EZB, Open J-Gate, OCLC WorldCat, Universe Digtial Library , NewJour, Google Scholar