A gis analysis of noise islands in calabar metropolis, nigeria
•
2 gefällt mir•790 views

International peer-reviewed academic journals call for papers, http://www.iiste.org

Empfohlen
Empfohlen
Weitere ähnliche Inhalte
Ähnlich wie A gis analysis of noise islands in calabar metropolis, nigeria
Ähnlich wie A gis analysis of noise islands in calabar metropolis, nigeria (20)
Mehr von Alexander Decker
Mehr von Alexander Decker (20)
Kürzlich hochgeladen
Kürzlich hochgeladen (20)
A gis analysis of noise islands in calabar metropolis, nigeria
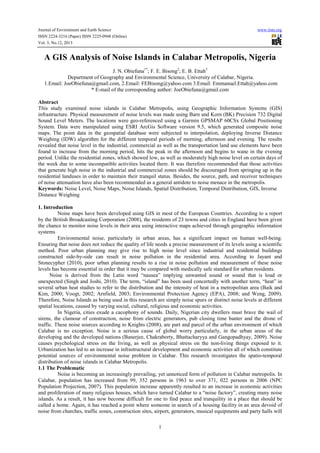
- 1. Journal of Environment and Earth Science ISSN 2224-3216 (Paper) ISSN 2225-0948 (Online) Vol. 3, No.12, 2013 www.iiste.org A GIS Analysis of Noise Islands in Calabar Metropolis, Nigeria J. N. Obiefuna1*; F. E. Bisong2; E. B. Ettah3 Department of Geography and Environmental Science, University of Calabar, Nigeria. 1.Email: JoeObiefuna@gmail.com, 2.Email: FEBisong@yahoo.com 3.Email: Emmanuel.Ettah@yahoo.com * E-mail of the corresponding author: JoeObiefuna@gmail.com Abstract This study examined noise islands in Calabar Metropolis, using Geographic Information Systems (GIS) infrastructure. Physical measurement of noise levels was made using Barn and Korn (BK) Precision 732 Digital Sound Level Meters. The locations were geo-referenced using a Garmin GPSMAP 60CSx Global Positioning System. Data were manipulated using ESRI ArcGis Software version 9.5, which generated composite noise maps. The point data in the geospatial database were subjected to interpolation, deploying Inverse Distance Weighing (IDW) algorithm for the different temporal periods of morning, afternoon and evening. The results revealed that noise level in the industrial, commercial as well as the transportation land use elements have been found to increase from the morning period, hits the peak in the afternoon and begins to wane in the evening period. Unlike the residential zones, which showed low, as well as moderately high noise level on certain days of the week due to some incompatible activities located there. It was therefore recommended that those activities that generate high noise in the industrial and commercial zones should be discouraged from springing up in the residential landuses in order to maintain their tranquil status. Besides, the source, path, and receiver techniques of noise attenuation have also been recommended as a general antidote to noise menace in the metropolis. Keywords: Noise Level, Noise Maps, Noise Islands, Spatial Distribution, Temporal Distribution, GIS, Inverse Distance Weighing 1. Introduction Noise maps have been developed using GIS in most of the European Countries. According to a report by the British Broadcasting Corporation (2008), the residents of 23 towns and cities in England have been given the chance to monitor noise levels in their area using interactive maps achieved through geographic information systems Environmental noise, particularly in urban areas, has a significant impact on human well-being. Ensuring that noise does not reduce the quality of life needs a precise measurement of its levels using a scientific method. Poor urban planning may give rise to high noise level since industrial and residential buildings constructed side-by-side can result in noise pollution in the residential area. According to Jayant and Stonecypher (2010), poor urban planning results to a rise in noise pollution and measurement of these noise levels has become essential in order that it may be compared with medically safe standard for urban residents. Noise is derived from the Latin word “nausea” implying unwanted sound or sound that is loud or unexpected (Singh and Joshi, 2010). The term, “island” has been used concertedly with another term, “heat” in several urban heat studies to refer to the distribution and the intensity of heat in a metropolitan area (Baik and Kim, 2000; Voogt, 2002; Arnfield, 2003; Environmental Protection Agency (EPA), 2008; and Weng, 2009). Therefore, Noise Islands as being used in this research are simply noise spurs or distinct noise levels at different spatial locations, caused by varying social, cultural, religious and economic activities. In Nigeria, cities exude a cacophony of sounds. Daily, Nigerian city dwellers must brave the wail of sirens, the clamour of construction, noise from electric generators, pub closing time banter and the drone of traffic. These noise sources according to Knights (2008), are part and parcel of the urban environment of which Calabar is no exception. Noise is a serious cause of global worry particularly, in the urban areas of the developing and the developed nations (Banerjee, Chakraborty, Bhattacharyya and Gangopadhyay, 2009). Noise causes psychological stress on the living, as well as physical stress on the non-living things exposed to it. Urbanization has led to an increase in infrastructural development and economic activities all of which constitute potential sources of environmental noise problem in Calabar. This research investigates the spatio-temporal distribution of noise islands in Calabar Metropolis. 1.1 The Problematic Noise is becoming an increasingly prevailing, yet unnoticed form of pollution in Calabar metropolis. In Calabar, population has increased from 99, 352 persons in 1963 to over 371, 022 persons in 2006 (NPC Population Projection, 2007). This population increase apparently resulted to an increase in economic activities and proliferation of many religious houses, which have turned Calabar to a “noise factory”, creating many noise islands. As a result, it has now become difficult for one to find peace and tranquility in a place that should be called a home. Again, it has reached a point where someone in search of a housing facility in an area devoid of noise from churches, traffic zones, construction sites, airport, generators, musical equipments and party halls will 1
- 2. Journal of Environment and Earth Science ISSN 2224-3216 (Paper) ISSN 2225-0948 (Online) Vol. 3, No.12, 2013 www.iiste.org only be wasting own time. Several studies on noise have been carried out in Calabar but they neither took cognizance of the spatial and temporal elements nor did they apply Geographic Information Systems (GIS) as a tool in the study, which this study considered. For example, Menkiti (1990) studied generator noise in Calabar. Besides, Ntui (2009) studied noise sources and levels at the University of Calabar Library, Calabar, Nigeria. In addition, Okoro and Inyang (2010) examined the effect of air traffic noise on residents of Ekpo Abasi street Calabar, Cross River State. In these studies, no form of georeferencing was done and noise maps were not produced. Since noise transmission, as well as its effect on the environment has many spatial components, the use of GIS provides the possibility of optimizing the quality of noise studies. Moreover, in contemporary urban planning process, Geographic Information Systems (GIS) has become an important tool for planners, environmental managers and decision makers. Today, GIS excels at editing, data handling, interpolation and visualization capabilities that are lacking in most models. Contrary to Calabar situation, there exist some comprehensive data on noise level in some parts of the world. For instance, in the United Kingdom, planners have been creating noise maps in communities around the country for several years. The Department of Environment, Food and Rural Affairs (DEFRA) has launched a noise mapping website so as to make the results available to the public. The Uniform Resource Locator (URL) is http://services.defra.gov.uk/wps/portal/noise. Also, the European Union Noise Observation and Information Service website located at http://noise.eionet.europa.eu/index.html has been developed. It is a dynamic website that graphically shows on a country-wide basis, the number of residents exposed to various levels of road, air and rail noise. These would not have been possible if noise data were not available to them. Finally GIS has been successfully used in various noise-related examinations. The most relevant findings were that GIS application in noise study has proven to be an ideal tool for carrying out noise mapping as well as noise impact assessment in an urban setting, In Calabar, it is certainly a case of “my people perish because of lack of knowledge”. Therefore, there is a need for baseline noise data to be acquired while appropriate noise information should be made available to the public. 1.2 The Study Objectives The main aim of this study is to examine the spatial and temporal distribution of noise islands in Calabar Metropolis. The objectives are as follows: 1) To graphically demarcate all the noise risk zones based on different noise levels. 2) To generate a GIS-based noise-level map of Calabar Metropolis for different temporal periods. 2. Method of Study 2.1 Data sources Data for this study is made up of noise level reading from line source such as traffic noise and point sources such as commercial sites, loudspeakers, generators, and religious homes. All noise values were expressed in decibel (dB) scale. The geographical coordinates and elevation of the locations were obtained. Another set of data used for this research is that of secondary origin. Examples of data in this group are landuse maps and high resolution satellite imageries such as Google Earth Satellite Maps. 2.2 Materials used 2.2.1 Global positioning system (GARMIN GPSMAP 60CSx). A GARMIN GPS was used to geo-reference all the data points. Before operation, the power button was pressed and held to turn on the unit. During operation, the unit was held in front with the top tilted upwards. While the GPS receiver was searching for satellite signals, a “locating satellites” message was replaced by an “acquiring satellites” message until enough signals were acquired to fix its location. 2.2.2 Digital sound level meter (BK Precision 732) The experimental apparatus used in the recording of noise levels consisted of a BK Precision 732 Digital Sound Level Meters. It is equipped with 4 digits Liquid Crystal Display (LCD), a condenser microphone and an octave filter. During measurements, the microphone was positioned in such a way as not to be in acoustic shadow of any obstacle in the field of the reflected waves. It has a resolution of 0.1 dB and an update cycle 0.5 second. The system provides 30 to 130dB capability in three convenient measurement ranges. The ranges are Low (30 to 80dB), Medium (50 to 100dB) and High (80 to 130dB), with an accuracy of ±1.5 dB. The meter meets the International Electrotechnical Commission (IEC) 651 Type II standard, and includes frequency weighting of A and C and fast and slow time weighting. The A-weighting was used because of its recommendation for environmental and industrial studies (Peterson and Gross, 1974). 2.5 Site selection and measurement procedure Site selection for this study was entirely based on observation. A reconnaissance survey of Calabar metropolis by the researcher with a sound level meter revealed 85 noise prone locations, with noise level ranging 2
- 3. Journal of Environment and Earth Science ISSN 2224-3216 (Paper) ISSN 2225-0948 (Online) Vol. 3, No.12, 2013 www.iiste.org from 75 to 105dB. There are other locations where noise levels are below, or within the noise exposure limit recommendation of 75dB as stipulated by the World Health Organization (WHO) and the United Nations Environmental Programme (UNEP (1980)). A stratified random sampling was employed in selecting locations or sampling sites for the study. The 85 locations identified as noise prone locations were grouped into 4 different strata representing various land uses. Each stratum was sampled as an independent sub-population. A simple random sample was selected using a digital random number generator shown in figure 3.4. For this study, 30 per cent of the observed data points was selected from each stratum. The 30 percent is very representative as it is supported by Udofia (2006), which states that 30 per cent of sampling population is ideal as a sampling size in any physical study. Enoh (1997) stated that no serious study should admit a sampling fraction that is less than one tenth of the population. Therefore, 30 per cent, which is about one third of the population is very adequate for this study. (TABLE 1) and depicted (FIG. 1) Sound Level Meters were simultaneously used to acquire data in all locations. A GPS was used to obtain the coordinates of the sampled locations. Noise data from transportation landuse were acquired from road intersections or nodes. The reason for this is that transport land use is a line source of noise, which is always in continuum. Noise data from other landuses were acquired from the source at a distance of one meter. These sources are point sources and are discrete. Point sources include noise from industrial and commercial landuses. Examples are noise from generators, grinding machines, stereo players, etc. 3
- 4. Journal of Environment and Earth Science ISSN 2224-3216 (Paper) ISSN 2225-0948 (Online) Vol. 3, No.12, 2013 www.iiste.org FIG. 1. Sampled points in Calabar Metropolis Source: Visualization by the authors, 2011. 4
- 5. Journal of Environment and Earth Science ISSN 2224-3216 (Paper) ISSN 2225-0948 (Online) Vol. 3, No.12, 2013 www.iiste.org 3. Results Table 2 shows the mean noise level for all the sampled locations for the three time periods: morning, afternoon and evening. From the tables, nominal labels 1 and 2 represent the industrial landuse; the numbers ranging from 3 to 11 represent the transportation landuse; numbers 12 to 18 represent the residential zone while numbers 19 to 25 represent the commercial landuse. From the tables, it could be revealed that the commercial landuse has the heavier mean decibel values within the range of 68.0dB and 95.8dB. The residential landuse happens to have a lower mean decibel value ranging from 44.9dB to 71.4dB. Table 3 shows the mean noise level for all the identified landuses. From the table, the industrial landuse has the highest noise values in the morning, which spans from 88.5dB at 8am, 89.1dB at 8.30am and 89.5dB at 9am. The least is the residential landuse, with value ranging from 55dB to 57dB at the same time period. In the afternoon, the commercial zone emerged the first in terms of noise level with the following figures: 84.8dB at 12 noon, 85.6dB at 12.30pm, and 86.5dB at 1pm. In the evening, the commercial zone also emerged the first with the following figures: 86.5dB at 4.pm, 86.6dB at 4.30pm, and 86.9dB at 5pm. In the digital framework, the point data in the geospatial database were subjected to interpolation, deploying Inverse Distance Weighing (IDW) algorithm for the different temporal periods (morning, afternoon and evening). The results of the operation are presented (FIGs. 2, 3 and 4). 5
- 6. Journal of Environment and Earth Science ISSN 2224-3216 (Paper) ISSN 2225-0948 (Online) Vol. 3, No.12, 2013 www.iiste.org FIG 2. Noise island map of Calabar Metropolis highlighting the noise prone zones (morning). Source: Visualization by the authors, 2011. As the figures have succinctly depicted, noise level at the industrial (EPZ) and commercial (Marian and Watt Market) zones range between 78dB and 93dB as indicated by the colour tones. The colour tones have been defined at the filled contour section of the map legend. From figure 2, the industrial area has a wide distribution of noise bandwidth in the morning, while the commercial zone has a low noise bandwidth due to sparse noise emission points. In the afternoon, there is a huge variation as the commercial zones and traffic congestion points are dark coloured signifying higher noise level than the morning period (FIG. 3). Besides, the area covered by noise is much larger than observed in the morning. In the evening, the commercial and the transportation landuses are dark coloured, indicating higher noise level from the landuses. At this period, noise intensity at the industrial zone has diminished (FIG. 4). 6
- 7. Journal of Environment and Earth Science ISSN 2224-3216 (Paper) ISSN 2225-0948 (Online) Vol. 3, No.12, 2013 www.iiste.org FIG 4. Noise island map of Calabar Metropolis highlighting the noise risk zones (Evening). Source: Visualization by the authors, 2011. FIG 3. Noise island map of Calabar Metropolis highlighting the noise risk zones (afternoon). Source: Visualization by the authors, 2011. 7
- 8. Journal of Environment and Earth Science ISSN 2224-3216 (Paper) ISSN 2225-0948 (Online) Vol. 3, No.12, 2013 www.iiste.org 4. Conclusion and Recommendations This study examined noise islands in Calabar Metropolis. In order to develop noise island maps, an automated, GIS-based approach was used to manipulate geospatial data. The outputs are three composite noise island maps showing noise levels at various locations for different time periods of the day: the morning, afternoon and the evening. Undoubtedly, there is a need for harmonized research such as this, in order to constantly acquire, validate and update noise level information in Calabar Metropolis, and other urban areas in Nigeria, as well as generate a map that could be used for planning of facilities. It is therefore recommended that those activities that generate high noise in the industrial and commercial zones should be discouraged from springing up in the residential landuses in order to maintain the tranquil status of the zones. Besides, the `source-path-receiver` technique of noise attenuation is also recommended as a general remedy to noise menace in the metropolis. References Arnfield, J. A. (2003). Two decades of urban climate research: a review of turbulence, exchanges of energy and water, and the urban heat island. International Journal of Climatology, 23, 1 – 26. Baik, J. J. and Kim, Y. H. (2000). Dry and moist convection forced by an urban heat island. Journal of Applied Meteorology, 40 (8), 1462-1475. Banerjee, D.; Chakraborty, S. K; Bhattacharyya, S.; Gangopadhyay, A. (2009). Appraisal and mapping the spatial-temporal distribution of urban road traffic noise. International Journal of Environment, Science and Technology, 6 (2), 325-335. British Broadcasting Corporation (2008). Maps chart noise in urban areas: News article posted to http://news.bbc.co.uk/2/hi/uk_news/7403280.stm Browsed: September 1, 2010. Enoh, O. E (1997) An Introduction to Empirical Research in Social Sciences and the Humanities. Uyo: Etofia Media Environmental Protection Agency (2008). The characteristics and negative impacts of the Urban Heat Island effect. The main concerns for USA and the mitigation strategies that are being taken http://www.epa.gov/hiri/ Retrieved: August, 2010. Jayant, R. and Stonecypher, L. (2010). Measuring Urban Noise Pollution on the Decibel Scale. Environmental Engineering Article On-line at http://www.brighthub.com/engineering/civil/articles/74443.aspx Browsed: August, 2010. Knights, S (2008). Sacred Space and the City: Religious Buildings and Noise Pollution: Havard International Law Journal, 49, 50-55. Menkiti, A. I. (1990). The noise of small electric generators. Nigerian Journal of Science, 24 (1 and 2), 83-85. National Population Commission (2007). Federal Republic of Nigeria Official Gazette 24(96) Federal Government of Nigeria, National Population Commission (2007) Final Result of the 2006 Census for Calabar, Cross River State. Ntui, A. I (2009) Noise Sources and Levels at the University of Calabar Library, Calabar, Nigeria. African Journal of Library, Archives and Information Science. 19(1), 8-12. Okoro, R. C. and Inyang, I. J. (2010) Effect of Air Traffic Noise on Residents of Ekpo Abasi Street Calabar, Cross River State, Nigeria. Journal of Basic Physical Research. 1(1) 48-53. Peterson A. P. G. and Gross E. G (1974). Handbook of noise Measurement, 7th Ed., Genkand publishers, USA, 46-50. Singh, D. and Joshi, B. (2010). Study of the Noise Pollution for three consecutive years during Deepawali festival in Meerut City, Uttar Pradesh. New York Science Journal, 3, (6), 40-42. Udofia, E. P. (2006) Fundamentals of Social Science statistics. Immaculate Publications Limited. Enugu, Nigeria. 245-251. UNEP (1980) Environmental Health Criteria 12: Noise, Geneva, Switzerland. Voogt, J. A. (2002). Urban Heat Island. In Encyclopedia of Global Environmental Change, Vol. 3. T. Munn (Ed), 660-666. Chichester: Wiley. Weng, Q. (2009). Thermal infrared remote sensing for urban climate and environmental studies: Methods, applications, and trends. ISPRS Journal of Photogrammetry and Remote Sensing, 64; 335 – 344 . World Health Organisation (WHO) and the United Nations Environmental Programme (UNEP (1980)). Environmental Health Criteria 12: Noise, Geneva, Switzerland. 8
- 9. This academic article was published by The International Institute for Science, Technology and Education (IISTE). The IISTE is a pioneer in the Open Access Publishing service based in the U.S. and Europe. The aim of the institute is Accelerating Global Knowledge Sharing. More information about the publisher can be found in the IISTE’s homepage: http://www.iiste.org CALL FOR JOURNAL PAPERS The IISTE is currently hosting more than 30 peer-reviewed academic journals and collaborating with academic institutions around the world. There’s no deadline for submission. Prospective authors of IISTE journals can find the submission instruction on the following page: http://www.iiste.org/journals/ The IISTE editorial team promises to the review and publish all the qualified submissions in a fast manner. All the journals articles are available online to the readers all over the world without financial, legal, or technical barriers other than those inseparable from gaining access to the internet itself. Printed version of the journals is also available upon request of readers and authors. MORE RESOURCES Book publication information: http://www.iiste.org/book/ Recent conferences: http://www.iiste.org/conference/ IISTE Knowledge Sharing Partners EBSCO, Index Copernicus, Ulrich's Periodicals Directory, JournalTOCS, PKP Open Archives Harvester, Bielefeld Academic Search Engine, Elektronische Zeitschriftenbibliothek EZB, Open J-Gate, OCLC WorldCat, Universe Digtial Library , NewJour, Google Scholar