SlideShare a Scribd company logo
1 of 14
Download to read offline
European Journal of Business and Management                                                          www.iiste.org
ISSN 2222-1905 (Paper) ISSN 2222-2839 (Online)

                   Evaluating the Technical Efficiency of Hospitals in
                                      Southeastern Nigeria

                                            Hyacinth Eme Ichoku
                            Centre for Demographic and Allied Research (CDAR)
                      Department of Economics, University of Nigeria, Nsukka, Nigeria
                             Tel. +2348057028180 Email: hichoku@yahoo.com


                                  William M. Fonta (Corresponding author)
                            Centre for Demographic and Allied Research (CDAR)
                      Department of Economics, University of Nigeria Nsukka, Nigeria
                           Tel. +2348035408395 Email: fontawilliam@yahoo.com


                                            Obinna E. Onwujekwe
               Health Policy Research Unit, Department of Pharmacology and Therapeutics,
                    College Of Medicine, University Of Nigeria, Enugu Campus, Nigeria
                                        Email: onwujekwe@lshtm.ac.uk


                                               Joses M. Kirigia
                  World Health Organization, Regional Office for Africa, Brazzaville, Congo
                                        Email: kirigiaj@afro.who.int


Abstract
Efficient utilization of health resources is a critical requirement for attaining health system goals
particularly in low income countries. Inefficiency in health resource utilization may imply death for the
next child in the queue in a resource constrained environment. This study analyzes the technical and scale
efficiencies in hospitals in low income countries using Nigeria as a case study. The study uses primary data
sample of 200 hospitals to estimate technical and scale efficiencies using the Data Envelopment Analysis
(DEA). The results clearly indicate large variation in the efficiency of hospitals with average efficiency
score of about 59% under the constant returns to scale assumption and about 72% under variable returns to
scale. This raises some concerns about the level of technical and scale efficiencies in utilization of scarce
health resources in the hospital sector particularly in low income countries.
Keywords: Hospitals, Technical Efficiency, Data Envelopment Analysis, Southeast Nigeria
1. Introduction
In many low income countries where resource constraints are extremely binding, it is not uncommon to
find long queues of patients in public and private hospitals waiting patiently for several hours to be treated
with health resources that often scare in supply. Hospital managers are regularly under pressure to find
more beds, to hire more doctors and nurses, to provide more drugs and other resources for health care.
Inefficiency in the use of available health resources may imply that the sick child next in line may die
without receiving treatment. Doctors and nurses often watch helplessly as their patients die because basic
health care materials are not available in right proportions. It is either too many beds and insufficient drugs,
or too many administrative staff and too few qualified nurses, etc. In many cases, particularly where
patients pay directly for their health services use, the costs of the inefficiency of health systems are passed
on to the patient who has to spend more income fore less value in real treatment. These inefficiencies often


                                                                                                              1
European Journal of Business and Management                                                             www.iiste.org
ISSN 2222-1905 (Paper) ISSN 2222-2839 (Online)

have social welfare implications for the individual and the society as a whole. Many low income countries
are below national and international health goals not only because of scarcity of resources but more
painfully because available resources are not efficiently utilized. These shortcomings highlight the need for
efficiency in the management of health resources. While efficiency is a desideratum at all levels of health
care it is even more important at the hospital level because of its huge claims on the resources of the society
and its even relatively larger claims on the health sector in particular. Hospitals are central to the social idea
of health and illness, the health care system, and the health expenditure (Ityavyar, 1988).
This paper attempts to evaluate the technical and scale efficiencies of hospitals in Nigeria. However, since
the Nigerian health systems shares similar features and experiences with those in many other low income
countries (LICs), it is believed that the lessons from this study will be useful for policies in other LICs.
Using a sample of 200 hospitals in two states of southeast Nigeria the study employs the Data Envelopment
Analysis (DEA) which is able to identify the frontier industry performers and obtain estimates of the extent
of deviations from the frontiers by the inefficient health production units.
2. The Nigerian Health System
Until the return to civil rule in 1999, the health care system in Nigeria, in general and the hospital system in
particular were grossly under funded. Since the 2000 however, the budgetary allocation to the health sector
both at the federal and state levels has increased significantly. It has been estimated that the hospital system
in Nigeria takes over 60% of all human and material resources in Nigeria (Nwosu, 2000). At the
subnational levels the state governments have primary responsibility for secondary health care both through
the direct provision of general hospital services and the regulation of private hospitals. The private
hospitals have also increased dramatically since the 1980s and now constitute over 70% of hospitals in
some states of the country. While the public hospitals now take up considerable part of states‟ annual
budget, the private household expenditures on secondary care has also increased significantly over the last
decade. For example, Ichoku et al. (2009) using the Nigerian Living Standard Survey of 2003/2004,
showed that average out-of-pocket health expenditure in some states takes as much as 13% of household
total income.
Recent statistics by WHO (206) also show that Nigeria has the largest per population supply of health
human resources (doctors and nurses) in Africa comparable only to South Africa and Egypt. There are
about 35,000 medical doctors and 210,000 nurses registered in the country, which translates to 28 doctors
and 170 nurses per 100,000. These figures are significantly higher than the sub-Saharan Africa average of
15 doctors and 72 nurses per 100,000 people. Yet these achievements in human resources and increasing
public and private expenditures on health have not translated into better population health. In many cases,
the country‟s actual health achievement lags behind the African average. Although strictly speaking there
are no direct relationships between input and final outcomes in the curative process, still; large health
inputs without commensurate improvements in the health of the population raises questions about the
efficiency with which the country‟s health resources are converted into actual health achievements.
Inefficient public hospital system will result in waste of public resources which could result to extra
individuals assessing the healthcare at zero marginal cost (Kirigia et al. 2004). For policy to guide hospital
managements to best-practice behavior, it is important to distinguish between efficient and non-efficient
hospitals.
3. The Concept of Technical Efficiency
A particular method of producing a given set of outputs is said to be efficient if, given the level of
prevailing technological knowledge, it is impossible to find any other method of producing the same set of
output using less of at least one of the inputs. In other words, a method of production is inefficient if the
same set of outputs could be obtained using fewer resources. Or, conversely, a production process is
efficient if it is impossible to obtain more outputs from a given set of inputs without increasing inputs using
another method or combination of methods (Chakravarty 2002; Binger and Hoffman, 1998). Thus, if one
decision-making unit such as a hospital produces more outputs from a given set of inputs than another one,
it is recognized as being more efficient, or, if it takes fewer inputs to produce the same level of outputs as
another, then that unit is said to be more efficient. A production unit that is technically efficient is said to be
operating at the production frontier


                                                                                                                 2
European Journal of Business and Management                                                         www.iiste.org
ISSN 2222-1905 (Paper) ISSN 2222-2839 (Online)

3.1 Estimating Relative Efficiency: Data Envelopment Analysis (DEA)
DEA is a deterministic, non-parametric linear programming technique for measuring relative efficiency
where there are multiple (possibly) incommensurate inputs and outputs as suggested by Farrell (1957) and
developed in Charnes et al. (1978). The simple measure of relative efficiency under the DEA methodology
is simply:
                                               weighted sum of outputs
                            Efficiency 
                                               weighted sum of inputs

                                                         u i y1 j  u 2 y 2 j  .....
Or in usual notation as;   Efficiency of unit j                                                     (1)
                                                         vi x1 j  v 2 x 2 j  .....

Where u1 stands for the weight given to output i, y1 j represents the amount of output 1 from unit j, v1
measures the weight given to input 1, and x1 j for the amount of input 1 to unit j. However, note that
equation (1) is constrained to lie within the range [0,1]. A major problem associated with equation (1) is
determining the weights of the input and output variables. In the first place (and as discussed above), it may
be difficult to value input and outputs. Secondly, one hospital may emphasize inpatient care, another
outpatient care. Both are legitimate but the equation does not allow for these differing aspirations. To
overcome this problem, Charnes et al. (1981) recognized that hospitals might well value inputs and outputs
differently. They therefore provide for the adoption, input and output variable weights. The authors further
suggest that different units should be allowed to set their own weights. Thus, under this proposal, the
efficiency of the unit j0 becomes the solution to the problem. Thus,
                           Maximize the efficiency of hospital                 j0
                           Subject to the efficiency of all other units                 1

                                 J u j y j0        
                            max                     
                                    j 1
Or, formally                     M v x                                                             (2)
                                 m1 m m0          
                                                    

                              
                                   J
                                  j 1
                                         u j y ji
Subject to:                                         1       i  1,...I
                              
                                  M
                                      v x
                                  m 1 m mi

Where,   y j 0 represents the quantity of output j for DMU 0 , u j stands for the weight attached to output j,
uj    0,      j  1,...., J , xm 0 measures the quantity of input m, for DMU 0 and vm stands for the weight
attached to input m, vm 0, m  1,....M . Equation (2) makes it clear that a different set of weight is
associated with each DMU. Obviously, equation (2) is a fractional linear program equation but can be made
more tractable by converting it into a system of linear equations in which the objective function can be
maximized subject to a set of linear constraints. In that case, the variable weights u and v, are maximized
subject to the specified constraints. The maximized values of u and x, measure the efficiency of the ith unit
subject to the constraint that when applied all other units, none will have a value of efficiency greater than
1. A further problem with equation (2) is that in its present form it has an infinite number of solutions. This
implies that if, u * and v * are solutions to (2), so also are  u * and  u * (Jacob, 2006). An additional
constraint is therefore imposed such that either the numerator or the denominator of equation (2) is made
equal to 1. By making the denominator equal 1, this leads to the maximization problem: maximize
weighted output subject to weighted input being equal to 1.
This implies re-writing equation (2) in the general form as;
                            max u,v (u y 0 )                                                         (3)


                                                                                                             3
European Journal of Business and Management                                                              www.iiste.org
ISSN 2222-1905 (Paper) ISSN 2222-2839 (Online)

                             v xi  1
Subject to:                  u y i  v xi  i  1,...I
                             u, v  0
The maximization problem in (3) can also be expressed more compactly as:
                             min ,                                                                     (4)

                              y i  Y  0
Subject to:                  x i  X  0
                             0
Where xi represents the column vector of inputs and yi represents the column vector of outputs for each
unit. X and Y represent respectively, the matrix of inputs and outputs for all the units.  is a scalar
quantity that lies in [0,1] range and represents the technical efficiency score of each. When a unit has its
 =1, then the unit is at a point on the production frontier. It is technically efficient relative to other units in
the comparative group. But for  <1 this implies that the unit is relatively inefficient as it is below the
production frontier. The amount by which the score of the inefficient unit differs from 1 indicates the extent
to which the unit could reduce inputs without reducing its output.  is a column vector of constants. The
solution to the linear programming problem is to seek the minimum value of  that reduces the input
variables xi to  xi but at the same time ensures the output level given by yi (Jacobs 2006).The linear
programming problem must be solved for each unit in order to obtain the technical level of efficiency of
that unit.
The model specified in (4) restricts the estimation to constant returns to scale (CRS) which assumes that all
the units are producing at optimal scale. This may be considered restrictive since in reality all the units may
not be producing at their optimal scale. In other to allow that some of the units may not actually be
producing at optimal scale it is necessary to extend model (4) to include variables returns to scale. This is
achieved by simply adding the convexity constraint vector N1'   1 to the list of constraints in (4) where
 N1 is a vector of 1s. Coelli (1996) shows that this additional constraints form a convex of intersecting
planes which ensure that the data points are more tightly enveloped than the case under CRS. It is important
to note the practical effect of this additional constraint on the estimated efficiency. The efficiency level
obtained under assumptions on returns to scale is likely to be different. This is because in DEA efficiency
estimation, firms that exhibit variable returns to scale (VRS) are compared only with firms that are
operating at the same VRS. This implies that a firm that is operating on decreasing returns to scale and is
found to be efficient is efficient only in relation to other firms that are operating at similar scale or size.
Thus, DEA efficiency estimation using VRS generates a greater number of efficient firms than when
efficiency is estimated under CRS. By implication, a firm that obtains a 100% efficiency score under CRS
estimation cannot score less under a VRS assumption, but the converse is not necessarily true.
In general firms tend to score higher levels of efficiency under VRS than they do under CRS. An issue in
the literature is under what condition to use one rather the other. While Banxia Frontier notes that the
assumption of CRS technology is a reasonable one and is the one most widely used in DEA efficiency
estimations, Coelli (1996) argues that the use of CRS is more appropriate when all the units are operating at
full capacity because the estimates of technical efficiency could be confounded by scale efficiencies (SE).
In this case the use of VRS will permit the calculation of SE. The SE could be computed by noting the
simple relationship between the three types of inefficiency:
                   TEiCRS  TEiVRS * SEi  SEi  TEiCRS / TEiVRS                                          (5)

The DEA is a deterministic model. Since it is non-parametric, it requires no assumptions about the
functional form of the production function or cost frontier. However, it does not take into account the
stochastic properties of the data. Stochastic errors arise from several sources including the intrinsic
randomness of human behavior and inaccuracies arising from measurement.
Input-output optimization: An efficiency analyst has the option of conducting efficiency analysis by
estimating either input minimization or output maximization. According to Fare and Lovel (1978), the


                                                                                                                  4
European Journal of Business and Management                                                            www.iiste.org
ISSN 2222-1905 (Paper) ISSN 2222-2839 (Online)

efficiency estimates from the two technological orientations will only be equal if the firm is operating CRS
technology. However, Coelli (1996) suggests that given that the DEA is a linear programming model
which cannot suffer from econometric problems like simultaneous equation bias, it does not matter which
orientation one uses. He stresses that “the output- and –input-oriented models will estimate exactly the
same frontier and therefore, by definition, identify the same set of DMU’s as being efficient. It is only the
efficiency measures associated with the inefficient DMU’s that may differ between the two models” (p.24)
In any case, Coelli (1996) and Coeli and Perelman (1999), are of the view that the choice of the orientation
will have only a minor influence upon the scores obtained. It has been argued that in the context of hospital
the input orientation seems to be more appropriate since hospitals are expected to minimize their inputs into
the production function (see for example, Masiye 2007). However, we hold the view that in the context of
LICs with huge unmet health need, the output orientation seems to serve the society better as it implies that
hospitals have also the function of stimulating demand to expand their outputs for a given levels of health
production inputs. Further more, in many cases the inputs are already determined. For example in public
hospitals, it is usually difficult to reduce staff or even beds and the budget allocations which are given from
„above‟. This also applies in the case of private sector. It is always difficult to reduce the inputs, but there
are greater possibilities to use the available inputs to maximize outputs. In this study we adopted the output
maximization approach because we expected the health facilities to be maximizing their output at every
level of input. This is consistent with economic theory of “conspicuous production” which suggests that
hospitals generally pursue production-related objectives including maximization of outputs and quality
organization‟s status, and reputation (Ozcan et al. 1992, Davis, 1972, Lee, 1971).
Adjusting for Environmental Inputs: There are variables which may influence the efficiency level of a
unit but which may lie outside the management‟s control. This has been appropriately called X-efficiency
as distinct from technical efficiency (Note 1). These variables are considered to be non-traditional inputs
into the production process. Such factors in the context of hospitals may include location, ownership
structure, availability of community primary health care units, etc. Jacobs et al. (2006) note not taking into
account such environmental factors may lead to serious faulty conclusions about the level of efficiency of
the units. It is suggested that one way to take these into account is to divide the entire sample into sub-
samples. In this case the sample will be sub-divided on the basis of ownership structure: private, public and
not-for profit hospitals. Following Charnes et al. (1981), DEA is applied to each sub-group in turn. The
data points are then projected on to their frontiers. Subsequently, a single DEA is applied to the projected
data points to assess differences in the respective mean efficiencies of the sub-groups. Alternatively, the
environmental factor may be explicitly included as one of the inputs in the production function. In this case,
the efficiency of a unit can be compared with that of another DMU operating in a similar environment.
A major weakness of the DEA method of estimating efficiency is the flexibility built into the choice of
weight. As Coelli (1996) notes, since every unit is allowed to choose the weighting scheme that portrays it
in the most favorable light, a unit‟s choice may be unrelated to its inputs or outputs making it appear to be
efficient even though it is not. However, if, in spite of this latitude of choice of weighting scheme, a unit
appears inefficient, then it must be inefficient. The further problem with DEA is that since it does not make
any room for statistical noise, it regards any such noise as inefficiency (Nchare, 2005). It is also sensitive to
observations with high leverage. These weaknesses motivate the search for more appropriate methods of
efficiency measurement. Such search has given rise to econometric based techniques which are parametric
and make assumptions about the distribution of the error terms.
4. Survey Operations
The data set for this analysis was generated through a field survey conducted between January and Match
2009 in two states of southeast Nigeria, namely Enugu and Anambra states with a total population of about
9 million people as at 2006. The survey design was guided by the objective of generating a sample of
hospital facilities that is representative of the population of hospitals in the states. To achieve this, sampling
frames of hospitals in the two states were obtained from the respective SMoH to guide the selection of the
samples. There were altogether about a thousand health facilities (public and private) in the two states that
qualified to be included in the sample, but a sample of 200 hospitals was selected at random from this
frame. It is to be noted that there is a complete dominance of the health systems of both states by private


                                                                                                                5
European Journal of Business and Management                                                           www.iiste.org
ISSN 2222-1905 (Paper) ISSN 2222-2839 (Online)

medicine which accounts for over 75% of all the hospitals in the states (Ichoku, 2008). This distribution is
also reflected in the sample that was generated at the end of the survey.
A field survey using random sampling and the questionnaire technique was conducted between January and
March 2009 for the purpose of data generation. Experienced teams of field workers were hired and trained
and carried out satisfactory pretests before they were mobilized for the actual field survey. Given the long
distances between the hospitals and the need to collect accurate information, each team was instructed to
interview the chief medical officer or the proprietor of the health facility and to make a revisit if the chief
medical officer failed to keep the appointment. It was only when it was impossible to interview the chief
medical office or the proprietor of the facility that the next most responsible manager or senior officer was
interviewed. In spite of this, it was still necessary to revisit most of the hospitals several times, in some
cases up to six times before responses to the questionnaire were obtained. In several other cases, the
questionnaire had to be left with the respondents for weeks before they could be retrieved. However, all the
questionnaires were completed, giving a 100% rate of return.
Respondents were required to provide information on several key variables on inputs and outputs of the
hospital as shown in Table 1. The key outputs included the number of admissions, the number of
outpatients, the number of X-rays conducted at the X-ray department if this existed and the medical
laboratory of the hospitals. The variable inputs included the number of different categories of staff, the
number of beds and recurrent costs of services as well as capital costs such as building, expenditures on
electric generators, vehicles, etc. It also included information on ownership type, employment records and
drugs. Measurements of floor areas were also taken. Much of the information required the examination of
hospital records within the reference period of one month. The level of disaggregating the information was
also important if the performance of the hospitals were to be meaningfully compared. While the survey
recorded 100% retrieval, not all the hospitals provided information on each question. For example, many
hospitals were unable to provide information on the floor size of their establishments; this variable was
therefore not used in the analysis. The Banxia Frontier was used for the data analysis.
5. Empirical Results
5.1 Descriptive Statistics
As indicated in the preceding section, a total of 200 hospitals were sampled from both Enugu and Anambra
states. Special care was taken to ensure 100% return and this was achieved (i.e., 99 from Enugu state and
101 from Anambra). The distribution of the sample according to ownership status, number of beds and staff
strength is shown in Table 2. Using our operational definition of a private health facility provided above, a
total of 149 health facilities representing about 75% of the total health facilities covered in the survey are
classified as private while, 51 hospitals (or 25% of the total sample) are government owned health
facilities. Of the 149 private hospitals, 141 (70.5%) are private for-profit while 8 (4%) are mission
hospitals. This distribution reflects the actual distribution of these categories in the study population but not
the actual distribution by ownership across the country. This is because most states in the southeast and
southwest of Nigeria are dominated by private medicine while the health care system of those in the north
still depend largely on government provided health care (Nigeria Health System Assessment, 2008).
Table 2 indicates that while in terms of numerical strength, the for-profit health facilities dominate. In
terms of the average size of individual health facilities, they are usually far smaller than mission and
government health facilities. This is consistent with the earlier observation that for-profit health facilities
tend to be smaller. Most of them are solo-run unlike the public and mission hospitals that are usually better
equipped and usually employ larger numbers of staff. The table shows that the average number of staff and
beds in for-profit health facilities is about 12 and 16 respectively as against 55 and 122 for church run
hospitals and 20 and 21 for government health facilities.
In general, public hospitals employ on average about 1.6 doctors and about 18 staff and auxiliary nurses.
The private facilities employ on average 1.4 doctors and 8 nurses per hospital. More specifically, the ratio
of doctor to registered nurses is 1:4, while the ratio of nurse to beds is 1:2. Similarly, the average
expenditure on drug by public health facilities is about N660, 000 ($5,800) per annum on drugs as against
about N222, 000 ($US2,000) by the private hospitals.


                                                                                                               6
European Journal of Business and Management                                                         www.iiste.org
ISSN 2222-1905 (Paper) ISSN 2222-2839 (Online)

Table 3 shows the average sizes of inputs in the two states. The average input of beds in the production of
health services in Enugu is 23 per health facility. This is slightly higher than the 21.5 for Anambra state.
The use of input of doctors in the health production function is slightly more intensive in Anambra state
than in Enugu state while facilities in Enugu state use nurses more intensively. Surprisingly expenditure on
drugs per facility in Enugu state is almost double that in Anambra state while expenditure on electricity per
facility in Anambra state is half as much again as in Enugu state. This may reflect more intensive use of
generators in supplying power in Anambra than in Enugu. (Generally, power outage is a very common
phenomenon in Nigeria and most firms have to buy and fuel electric generators to supply power during
outages which may sometimes last for days.) Outpatients per health facility in Enugu state are significantly
higher than in Anambra state while the number of inpatients per facility in Anambra is higher than in
Enugu state. Also the production of laboratory services and X-rays per health facility is significantly higher
in Anambra than Enugu state.
5.2 The DEA Output
The results of the efficiency estimation show that the mean efficiency score of all the facilities included in
the sample under the DEA estimation, assuming CRS, is 59%. The mean score under the VRS assumption
is 72%. The mean scale efficiency score is 82.69% implying that about 17% of total inefficiency arose from
hospitals not operating at optimal scale. While these estimates appear to be low this has to be interpreted in
the context of the general DEA model estimations. Increasing the number of inputs or outputs even if these
additional variables are not completely relevant to efficiency measurement will increase the number of
efficient units and the efficiency scores generally. This is because such increases in number of variables
increases the dimensions of DEA‟s assessment of individual production units, and since each unit is always
assessed in the „best of light‟, even such efficiency-irrelevant variable could provide a dimension for an
inefficient unit to „shine‟ and thus appear efficient. Under CRS, 48 (24%) of all the facilities are 100%
efficient while under VRS, 85 (42.5%) of all the facilities scored 100%. This highlights the differences in
estimation under the two assumptions (as discussed above). The results of the CRS as estimated using the
Banxia Frontier DEA are summarized in figure 1.
The vertical axis in figure 1 represents the number of facilities scoring the given percentages. The
horizontal axis plots the interval of scores. For example, 4 health facilities scored between 0 and 10%, 32
between 21 and 30%, 18 between 71 and 80% and 48 scored 100%. From figure 1, it is evident that judged
by the CRS, many of the health facilities are not efficient. It is also pertinent to note that many of the
facilities are not operating optimally and therefore give rise to large scale inefficiencies. If the facilities
were operating at optimal scale, the average level of efficiency would increase by as much as 17% which is
the deviation of average SE from 100%. Further analyses show that 84 facilities (42%) of the total number
of facilities are operating on CRS. Another 94 (or 47%) are operating on decreasing returns; while only 22
(11%) are operating on increasing returns to scale. Thus a lot of efficiency gains could be achieved by
operating the facilities at their full capacity. But there are several reasons why most of them are short on
scale efficiency. Since many of the hospitals are small, it is likely that there are inadequate division of
labour and consequently lack of specialization which increases scale efficiency. On the other hand
decreasing returns to scale is usually associated with oversize and coordination failure. When a firm
increases in size, coordination problems begin to set in leading to decreasing outputs for proportionate
inputs (Note 2).
The details of the efficiency constraints responsible for inefficiency in each inefficient health unit have
been analyzed but have not been reported here in details. However, the results show that some inefficient
units were assessed to be so because they under-produced one output variable or the other relative to their
peers in the reference group. For example, hospital 4 was assessed to have used 20 beds in excess of the
requirement for its present level of output, implying that 20 beds were actually redundant in this hospital.
This assessment constitutes the basis for potential efficiency improvements as summarized in the next
subsection.
5.2.1 Potential Improvements
Table 4 summarizes the overall distribution of potential for improvements in outpatient admissions (OPD),
Inpatient admissions, laboratory and X-ray services. The table illustrates the fact that many health units
need to improve their output of OPD services given their current input variables. The column headings


                                                                                                             7
European Journal of Business and Management                                                          www.iiste.org
ISSN 2222-1905 (Paper) ISSN 2222-2839 (Online)

represent the required percentage range of improvements in a given output. The numbers represents the
number of health units requiring improvements in the various output variables. It indicates, for example,
that 50 of the health facilities need to improve the amount of output of outpatient services by between 0 to
10 percent. Five facilities need to improve on their performance with respect to outpatient attendance by
31-40%. Four units need to improve performance by 71 to 80% if they are to be efficient in respect of
outpatient services.
The potential for overall improvement of the sample units with respect to inpatient admissions is indicated
in row 2. The row indicates that 52 health units need to improve their performance with respect to inpatient
services by 0-10%, About 12 units need to improve output of inpatient services by between 61-70%. Eight
facility units need to improve by as much as 70-80%. Five need improvement by almost 100%. Similar
potential for improvements in the laboratory and X-ray services in the health facilities (Note 3) are shown
in last two rows where we also find that 51 and 50% units needs to improve their output of laboratory and
X-ray services respectively by between 0 and 10 percent. In general, these potentials for improvements in
outputs indicate the level of inefficiency that currently exists in most of the hospitals in the study area, and
this is reflected in the overall average efficiency.
5.2.2 The Efficient Reference Sets
In DEA models of efficiency analysis, efficient decision units are not efficient in absolute terms but only
relative to less efficient units. In assessing the efficiency of a particular unit, the estimation process
compares the performance of that unit with a set of other efficient units. The efficient unit with which a
given unit is assessed is its reference set. The performance of the efficient reference set in the various
dimensions of assessment shows why an inefficient unit is adjudged inefficient. This is very important for
management policy because it leads to the crucial question of why a given unit is unable to match the
performance of peers in its reference set. For example, in the estimated model hospital unit 17 was rated
inefficient and scored only 36% when assessed under the CRS technology. Its reference peers include units
1, 12, 27, 32, 33, 40, 57, 114, and 138 all of which had efficiency score of 100%. Comparing the
performance of unit 17 in relation to unit 1 shows that unit 17 produces just one third of outpatient services
as produced by unit 1, and 29% less of inpatient services as much as unit 1 for the same level of inputs.
Thus, the peer-review mechanism helps management to identify the sources of low score and how to
provide remedial actions. It also helps to identify the most efficient units in the sample as a whole. This is
because a hospital that is frequently used as a reference unit is being put up a model efficient unit that
others could learn from. Table 5 provides some of the most efficient units in the sample with the number of
times they are used as reference in the assessment of other units.
The unit in the table refers to the serial number of a given unit in the sample of 200 hospitals while the
reference count refers to the number of times the particular unit was used in assessment of other units. All
the units in the table scored 100% efficiency under the CRS and are therefore qualified to be used as
„model‟ for other hospitals. However, it is evident that not all the efficient units are equally efficient. Some
were efficient but could not be referenced in the assessment of other units. That is their reference count was
zero. Some were referenced just once or twice. Table 5 contains the list of efficient hospitals that have been
referenced more than twice in the assessment of other hospitals. Units 94, 37 and 32 were referenced only 3
times. Unit 2 was referenced 11 times. Unit 7 was referenced 34 times while unit 33 was referenced 142
times implying that it is the best overall efficient hospital in the sample. The most referenced units
therefore provide lessons in efficiency for the inefficient units.
In general there is a wide range of differences between the technical efficiency scores of the hospitals in the
group ranging from the lowest of 7.5% to the highest of 100% implying that some hospitals are using
resources to produce more than 10 times what other hospitals are producing with similar level of resources.
Table 6 provides two illustrative examples of technical operational adjustments required to maximize the
efficiency of units.
Table 6 indicates the hospital unit 4 in the sample of 200 had efficiency score of 57.55, its current use of
other staff is considered inefficient because it can actually reduce this input by 54% and still maintain the
current output levels. Similarly the same unit 4 is using more nurses and beds than it‟s current level of
production requires and needs to reduce the use of nurses by 59%, reduce the number of beds by 17%. It


                                                                                                              8
European Journal of Business and Management                                                          www.iiste.org
ISSN 2222-1905 (Paper) ISSN 2222-2839 (Online)

can also increase its outputs of OPD by 73%, inpatients by 222%, and laboratory tests by 74% and X-ray
by 74%. For unit 76 which scored only 33.70%, its use of „other staff‟ and beds are efficient, but its use of
nurses and doctors is inefficient. At the same time it has great potential to improve on its current outputs of
OPD, inpatients, laboratory tests and X-ray outputs. For each of all the other inefficient units, such
calculations are produced which enables the hospital managers to rationalize their use of resources in other
to achieve efficiency relative to their peers.
5.2.3 Returns to Scale and Scale Efficiency
As expected, there are significant differences in the estimated efficiency scores under the CRS and VRS,
and the SE. The estimated mean efficiency scores were 59.39, 72.88 and 82.69 respectively. A total of 49
hospitals of the 200 sample units were efficient under the CRS; 85 were efficient under VRS and 72 had
100% scale efficiency. As noted above, the large difference between the estimates of CRS and VRS is due
to the fact that CRS assumes that all units are operating optimal scale. When this is not the case, the
estimates are confounded by scale inefficiencies.
Of the total sample, 22 hospitals or 11% of the sample operated increasing returns to scale; 84 (42%)
operated at constant returns to scale while 94 representing about 47% of the toal operated decreasing
returns to scale. An important observation from the estimation is that there is a high level of correlation
between scale at which a unit is operating and the level of efficiency. More importantly efficient hospitals
seem to operate constant returns to scale technology. For example, 84 out of the 85 hospitals that scored
100% efficiency under the VRS technology assumption operated constant returns to scale and only one
operated decreasing returns to scale while none operated increasing returns. Similarly, under the CRS
technology assumption all the 49 hospitals that recorded 100% efficiency operated constant returns to scale.
Of the 72 hospitals that had 100% scale efficiency, 21 operated increasing returns, 49 operated constant
returns while only 2 had decreasing returns. This suggests that constant returns to scale is more efficient
technology for hospitals. Following our earlier observations, constant returns to scale imply that the firm is
sufficiently specialized and yet, it is not loosing productivity on account of managerial coordination
problems that are associated with complex organizations which lead to decreasing returns to scale.
6. Conclusion
The aim of this study has been to provide first hand empirical information about the technical efficiency of
hospitals in the southeast of Nigeria with the hope that this can provide some lessons for the hospital sector
of many LICs. This is considered critical in view of the scarcity of resources and the severe implications of
inefficient utilization of available resources for saving lives.
This study provides empirical evidence from Nigeria of the efficiency rates of the hospitals in the facilities
under both the CRS and VRS assumptions. Under the CRS method the estimated average efficiency rate is
59% while under the VRS it is 72% on average. The average scale efficiency is 82%. However, the study
reports also wide variations between the best and worst performers in the system under the three
dimensions. Under the CRS assumption only 48 (or 24%) of the 200 health facilities in the sample were
identified as efficient. This compared with the situation under the VRS where 85 (42.5%) of the facilities
were identified as efficient. The large differences in these results arose because, as noted, CRS compares
the efficiency of each unit in relation to all the efficient units in the sample while VRS compares the
efficiency of each unit in relation to only units in the sample operating at the same scale as the unit under
assessment. In other words, VRS calculates efficiency devoid of scale inefficiencies while CRS may be
confounded by scale inefficiencies. By dividing the CRS with VRS scores, the SE values are obtained. The
mean loss in efficiency for many of the facilities is due to their operating at suboptimal levels. As noted
above the efficiency scores under DEA must be interpreted with caution and in context. This is because of
the tendency of the method to „inflate‟ the efficiency scores as the number of input variables and/or output
variables increases even if the additional variables are not altogether relevant for efficiency considerations.
The analysis also identified why any given inefficient unit was inefficient relative to the efficient ones. This
yielded critical management information about the potential improvements that could be made to improve
the efficiency of each inefficient unit. This paper provides limited examples of how much each inefficient
unit must reduce its input or increase each output to become efficient. However, it is possible that some
facilities may expend resources to ensure quality environment for its patients or one that hires


                                                                                                              9
European Journal of Business and Management                                                         www.iiste.org
ISSN 2222-1905 (Paper) ISSN 2222-2839 (Online)

compassionate health staff may be rated less efficient than one whose staff are rude and lacking in
compassion just on the basis of output. This is an important weakness of this study and needs to be taken
into account. The study, however, was able to identify the most outstanding performers in the sample set.
As noted above, these efficient performers are by no means efficient in all aspects of their operation, the
DEA method adjudged them to be efficient in some respects either in input or output variables, though
some consistently showed efficiency in almost all dimensions.
A key lesson from this study is the potential large variation in the efficiency of health facilities in many
LlCs as evidence from this case study. The study shows that even by the most optimistic standards about
the efficiency scores, large gains could be made in the health sector if the health facilities were to become
more efficient in their operation. By CRS estimation, improvements of 40% could be obtained and by VRS
standard, improvements of up to 26% could be attained in terms of facilities efficiency. Any of these
figures is a huge resources gain in a resource-constrained environment given the poor health profile of
many LICs. The economic welfare implications of the results are also not lost. What this implies is that
given the prevailing level of inefficiency, society and households could make appreciable welfare gains if
the hospitals were to become efficient. Inefficient hospitals could be passing on to their poor patients the
cost of their inefficiencies in order to remain in business.
The estimated levels of inefficiency call for far reaching measures to secure a higher level of efficiency in
the hospital sector. For instance, given the level of scale inefficiency in the system alone, the health system
regulatory authorities could device better incentives in the form of higher resource allocations to hospitals
that are identified as efficient. It could also provide incentives for merging of higher operational scales so
that health facilities could gain scale economies and share of expertise.

References
Banker, R.D., Conrad. R.F. & Straus, R.P (1986). A comparative application of Data Envelopment
Analysis and Translog methods: an illustrative study of hospital production. Journal of Management
Sciences. 37:30-43

Binger, B.R & Hoffman, E. (1998). Microeconomics with Calculus, 2nd ed. Reading: Addison-Wesley

Button, K.J. & Weyman-Jones, T.G. (1992). Ownership structure, institutional organization and measured
X-efficiency. The American Economic Review. 62(2) 439-445

Chakravarty, S.R. (2002). Microeconomics, New Delhi: Allied Publishers

Charnes, A. Cooper, W.W. and Rhodes, E. (1981) “Evaluating program and managerial efficiency: an
application of Data Envelopment Analysis to program follow through” Management Science 27:667-697

Charnes, A. Cooper, W.W. and Rhodes E. (1978). Measuring the efficiency decision making units”
European Journal of Operations Research, 2:429-444

Coelli, T.J. (1996). A Guide to FRONTIER Version 4.1: A Computer Program for Stochastic Production
and Cost Function Estimation. CEPA Working Papers No. 7/96. Department of Econometrics, University
of New England.

Dyson R.G, Thanassoulis, E. & Boussofiane,                   A.   (1990).   Data    Envelopment      Analysis.
http://www.warwick.ac.uk/-bsrlu/dea/deat/deat1htm

Fare, R. & Lovell. C.A.K. (1978). Measuring the technical efficiency of production. Journal of Economic
Theory. 19:150-162.

Farrell, M.J. (1957). The measurement of productive efficiency. Journal of the Royal Statistical Society.
120:252-281


                                                                                                            10
European Journal of Business and Management                                                          www.iiste.org
ISSN 2222-1905 (Paper) ISSN 2222-2839 (Online)

Ichoku, H.E., Fonta M.W., & Onwujekwe, O. (2009). Incidence and intensity of catastrophic health
financing and impoverishment due to out-of-pocket payments in southeast Nigeria. Journal of Insurance
and Risk Management. IV (4), 47-59.

Ichoku, H.E. (2008). Anambra State of Nigeria: Public Expenditure Review of the Health Sector. A Report
for EU-SRIP, Abuja, Nigeria.

Ityavyar, D.A. (1988). Health services inequalities in Nigeria. Social Science & Medicine. 27 (11), 1223-
1235.

Jacobs, R. Smith, P.C., & Street, A. (2006). Measuring Efficiency in Health Care: Analytic Techniques
and Health Policy. Cambridge: Cambridge University Press

Kirigia, J.M. et al. (2004). Using Data Envelopment Analysis to measurement the technical efficiency of
public health centers in Kenya. Journal of Medical Systems. 28(2) 155-166.

Leibenstein, H. (1977). X-efficiency, technical efficiency, and incomplete information use: a comment.
Economic Development and Cultural Change. 25:311-16a”.

Nwosu, E. J. (2000). The Challenge of Poverty in Africa. Skillmark Media Ltd., Owerri.

Ozcan, Y.A., Luke, R.D., & Haksever, G. (1992). Ownership and organization performance: a comparison
of technical efficiency across hospital types. Medical Care. 30(9)781-794


Notes
Note 1. While technical efficiency has to do with the technique of combining inputs to produce output, X-
efficiency has to do with influences outside the control or knowledge of the management (Button &
Weyman-Jones, 1992 and Leibenstein, 1977).
Note 2. This is consistent with modern neoclassical economic growth theories that consider increasing
returns to scale as an out-come of technological progress. When a small firm operating with labor and
capital indivisibilities starts to expand on account of greater division of labor and specialization, then the
firm is gaining the advantage of technology change or technical progress in the process of production. In
the case of decreasing returns to scale the advantages of specialization is being outweighed by managerial
difficulties associated with complex organizations.
Note 3. It may be noted that these potential improvements in services do not necessarily imply that all the
facilities are currently offering these services. But the estimation assumes that their efficient counterparts
are offering these services and therefore they are assessed based on the standard of the efficient units.


Table 1: The Inputs/Outputs Variables Used in the Analyis
 Variable                   Symbol         Definition
 Output variables
 Outpatient                 anOP1          No of outpatients treated in the facility in the last one year
 Inpatients                 anOP2          No of inpatient admissions
 Lab test                   anOP3          No of laboratory tests conducted


                                                                                                            11
European Journal of Business and Management                                                      www.iiste.org
ISSN 2222-1905 (Paper) ISSN 2222-2839 (Online)

 X-rays                   anOP4            No. of X-rays attended

 Input variables
 Beds                     Beds             No of beds in the facility
 Doctors                  acstaff1         No of patients
 Pharmacists              acstaff2         No of pharmacists employed by the facility
 Nurses                   regaux           No of registered and auxiliary nurses employed
 Other staff              Staff4           No of other paramedical staff employed
 Drug                     Drug             Annual expenditure on drugs
 Power                    Elect            Annual expenditure on power including running of generators
 Equipment                Equip            Annual expenditure on equipment including maintenance
 Location                 loc              A dummy variable for urban or rual location
 State                    State            A dummy for whether a facility is in Enugu or Anambra state
 Ownership                ownership        A dummy for ownership status – government or private


Table 2: Distribution of health facilities by ownership
                                              Mean              Std. Dev.           Min.         Max.
 Public
 Beds                                         21.90                  28.59              0         199
 Staff                                        20.02                  21.12             12         120
 Private: For Profit
 Beds                                         15.98                   8.77              0          56
 Staff                                        12.26                  11.02              1         118
 Private: Mission
 Beds                                        122.38                  88.15             25         255
 Staff                                        55.38                  45.72              8         150

Table 3: Distribution of Means of Variables by State
                      State 1: Enugu State                          State 2: Anambra State
 S    Variable         Obs.    Mean            Std. Dev.            Obs.     Mean            Std. Dev.
 n
      Ouputs
 1    Outpatients       99        1447.39          4794.291          101       819.32           996.38
 2    Inpatients        99        366.66           588.1205          101       389.35           522.59
 3    Lab tests         99        405.58           625.6414          101       588.83           648.19
 4    X-rays            99         67.75           180.7032          101       113.34           183.31
      Inputs
 5    Beds              99         23.0            32.07214          101        20.51            30.10
 6    Doctors           99         1.35            1.560436          101        1.60             2.38
 7    Pharmacists       99         0.65            1.327212          101        0.43             0.89
 8    Nurses            99         14.40               45.35         101        8.05             6.51
 9    Drug              99      406141.40             2000727        101       262105          219215.8
 10   Elect             99      198521.20          191512.9          101      313166.3         270424.8


                                                                                                         12
European Journal of Business and Management                                                                 www.iiste.org
ISSN 2222-1905 (Paper) ISSN 2222-2839 (Online)

 11    Equipment           99     346412.10            582960.1          101          324906.9         193547.9

Table 4: Summary of Distribution of Potential Improvements for Different Output Variables
                                              Percentage Improvement Required
 Output              0-10       11-20     21-30     31-40   41-50    51-60       61-70    71-80            81-90   91-100
 OPD                   50         1             2     5       0          3           5           4           1           1
 Inpatient             52         5            12     6       3          5           12          8           1           5
 Admins
 Lab Services          51         4            11     6       2          5           13          6           1           6
 X-ray                 50         3            11     4       3          3           5           4           1           2

Table 5: Most Efficient Units
   Unit         Ref Count               Unit         Ref      Unit            Ref            Unit             Ref Count
                                                    Count                    Count
      33             142                114          27        2              11             128                   5
      25             104                120          26        5              10             176                   4
      28             89                 159          21       34              10             160                   4
      40             83                  41          15       200              7             147                   4
      138            59                 162          12       163              7             132                   4
       6             49                 113          12       156              7             94                    3
       7             34                  87          11       140              6             37                    3
      50             31                  39          11        3               5             32                    3

Table 6: Sources of Inefficiency in Inefficient Hospitals
 UNIT 4 Efficiency        Current Potential %                     UNIT         Efficiency        Current     Potential       %reduction/
           Score:                               Reduction/        76           Score:                                        increase
           57.5%                                increase                       33.70%
 Inputs    Other staff          6        2.76        -53.98                    Other staff             2           2                  0
           Nurses              12        4.91        -59.05                    Nurses                  7        4.94             -29.49
           Pharmacists          0           0             0                    Pharmacists             0           0                  0
           Doctors              1        0.92         -7.67                    Doctors                 1         0.5             -50.43
           beds                20      16.58         -17.12                    Beds                    8           8                  0
 Outputs OPD                   72     125.17          73.85       Outputs      OPD                     0       101.1           10110.86
           Inpatients         168      540.8        221.91                     Inpatients            300     1147.84             282.61
           Lab                360     625.85          73.85                    Lab                   216      640.01              196.3
           X-ray             1128 1961.01             73.85                    X-ray                 540     1600.03              196.3


                                                                                                                   13
European Journal of Business and Management                       www.iiste.org
ISSN 2222-1905 (Paper) ISSN 2222-2839 (Online)


Figure 1: Distribution of Efficiency Scores of Health Hospitals


                                                                        14

More Related Content

What's hot

Application of ICT for Clinical Care Improvement
Application of ICT for Clinical Care ImprovementApplication of ICT for Clinical Care Improvement
Application of ICT for Clinical Care ImprovementNawanan Theera-Ampornpunt
 
Medical Informatics: A Look From USA To Thailand (Paper)
Medical Informatics: A Look From USA To Thailand (Paper)Medical Informatics: A Look From USA To Thailand (Paper)
Medical Informatics: A Look From USA To Thailand (Paper)Nawanan Theera-Ampornpunt
 
Overview of Health Informatics (October 7, 2020)
Overview of Health Informatics (October 7, 2020)Overview of Health Informatics (October 7, 2020)
Overview of Health Informatics (October 7, 2020)Nawanan Theera-Ampornpunt
 
The Paths Toward Informatics Careers in the Post-HITECT Era
The Paths Toward Informatics Careers in the Post-HITECT EraThe Paths Toward Informatics Careers in the Post-HITECT Era
The Paths Toward Informatics Careers in the Post-HITECT EraNawanan Theera-Ampornpunt
 
Hospital IT Management (บรรยาย ณ รพ.นครนายก 22 ม.ค. 2559)
Hospital IT Management (บรรยาย ณ รพ.นครนายก 22 ม.ค. 2559)Hospital IT Management (บรรยาย ณ รพ.นครนายก 22 ม.ค. 2559)
Hospital IT Management (บรรยาย ณ รพ.นครนายก 22 ม.ค. 2559)Nawanan Theera-Ampornpunt
 
IMPLEMENTING ELECTRONIC HEALTH RECORDS IN NEW ZEALAND: A CRITICAL APPRAISAL O...
IMPLEMENTING ELECTRONIC HEALTH RECORDS IN NEW ZEALAND: A CRITICAL APPRAISAL O...IMPLEMENTING ELECTRONIC HEALTH RECORDS IN NEW ZEALAND: A CRITICAL APPRAISAL O...
IMPLEMENTING ELECTRONIC HEALTH RECORDS IN NEW ZEALAND: A CRITICAL APPRAISAL O...hiij
 
Turkey Health System. Health economics and politics.
Turkey Health System. Health economics and politics.Turkey Health System. Health economics and politics.
Turkey Health System. Health economics and politics.Mustafa Said YILDIZ
 
Departmental Information Systems and Management Information Systems in Health...
Departmental Information Systems and Management Information Systems in Health...Departmental Information Systems and Management Information Systems in Health...
Departmental Information Systems and Management Information Systems in Health...Nawanan Theera-Ampornpunt
 
Developing_a_person-based_resource_allocation_formula_REPORT
Developing_a_person-based_resource_allocation_formula_REPORTDeveloping_a_person-based_resource_allocation_formula_REPORT
Developing_a_person-based_resource_allocation_formula_REPORTNadya Filipova
 
Assessment of health care providers (wb)
Assessment of health care providers (wb)Assessment of health care providers (wb)
Assessment of health care providers (wb)Serod Ichinkhorloo
 
Strengthening Health Systems: Lessons Learned from 2nd Decade of Thailand’s U...
Strengthening Health Systems: Lessons Learned from 2nd Decade of Thailand’s U...Strengthening Health Systems: Lessons Learned from 2nd Decade of Thailand’s U...
Strengthening Health Systems: Lessons Learned from 2nd Decade of Thailand’s U...Borwornsom Leerapan
 
K-Nearest Neighbours based diagnosis of hyperglycemia
K-Nearest Neighbours based diagnosis of hyperglycemiaK-Nearest Neighbours based diagnosis of hyperglycemia
K-Nearest Neighbours based diagnosis of hyperglycemiaijtsrd
 
Introduction to Health Informatics and Health IT (Part 1) (February 10, 2021)
Introduction to Health Informatics and Health IT (Part 1) (February 10, 2021)Introduction to Health Informatics and Health IT (Part 1) (February 10, 2021)
Introduction to Health Informatics and Health IT (Part 1) (February 10, 2021)Nawanan Theera-Ampornpunt
 
Strengthening Primary Care Through Performance - Based Incentive System
Strengthening Primary Care Through Performance - Based Incentive SystemStrengthening Primary Care Through Performance - Based Incentive System
Strengthening Primary Care Through Performance - Based Incentive SystemHFG Project
 

What's hot (20)

It For Better Patient Care
It For Better Patient CareIt For Better Patient Care
It For Better Patient Care
 
Application of ICT for Clinical Care Improvement
Application of ICT for Clinical Care ImprovementApplication of ICT for Clinical Care Improvement
Application of ICT for Clinical Care Improvement
 
Medical Informatics: A Look From USA To Thailand (Paper)
Medical Informatics: A Look From USA To Thailand (Paper)Medical Informatics: A Look From USA To Thailand (Paper)
Medical Informatics: A Look From USA To Thailand (Paper)
 
Overview of Health Informatics (October 7, 2020)
Overview of Health Informatics (October 7, 2020)Overview of Health Informatics (October 7, 2020)
Overview of Health Informatics (October 7, 2020)
 
The Paths Toward Informatics Careers in the Post-HITECT Era
The Paths Toward Informatics Careers in the Post-HITECT EraThe Paths Toward Informatics Careers in the Post-HITECT Era
The Paths Toward Informatics Careers in the Post-HITECT Era
 
ICT in Healthcare (March 8, 2019)
ICT in Healthcare (March 8, 2019)ICT in Healthcare (March 8, 2019)
ICT in Healthcare (March 8, 2019)
 
Hospital IT Management (บรรยาย ณ รพ.นครนายก 22 ม.ค. 2559)
Hospital IT Management (บรรยาย ณ รพ.นครนายก 22 ม.ค. 2559)Hospital IT Management (บรรยาย ณ รพ.นครนายก 22 ม.ค. 2559)
Hospital IT Management (บรรยาย ณ รพ.นครนายก 22 ม.ค. 2559)
 
IMPLEMENTING ELECTRONIC HEALTH RECORDS IN NEW ZEALAND: A CRITICAL APPRAISAL O...
IMPLEMENTING ELECTRONIC HEALTH RECORDS IN NEW ZEALAND: A CRITICAL APPRAISAL O...IMPLEMENTING ELECTRONIC HEALTH RECORDS IN NEW ZEALAND: A CRITICAL APPRAISAL O...
IMPLEMENTING ELECTRONIC HEALTH RECORDS IN NEW ZEALAND: A CRITICAL APPRAISAL O...
 
Pavia wsp october 2011
Pavia wsp october 2011Pavia wsp october 2011
Pavia wsp october 2011
 
Turkey Health System. Health economics and politics.
Turkey Health System. Health economics and politics.Turkey Health System. Health economics and politics.
Turkey Health System. Health economics and politics.
 
ICT in Healthcare
ICT in HealthcareICT in Healthcare
ICT in Healthcare
 
Departmental Information Systems and Management Information Systems in Health...
Departmental Information Systems and Management Information Systems in Health...Departmental Information Systems and Management Information Systems in Health...
Departmental Information Systems and Management Information Systems in Health...
 
Developing_a_person-based_resource_allocation_formula_REPORT
Developing_a_person-based_resource_allocation_formula_REPORTDeveloping_a_person-based_resource_allocation_formula_REPORT
Developing_a_person-based_resource_allocation_formula_REPORT
 
Assessment of health care providers (wb)
Assessment of health care providers (wb)Assessment of health care providers (wb)
Assessment of health care providers (wb)
 
Digital Health Transformation: What's Next?
Digital Health Transformation: What's Next?Digital Health Transformation: What's Next?
Digital Health Transformation: What's Next?
 
Strengthening Health Systems: Lessons Learned from 2nd Decade of Thailand’s U...
Strengthening Health Systems: Lessons Learned from 2nd Decade of Thailand’s U...Strengthening Health Systems: Lessons Learned from 2nd Decade of Thailand’s U...
Strengthening Health Systems: Lessons Learned from 2nd Decade of Thailand’s U...
 
K-Nearest Neighbours based diagnosis of hyperglycemia
K-Nearest Neighbours based diagnosis of hyperglycemiaK-Nearest Neighbours based diagnosis of hyperglycemia
K-Nearest Neighbours based diagnosis of hyperglycemia
 
Management M Report
Management M ReportManagement M Report
Management M Report
 
Introduction to Health Informatics and Health IT (Part 1) (February 10, 2021)
Introduction to Health Informatics and Health IT (Part 1) (February 10, 2021)Introduction to Health Informatics and Health IT (Part 1) (February 10, 2021)
Introduction to Health Informatics and Health IT (Part 1) (February 10, 2021)
 
Strengthening Primary Care Through Performance - Based Incentive System
Strengthening Primary Care Through Performance - Based Incentive SystemStrengthening Primary Care Through Performance - Based Incentive System
Strengthening Primary Care Through Performance - Based Incentive System
 

Similar to Evaluating Technical Efficiency of Hospitals in Southeast Nigeria

GH Workforce Taskshifting: Joseph Babigumira & Lou Garrison
GH Workforce Taskshifting: Joseph Babigumira & Lou GarrisonGH Workforce Taskshifting: Joseph Babigumira & Lou Garrison
GH Workforce Taskshifting: Joseph Babigumira & Lou GarrisonUWGlobalHealth
 
Factors Affecting Retention of Human Resources for Health in TRANS-NZOIA Coun...
Factors Affecting Retention of Human Resources for Health in TRANS-NZOIA Coun...Factors Affecting Retention of Human Resources for Health in TRANS-NZOIA Coun...
Factors Affecting Retention of Human Resources for Health in TRANS-NZOIA Coun...paperpublications3
 
eHealth : the promise of ICT for improving health in Africa
eHealth : the promise of ICT for improving health in AfricaeHealth : the promise of ICT for improving health in Africa
eHealth : the promise of ICT for improving health in AfricaFrancisco J Grajales III
 
e-Health evidence and evalaution
e-Health evidence and evalautione-Health evidence and evalaution
e-Health evidence and evalautione-Marefa
 
mHealth Israel_Guy Eiferman_Healthcare Services_Merck & Co.
mHealth Israel_Guy Eiferman_Healthcare Services_Merck & Co.mHealth Israel_Guy Eiferman_Healthcare Services_Merck & Co.
mHealth Israel_Guy Eiferman_Healthcare Services_Merck & Co.Levi Shapiro
 
16072-EMC-HealthcareIDC-eBook-1.27
16072-EMC-HealthcareIDC-eBook-1.2716072-EMC-HealthcareIDC-eBook-1.27
16072-EMC-HealthcareIDC-eBook-1.27Simona Vellani
 
16072 emc-healthcare idc-ebook-1.27
16072 emc-healthcare idc-ebook-1.2716072 emc-healthcare idc-ebook-1.27
16072 emc-healthcare idc-ebook-1.27Simona Vellani
 
Application Of Concept Analysis For Clinical Practice
Application Of Concept Analysis For Clinical PracticeApplication Of Concept Analysis For Clinical Practice
Application Of Concept Analysis For Clinical PracticeJennifer York
 
Technology on clinical service delivery among caregivers and patients in maku...
Technology on clinical service delivery among caregivers and patients in maku...Technology on clinical service delivery among caregivers and patients in maku...
Technology on clinical service delivery among caregivers and patients in maku...Alexander Decker
 
Availability and Utilization of Health Informatics System among Health Worker...
Availability and Utilization of Health Informatics System among Health Worker...Availability and Utilization of Health Informatics System among Health Worker...
Availability and Utilization of Health Informatics System among Health Worker...ijtsrd
 
E health in Nigeria Current Realities and Future Perspectives. A User Centric...
E health in Nigeria Current Realities and Future Perspectives. A User Centric...E health in Nigeria Current Realities and Future Perspectives. A User Centric...
E health in Nigeria Current Realities and Future Perspectives. A User Centric...Ibukun Fowe
 
Chapter 19Estimates, Benchmarking, and Other Measuremen
Chapter 19Estimates, Benchmarking, and Other MeasuremenChapter 19Estimates, Benchmarking, and Other Measuremen
Chapter 19Estimates, Benchmarking, and Other MeasuremenEstelaJeffery653
 
An IT Approach to Improve the Compilation of Clinical Access Indicators and D...
An IT Approach to Improve the Compilation of Clinical Access Indicators and D...An IT Approach to Improve the Compilation of Clinical Access Indicators and D...
An IT Approach to Improve the Compilation of Clinical Access Indicators and D...Editor IJCATR
 
Information Technology in Animal Health Care System
Information Technology in Animal Health Care SystemInformation Technology in Animal Health Care System
Information Technology in Animal Health Care SystemIJCSIS Research Publications
 
Ivo Pezzuto - Making Healthcare Systems More Efficient and Sustainable in Eme...
Ivo Pezzuto - Making Healthcare Systems More Efficient and Sustainable in Eme...Ivo Pezzuto - Making Healthcare Systems More Efficient and Sustainable in Eme...
Ivo Pezzuto - Making Healthcare Systems More Efficient and Sustainable in Eme...Dr. Ivo Pezzuto
 
An appraisal of open system business policy model
An appraisal of open system business policy modelAn appraisal of open system business policy model
An appraisal of open system business policy modelAlexander Decker
 
‘Enabling technologies’ and ‘user participation’ as main factors
‘Enabling technologies’ and ‘user participation’ as main factors‘Enabling technologies’ and ‘user participation’ as main factors
‘Enabling technologies’ and ‘user participation’ as main factorsAlexander Decker
 

Similar to Evaluating Technical Efficiency of Hospitals in Southeast Nigeria (20)

GH Workforce Taskshifting: Joseph Babigumira & Lou Garrison
GH Workforce Taskshifting: Joseph Babigumira & Lou GarrisonGH Workforce Taskshifting: Joseph Babigumira & Lou Garrison
GH Workforce Taskshifting: Joseph Babigumira & Lou Garrison
 
Factors Affecting Retention of Human Resources for Health in TRANS-NZOIA Coun...
Factors Affecting Retention of Human Resources for Health in TRANS-NZOIA Coun...Factors Affecting Retention of Human Resources for Health in TRANS-NZOIA Coun...
Factors Affecting Retention of Human Resources for Health in TRANS-NZOIA Coun...
 
eHealth : the promise of ICT for improving health in Africa
eHealth : the promise of ICT for improving health in AfricaeHealth : the promise of ICT for improving health in Africa
eHealth : the promise of ICT for improving health in Africa
 
e-Health evidence and evalaution
e-Health evidence and evalautione-Health evidence and evalaution
e-Health evidence and evalaution
 
mHealth Israel_Guy Eiferman_Healthcare Services_Merck & Co.
mHealth Israel_Guy Eiferman_Healthcare Services_Merck & Co.mHealth Israel_Guy Eiferman_Healthcare Services_Merck & Co.
mHealth Israel_Guy Eiferman_Healthcare Services_Merck & Co.
 
J0956064
J0956064J0956064
J0956064
 
16072-EMC-HealthcareIDC-eBook-1.27
16072-EMC-HealthcareIDC-eBook-1.2716072-EMC-HealthcareIDC-eBook-1.27
16072-EMC-HealthcareIDC-eBook-1.27
 
16072 emc-healthcare idc-ebook-1.27
16072 emc-healthcare idc-ebook-1.2716072 emc-healthcare idc-ebook-1.27
16072 emc-healthcare idc-ebook-1.27
 
Application Of Concept Analysis For Clinical Practice
Application Of Concept Analysis For Clinical PracticeApplication Of Concept Analysis For Clinical Practice
Application Of Concept Analysis For Clinical Practice
 
F026044051
F026044051F026044051
F026044051
 
Technology on clinical service delivery among caregivers and patients in maku...
Technology on clinical service delivery among caregivers and patients in maku...Technology on clinical service delivery among caregivers and patients in maku...
Technology on clinical service delivery among caregivers and patients in maku...
 
Availability and Utilization of Health Informatics System among Health Worker...
Availability and Utilization of Health Informatics System among Health Worker...Availability and Utilization of Health Informatics System among Health Worker...
Availability and Utilization of Health Informatics System among Health Worker...
 
E health in Nigeria Current Realities and Future Perspectives. A User Centric...
E health in Nigeria Current Realities and Future Perspectives. A User Centric...E health in Nigeria Current Realities and Future Perspectives. A User Centric...
E health in Nigeria Current Realities and Future Perspectives. A User Centric...
 
Chapter 19Estimates, Benchmarking, and Other Measuremen
Chapter 19Estimates, Benchmarking, and Other MeasuremenChapter 19Estimates, Benchmarking, and Other Measuremen
Chapter 19Estimates, Benchmarking, and Other Measuremen
 
An IT Approach to Improve the Compilation of Clinical Access Indicators and D...
An IT Approach to Improve the Compilation of Clinical Access Indicators and D...An IT Approach to Improve the Compilation of Clinical Access Indicators and D...
An IT Approach to Improve the Compilation of Clinical Access Indicators and D...
 
Information Technology in Animal Health Care System
Information Technology in Animal Health Care SystemInformation Technology in Animal Health Care System
Information Technology in Animal Health Care System
 
Ivo Pezzuto - Making Healthcare Systems More Efficient and Sustainable in Eme...
Ivo Pezzuto - Making Healthcare Systems More Efficient and Sustainable in Eme...Ivo Pezzuto - Making Healthcare Systems More Efficient and Sustainable in Eme...
Ivo Pezzuto - Making Healthcare Systems More Efficient and Sustainable in Eme...
 
An appraisal of open system business policy model
An appraisal of open system business policy modelAn appraisal of open system business policy model
An appraisal of open system business policy model
 
Upload ijsrp p10078
Upload ijsrp p10078Upload ijsrp p10078
Upload ijsrp p10078
 
‘Enabling technologies’ and ‘user participation’ as main factors
‘Enabling technologies’ and ‘user participation’ as main factors‘Enabling technologies’ and ‘user participation’ as main factors
‘Enabling technologies’ and ‘user participation’ as main factors
 

More from Alexander Decker

Abnormalities of hormones and inflammatory cytokines in women affected with p...
Abnormalities of hormones and inflammatory cytokines in women affected with p...Abnormalities of hormones and inflammatory cytokines in women affected with p...
Abnormalities of hormones and inflammatory cytokines in women affected with p...Alexander Decker
 
A validation of the adverse childhood experiences scale in
A validation of the adverse childhood experiences scale inA validation of the adverse childhood experiences scale in
A validation of the adverse childhood experiences scale inAlexander Decker
 
A usability evaluation framework for b2 c e commerce websites
A usability evaluation framework for b2 c e commerce websitesA usability evaluation framework for b2 c e commerce websites
A usability evaluation framework for b2 c e commerce websitesAlexander Decker
 
A universal model for managing the marketing executives in nigerian banks
A universal model for managing the marketing executives in nigerian banksA universal model for managing the marketing executives in nigerian banks
A universal model for managing the marketing executives in nigerian banksAlexander Decker
 
A unique common fixed point theorems in generalized d
A unique common fixed point theorems in generalized dA unique common fixed point theorems in generalized d
A unique common fixed point theorems in generalized dAlexander Decker
 
A trends of salmonella and antibiotic resistance
A trends of salmonella and antibiotic resistanceA trends of salmonella and antibiotic resistance
A trends of salmonella and antibiotic resistanceAlexander Decker
 
A transformational generative approach towards understanding al-istifham
A transformational  generative approach towards understanding al-istifhamA transformational  generative approach towards understanding al-istifham
A transformational generative approach towards understanding al-istifhamAlexander Decker
 
A time series analysis of the determinants of savings in namibia
A time series analysis of the determinants of savings in namibiaA time series analysis of the determinants of savings in namibia
A time series analysis of the determinants of savings in namibiaAlexander Decker
 
A therapy for physical and mental fitness of school children
A therapy for physical and mental fitness of school childrenA therapy for physical and mental fitness of school children
A therapy for physical and mental fitness of school childrenAlexander Decker
 
A theory of efficiency for managing the marketing executives in nigerian banks
A theory of efficiency for managing the marketing executives in nigerian banksA theory of efficiency for managing the marketing executives in nigerian banks
A theory of efficiency for managing the marketing executives in nigerian banksAlexander Decker
 
A systematic evaluation of link budget for
A systematic evaluation of link budget forA systematic evaluation of link budget for
A systematic evaluation of link budget forAlexander Decker
 
A synthetic review of contraceptive supplies in punjab
A synthetic review of contraceptive supplies in punjabA synthetic review of contraceptive supplies in punjab
A synthetic review of contraceptive supplies in punjabAlexander Decker
 
A synthesis of taylor’s and fayol’s management approaches for managing market...
A synthesis of taylor’s and fayol’s management approaches for managing market...A synthesis of taylor’s and fayol’s management approaches for managing market...
A synthesis of taylor’s and fayol’s management approaches for managing market...Alexander Decker
 
A survey paper on sequence pattern mining with incremental
A survey paper on sequence pattern mining with incrementalA survey paper on sequence pattern mining with incremental
A survey paper on sequence pattern mining with incrementalAlexander Decker
 
A survey on live virtual machine migrations and its techniques
A survey on live virtual machine migrations and its techniquesA survey on live virtual machine migrations and its techniques
A survey on live virtual machine migrations and its techniquesAlexander Decker
 
A survey on data mining and analysis in hadoop and mongo db
A survey on data mining and analysis in hadoop and mongo dbA survey on data mining and analysis in hadoop and mongo db
A survey on data mining and analysis in hadoop and mongo dbAlexander Decker
 
A survey on challenges to the media cloud
A survey on challenges to the media cloudA survey on challenges to the media cloud
A survey on challenges to the media cloudAlexander Decker
 
A survey of provenance leveraged
A survey of provenance leveragedA survey of provenance leveraged
A survey of provenance leveragedAlexander Decker
 
A survey of private equity investments in kenya
A survey of private equity investments in kenyaA survey of private equity investments in kenya
A survey of private equity investments in kenyaAlexander Decker
 
A study to measures the financial health of
A study to measures the financial health ofA study to measures the financial health of
A study to measures the financial health ofAlexander Decker
 

More from Alexander Decker (20)

Abnormalities of hormones and inflammatory cytokines in women affected with p...
Abnormalities of hormones and inflammatory cytokines in women affected with p...Abnormalities of hormones and inflammatory cytokines in women affected with p...
Abnormalities of hormones and inflammatory cytokines in women affected with p...
 
A validation of the adverse childhood experiences scale in
A validation of the adverse childhood experiences scale inA validation of the adverse childhood experiences scale in
A validation of the adverse childhood experiences scale in
 
A usability evaluation framework for b2 c e commerce websites
A usability evaluation framework for b2 c e commerce websitesA usability evaluation framework for b2 c e commerce websites
A usability evaluation framework for b2 c e commerce websites
 
A universal model for managing the marketing executives in nigerian banks
A universal model for managing the marketing executives in nigerian banksA universal model for managing the marketing executives in nigerian banks
A universal model for managing the marketing executives in nigerian banks
 
A unique common fixed point theorems in generalized d
A unique common fixed point theorems in generalized dA unique common fixed point theorems in generalized d
A unique common fixed point theorems in generalized d
 
A trends of salmonella and antibiotic resistance
A trends of salmonella and antibiotic resistanceA trends of salmonella and antibiotic resistance
A trends of salmonella and antibiotic resistance
 
A transformational generative approach towards understanding al-istifham
A transformational  generative approach towards understanding al-istifhamA transformational  generative approach towards understanding al-istifham
A transformational generative approach towards understanding al-istifham
 
A time series analysis of the determinants of savings in namibia
A time series analysis of the determinants of savings in namibiaA time series analysis of the determinants of savings in namibia
A time series analysis of the determinants of savings in namibia
 
A therapy for physical and mental fitness of school children
A therapy for physical and mental fitness of school childrenA therapy for physical and mental fitness of school children
A therapy for physical and mental fitness of school children
 
A theory of efficiency for managing the marketing executives in nigerian banks
A theory of efficiency for managing the marketing executives in nigerian banksA theory of efficiency for managing the marketing executives in nigerian banks
A theory of efficiency for managing the marketing executives in nigerian banks
 
A systematic evaluation of link budget for
A systematic evaluation of link budget forA systematic evaluation of link budget for
A systematic evaluation of link budget for
 
A synthetic review of contraceptive supplies in punjab
A synthetic review of contraceptive supplies in punjabA synthetic review of contraceptive supplies in punjab
A synthetic review of contraceptive supplies in punjab
 
A synthesis of taylor’s and fayol’s management approaches for managing market...
A synthesis of taylor’s and fayol’s management approaches for managing market...A synthesis of taylor’s and fayol’s management approaches for managing market...
A synthesis of taylor’s and fayol’s management approaches for managing market...
 
A survey paper on sequence pattern mining with incremental
A survey paper on sequence pattern mining with incrementalA survey paper on sequence pattern mining with incremental
A survey paper on sequence pattern mining with incremental
 
A survey on live virtual machine migrations and its techniques
A survey on live virtual machine migrations and its techniquesA survey on live virtual machine migrations and its techniques
A survey on live virtual machine migrations and its techniques
 
A survey on data mining and analysis in hadoop and mongo db
A survey on data mining and analysis in hadoop and mongo dbA survey on data mining and analysis in hadoop and mongo db
A survey on data mining and analysis in hadoop and mongo db
 
A survey on challenges to the media cloud
A survey on challenges to the media cloudA survey on challenges to the media cloud
A survey on challenges to the media cloud
 
A survey of provenance leveraged
A survey of provenance leveragedA survey of provenance leveraged
A survey of provenance leveraged
 
A survey of private equity investments in kenya
A survey of private equity investments in kenyaA survey of private equity investments in kenya
A survey of private equity investments in kenya
 
A study to measures the financial health of
A study to measures the financial health ofA study to measures the financial health of
A study to measures the financial health of
 

Recently uploaded

Glomerular Filtration and determinants of glomerular filtration .pptx
Glomerular Filtration and  determinants of glomerular filtration .pptxGlomerular Filtration and  determinants of glomerular filtration .pptx
Glomerular Filtration and determinants of glomerular filtration .pptxDr.Nusrat Tariq
 
Hematology and Immunology - Leukocytes Functions
Hematology and Immunology - Leukocytes FunctionsHematology and Immunology - Leukocytes Functions
Hematology and Immunology - Leukocytes FunctionsMedicoseAcademics
 
Call Girls Service Chennai Jiya 7001305949 Independent Escort Service Chennai
Call Girls Service Chennai Jiya 7001305949 Independent Escort Service ChennaiCall Girls Service Chennai Jiya 7001305949 Independent Escort Service Chennai
Call Girls Service Chennai Jiya 7001305949 Independent Escort Service ChennaiNehru place Escorts
 
Call Girl Lucknow Mallika 7001305949 Independent Escort Service Lucknow
Call Girl Lucknow Mallika 7001305949 Independent Escort Service LucknowCall Girl Lucknow Mallika 7001305949 Independent Escort Service Lucknow
Call Girl Lucknow Mallika 7001305949 Independent Escort Service Lucknownarwatsonia7
 
Call Girl Nagpur Sia 7001305949 Independent Escort Service Nagpur
Call Girl Nagpur Sia 7001305949 Independent Escort Service NagpurCall Girl Nagpur Sia 7001305949 Independent Escort Service Nagpur
Call Girl Nagpur Sia 7001305949 Independent Escort Service NagpurRiya Pathan
 
Call Girls Thane Just Call 9910780858 Get High Class Call Girls Service
Call Girls Thane Just Call 9910780858 Get High Class Call Girls ServiceCall Girls Thane Just Call 9910780858 Get High Class Call Girls Service
Call Girls Thane Just Call 9910780858 Get High Class Call Girls Servicesonalikaur4
 
Call Girls Hebbal Just Call 7001305949 Top Class Call Girl Service Available
Call Girls Hebbal Just Call 7001305949 Top Class Call Girl Service AvailableCall Girls Hebbal Just Call 7001305949 Top Class Call Girl Service Available
Call Girls Hebbal Just Call 7001305949 Top Class Call Girl Service Availablenarwatsonia7
 
Call Girl Koramangala | 7001305949 At Low Cost Cash Payment Booking
Call Girl Koramangala | 7001305949 At Low Cost Cash Payment BookingCall Girl Koramangala | 7001305949 At Low Cost Cash Payment Booking
Call Girl Koramangala | 7001305949 At Low Cost Cash Payment Bookingnarwatsonia7
 
Pharmaceutical Marketting: Unit-5, Pricing
Pharmaceutical Marketting: Unit-5, PricingPharmaceutical Marketting: Unit-5, Pricing
Pharmaceutical Marketting: Unit-5, PricingArunagarwal328757
 
College Call Girls Vyasarpadi Whatsapp 7001305949 Independent Escort Service
College Call Girls Vyasarpadi Whatsapp 7001305949 Independent Escort ServiceCollege Call Girls Vyasarpadi Whatsapp 7001305949 Independent Escort Service
College Call Girls Vyasarpadi Whatsapp 7001305949 Independent Escort ServiceNehru place Escorts
 
Call Girls Jayanagar Just Call 7001305949 Top Class Call Girl Service Available
Call Girls Jayanagar Just Call 7001305949 Top Class Call Girl Service AvailableCall Girls Jayanagar Just Call 7001305949 Top Class Call Girl Service Available
Call Girls Jayanagar Just Call 7001305949 Top Class Call Girl Service Availablenarwatsonia7
 
Book Call Girls in Yelahanka - For 7001305949 Cheap & Best with original Photos
Book Call Girls in Yelahanka - For 7001305949 Cheap & Best with original PhotosBook Call Girls in Yelahanka - For 7001305949 Cheap & Best with original Photos
Book Call Girls in Yelahanka - For 7001305949 Cheap & Best with original Photosnarwatsonia7
 
Call Girls Electronic City Just Call 7001305949 Top Class Call Girl Service A...
Call Girls Electronic City Just Call 7001305949 Top Class Call Girl Service A...Call Girls Electronic City Just Call 7001305949 Top Class Call Girl Service A...
Call Girls Electronic City Just Call 7001305949 Top Class Call Girl Service A...narwatsonia7
 
Russian Call Girl Brookfield - 7001305949 Escorts Service 50% Off with Cash O...
Russian Call Girl Brookfield - 7001305949 Escorts Service 50% Off with Cash O...Russian Call Girl Brookfield - 7001305949 Escorts Service 50% Off with Cash O...
Russian Call Girl Brookfield - 7001305949 Escorts Service 50% Off with Cash O...narwatsonia7
 
Call Girls Service Nandiambakkam | 7001305949 At Low Cost Cash Payment Booking
Call Girls Service Nandiambakkam | 7001305949 At Low Cost Cash Payment BookingCall Girls Service Nandiambakkam | 7001305949 At Low Cost Cash Payment Booking
Call Girls Service Nandiambakkam | 7001305949 At Low Cost Cash Payment BookingNehru place Escorts
 
Call Girls Hosur Just Call 7001305949 Top Class Call Girl Service Available
Call Girls Hosur Just Call 7001305949 Top Class Call Girl Service AvailableCall Girls Hosur Just Call 7001305949 Top Class Call Girl Service Available
Call Girls Hosur Just Call 7001305949 Top Class Call Girl Service Availablenarwatsonia7
 
Call Girls Viman Nagar 7001305949 All Area Service COD available Any Time
Call Girls Viman Nagar 7001305949 All Area Service COD available Any TimeCall Girls Viman Nagar 7001305949 All Area Service COD available Any Time
Call Girls Viman Nagar 7001305949 All Area Service COD available Any Timevijaych2041
 
Asthma Review - GINA guidelines summary 2024
Asthma Review - GINA guidelines summary 2024Asthma Review - GINA guidelines summary 2024
Asthma Review - GINA guidelines summary 2024Gabriel Guevara MD
 
97111 47426 Call Girls In Delhi MUNIRKAA
97111 47426 Call Girls In Delhi MUNIRKAA97111 47426 Call Girls In Delhi MUNIRKAA
97111 47426 Call Girls In Delhi MUNIRKAAjennyeacort
 
VIP Call Girls Lucknow Nandini 7001305949 Independent Escort Service Lucknow
VIP Call Girls Lucknow Nandini 7001305949 Independent Escort Service LucknowVIP Call Girls Lucknow Nandini 7001305949 Independent Escort Service Lucknow
VIP Call Girls Lucknow Nandini 7001305949 Independent Escort Service Lucknownarwatsonia7
 

Recently uploaded (20)

Glomerular Filtration and determinants of glomerular filtration .pptx
Glomerular Filtration and  determinants of glomerular filtration .pptxGlomerular Filtration and  determinants of glomerular filtration .pptx
Glomerular Filtration and determinants of glomerular filtration .pptx
 
Hematology and Immunology - Leukocytes Functions
Hematology and Immunology - Leukocytes FunctionsHematology and Immunology - Leukocytes Functions
Hematology and Immunology - Leukocytes Functions
 
Call Girls Service Chennai Jiya 7001305949 Independent Escort Service Chennai
Call Girls Service Chennai Jiya 7001305949 Independent Escort Service ChennaiCall Girls Service Chennai Jiya 7001305949 Independent Escort Service Chennai
Call Girls Service Chennai Jiya 7001305949 Independent Escort Service Chennai
 
Call Girl Lucknow Mallika 7001305949 Independent Escort Service Lucknow
Call Girl Lucknow Mallika 7001305949 Independent Escort Service LucknowCall Girl Lucknow Mallika 7001305949 Independent Escort Service Lucknow
Call Girl Lucknow Mallika 7001305949 Independent Escort Service Lucknow
 
Call Girl Nagpur Sia 7001305949 Independent Escort Service Nagpur
Call Girl Nagpur Sia 7001305949 Independent Escort Service NagpurCall Girl Nagpur Sia 7001305949 Independent Escort Service Nagpur
Call Girl Nagpur Sia 7001305949 Independent Escort Service Nagpur
 
Call Girls Thane Just Call 9910780858 Get High Class Call Girls Service
Call Girls Thane Just Call 9910780858 Get High Class Call Girls ServiceCall Girls Thane Just Call 9910780858 Get High Class Call Girls Service
Call Girls Thane Just Call 9910780858 Get High Class Call Girls Service
 
Call Girls Hebbal Just Call 7001305949 Top Class Call Girl Service Available
Call Girls Hebbal Just Call 7001305949 Top Class Call Girl Service AvailableCall Girls Hebbal Just Call 7001305949 Top Class Call Girl Service Available
Call Girls Hebbal Just Call 7001305949 Top Class Call Girl Service Available
 
Call Girl Koramangala | 7001305949 At Low Cost Cash Payment Booking
Call Girl Koramangala | 7001305949 At Low Cost Cash Payment BookingCall Girl Koramangala | 7001305949 At Low Cost Cash Payment Booking
Call Girl Koramangala | 7001305949 At Low Cost Cash Payment Booking
 
Pharmaceutical Marketting: Unit-5, Pricing
Pharmaceutical Marketting: Unit-5, PricingPharmaceutical Marketting: Unit-5, Pricing
Pharmaceutical Marketting: Unit-5, Pricing
 
College Call Girls Vyasarpadi Whatsapp 7001305949 Independent Escort Service
College Call Girls Vyasarpadi Whatsapp 7001305949 Independent Escort ServiceCollege Call Girls Vyasarpadi Whatsapp 7001305949 Independent Escort Service
College Call Girls Vyasarpadi Whatsapp 7001305949 Independent Escort Service
 
Call Girls Jayanagar Just Call 7001305949 Top Class Call Girl Service Available
Call Girls Jayanagar Just Call 7001305949 Top Class Call Girl Service AvailableCall Girls Jayanagar Just Call 7001305949 Top Class Call Girl Service Available
Call Girls Jayanagar Just Call 7001305949 Top Class Call Girl Service Available
 
Book Call Girls in Yelahanka - For 7001305949 Cheap & Best with original Photos
Book Call Girls in Yelahanka - For 7001305949 Cheap & Best with original PhotosBook Call Girls in Yelahanka - For 7001305949 Cheap & Best with original Photos
Book Call Girls in Yelahanka - For 7001305949 Cheap & Best with original Photos
 
Call Girls Electronic City Just Call 7001305949 Top Class Call Girl Service A...
Call Girls Electronic City Just Call 7001305949 Top Class Call Girl Service A...Call Girls Electronic City Just Call 7001305949 Top Class Call Girl Service A...
Call Girls Electronic City Just Call 7001305949 Top Class Call Girl Service A...
 
Russian Call Girl Brookfield - 7001305949 Escorts Service 50% Off with Cash O...
Russian Call Girl Brookfield - 7001305949 Escorts Service 50% Off with Cash O...Russian Call Girl Brookfield - 7001305949 Escorts Service 50% Off with Cash O...
Russian Call Girl Brookfield - 7001305949 Escorts Service 50% Off with Cash O...
 
Call Girls Service Nandiambakkam | 7001305949 At Low Cost Cash Payment Booking
Call Girls Service Nandiambakkam | 7001305949 At Low Cost Cash Payment BookingCall Girls Service Nandiambakkam | 7001305949 At Low Cost Cash Payment Booking
Call Girls Service Nandiambakkam | 7001305949 At Low Cost Cash Payment Booking
 
Call Girls Hosur Just Call 7001305949 Top Class Call Girl Service Available
Call Girls Hosur Just Call 7001305949 Top Class Call Girl Service AvailableCall Girls Hosur Just Call 7001305949 Top Class Call Girl Service Available
Call Girls Hosur Just Call 7001305949 Top Class Call Girl Service Available
 
Call Girls Viman Nagar 7001305949 All Area Service COD available Any Time
Call Girls Viman Nagar 7001305949 All Area Service COD available Any TimeCall Girls Viman Nagar 7001305949 All Area Service COD available Any Time
Call Girls Viman Nagar 7001305949 All Area Service COD available Any Time
 
Asthma Review - GINA guidelines summary 2024
Asthma Review - GINA guidelines summary 2024Asthma Review - GINA guidelines summary 2024
Asthma Review - GINA guidelines summary 2024
 
97111 47426 Call Girls In Delhi MUNIRKAA
97111 47426 Call Girls In Delhi MUNIRKAA97111 47426 Call Girls In Delhi MUNIRKAA
97111 47426 Call Girls In Delhi MUNIRKAA
 
VIP Call Girls Lucknow Nandini 7001305949 Independent Escort Service Lucknow
VIP Call Girls Lucknow Nandini 7001305949 Independent Escort Service LucknowVIP Call Girls Lucknow Nandini 7001305949 Independent Escort Service Lucknow
VIP Call Girls Lucknow Nandini 7001305949 Independent Escort Service Lucknow
 

Evaluating Technical Efficiency of Hospitals in Southeast Nigeria

  • 1. European Journal of Business and Management www.iiste.org ISSN 2222-1905 (Paper) ISSN 2222-2839 (Online) Evaluating the Technical Efficiency of Hospitals in Southeastern Nigeria Hyacinth Eme Ichoku Centre for Demographic and Allied Research (CDAR) Department of Economics, University of Nigeria, Nsukka, Nigeria Tel. +2348057028180 Email: hichoku@yahoo.com William M. Fonta (Corresponding author) Centre for Demographic and Allied Research (CDAR) Department of Economics, University of Nigeria Nsukka, Nigeria Tel. +2348035408395 Email: fontawilliam@yahoo.com Obinna E. Onwujekwe Health Policy Research Unit, Department of Pharmacology and Therapeutics, College Of Medicine, University Of Nigeria, Enugu Campus, Nigeria Email: onwujekwe@lshtm.ac.uk Joses M. Kirigia World Health Organization, Regional Office for Africa, Brazzaville, Congo Email: kirigiaj@afro.who.int Abstract Efficient utilization of health resources is a critical requirement for attaining health system goals particularly in low income countries. Inefficiency in health resource utilization may imply death for the next child in the queue in a resource constrained environment. This study analyzes the technical and scale efficiencies in hospitals in low income countries using Nigeria as a case study. The study uses primary data sample of 200 hospitals to estimate technical and scale efficiencies using the Data Envelopment Analysis (DEA). The results clearly indicate large variation in the efficiency of hospitals with average efficiency score of about 59% under the constant returns to scale assumption and about 72% under variable returns to scale. This raises some concerns about the level of technical and scale efficiencies in utilization of scarce health resources in the hospital sector particularly in low income countries. Keywords: Hospitals, Technical Efficiency, Data Envelopment Analysis, Southeast Nigeria 1. Introduction In many low income countries where resource constraints are extremely binding, it is not uncommon to find long queues of patients in public and private hospitals waiting patiently for several hours to be treated with health resources that often scare in supply. Hospital managers are regularly under pressure to find more beds, to hire more doctors and nurses, to provide more drugs and other resources for health care. Inefficiency in the use of available health resources may imply that the sick child next in line may die without receiving treatment. Doctors and nurses often watch helplessly as their patients die because basic health care materials are not available in right proportions. It is either too many beds and insufficient drugs, or too many administrative staff and too few qualified nurses, etc. In many cases, particularly where patients pay directly for their health services use, the costs of the inefficiency of health systems are passed on to the patient who has to spend more income fore less value in real treatment. These inefficiencies often 1
  • 2. European Journal of Business and Management www.iiste.org ISSN 2222-1905 (Paper) ISSN 2222-2839 (Online) have social welfare implications for the individual and the society as a whole. Many low income countries are below national and international health goals not only because of scarcity of resources but more painfully because available resources are not efficiently utilized. These shortcomings highlight the need for efficiency in the management of health resources. While efficiency is a desideratum at all levels of health care it is even more important at the hospital level because of its huge claims on the resources of the society and its even relatively larger claims on the health sector in particular. Hospitals are central to the social idea of health and illness, the health care system, and the health expenditure (Ityavyar, 1988). This paper attempts to evaluate the technical and scale efficiencies of hospitals in Nigeria. However, since the Nigerian health systems shares similar features and experiences with those in many other low income countries (LICs), it is believed that the lessons from this study will be useful for policies in other LICs. Using a sample of 200 hospitals in two states of southeast Nigeria the study employs the Data Envelopment Analysis (DEA) which is able to identify the frontier industry performers and obtain estimates of the extent of deviations from the frontiers by the inefficient health production units. 2. The Nigerian Health System Until the return to civil rule in 1999, the health care system in Nigeria, in general and the hospital system in particular were grossly under funded. Since the 2000 however, the budgetary allocation to the health sector both at the federal and state levels has increased significantly. It has been estimated that the hospital system in Nigeria takes over 60% of all human and material resources in Nigeria (Nwosu, 2000). At the subnational levels the state governments have primary responsibility for secondary health care both through the direct provision of general hospital services and the regulation of private hospitals. The private hospitals have also increased dramatically since the 1980s and now constitute over 70% of hospitals in some states of the country. While the public hospitals now take up considerable part of states‟ annual budget, the private household expenditures on secondary care has also increased significantly over the last decade. For example, Ichoku et al. (2009) using the Nigerian Living Standard Survey of 2003/2004, showed that average out-of-pocket health expenditure in some states takes as much as 13% of household total income. Recent statistics by WHO (206) also show that Nigeria has the largest per population supply of health human resources (doctors and nurses) in Africa comparable only to South Africa and Egypt. There are about 35,000 medical doctors and 210,000 nurses registered in the country, which translates to 28 doctors and 170 nurses per 100,000. These figures are significantly higher than the sub-Saharan Africa average of 15 doctors and 72 nurses per 100,000 people. Yet these achievements in human resources and increasing public and private expenditures on health have not translated into better population health. In many cases, the country‟s actual health achievement lags behind the African average. Although strictly speaking there are no direct relationships between input and final outcomes in the curative process, still; large health inputs without commensurate improvements in the health of the population raises questions about the efficiency with which the country‟s health resources are converted into actual health achievements. Inefficient public hospital system will result in waste of public resources which could result to extra individuals assessing the healthcare at zero marginal cost (Kirigia et al. 2004). For policy to guide hospital managements to best-practice behavior, it is important to distinguish between efficient and non-efficient hospitals. 3. The Concept of Technical Efficiency A particular method of producing a given set of outputs is said to be efficient if, given the level of prevailing technological knowledge, it is impossible to find any other method of producing the same set of output using less of at least one of the inputs. In other words, a method of production is inefficient if the same set of outputs could be obtained using fewer resources. Or, conversely, a production process is efficient if it is impossible to obtain more outputs from a given set of inputs without increasing inputs using another method or combination of methods (Chakravarty 2002; Binger and Hoffman, 1998). Thus, if one decision-making unit such as a hospital produces more outputs from a given set of inputs than another one, it is recognized as being more efficient, or, if it takes fewer inputs to produce the same level of outputs as another, then that unit is said to be more efficient. A production unit that is technically efficient is said to be operating at the production frontier 2
  • 3. European Journal of Business and Management www.iiste.org ISSN 2222-1905 (Paper) ISSN 2222-2839 (Online) 3.1 Estimating Relative Efficiency: Data Envelopment Analysis (DEA) DEA is a deterministic, non-parametric linear programming technique for measuring relative efficiency where there are multiple (possibly) incommensurate inputs and outputs as suggested by Farrell (1957) and developed in Charnes et al. (1978). The simple measure of relative efficiency under the DEA methodology is simply: weighted sum of outputs Efficiency  weighted sum of inputs u i y1 j  u 2 y 2 j  ..... Or in usual notation as; Efficiency of unit j  (1) vi x1 j  v 2 x 2 j  ..... Where u1 stands for the weight given to output i, y1 j represents the amount of output 1 from unit j, v1 measures the weight given to input 1, and x1 j for the amount of input 1 to unit j. However, note that equation (1) is constrained to lie within the range [0,1]. A major problem associated with equation (1) is determining the weights of the input and output variables. In the first place (and as discussed above), it may be difficult to value input and outputs. Secondly, one hospital may emphasize inpatient care, another outpatient care. Both are legitimate but the equation does not allow for these differing aspirations. To overcome this problem, Charnes et al. (1981) recognized that hospitals might well value inputs and outputs differently. They therefore provide for the adoption, input and output variable weights. The authors further suggest that different units should be allowed to set their own weights. Thus, under this proposal, the efficiency of the unit j0 becomes the solution to the problem. Thus, Maximize the efficiency of hospital j0 Subject to the efficiency of all other units 1  J u j y j0  max   j 1 Or, formally  M v x  (2)  m1 m m0     J j 1 u j y ji Subject to: 1 i  1,...I  M v x m 1 m mi Where, y j 0 represents the quantity of output j for DMU 0 , u j stands for the weight attached to output j, uj 0, j  1,...., J , xm 0 measures the quantity of input m, for DMU 0 and vm stands for the weight attached to input m, vm 0, m  1,....M . Equation (2) makes it clear that a different set of weight is associated with each DMU. Obviously, equation (2) is a fractional linear program equation but can be made more tractable by converting it into a system of linear equations in which the objective function can be maximized subject to a set of linear constraints. In that case, the variable weights u and v, are maximized subject to the specified constraints. The maximized values of u and x, measure the efficiency of the ith unit subject to the constraint that when applied all other units, none will have a value of efficiency greater than 1. A further problem with equation (2) is that in its present form it has an infinite number of solutions. This implies that if, u * and v * are solutions to (2), so also are  u * and  u * (Jacob, 2006). An additional constraint is therefore imposed such that either the numerator or the denominator of equation (2) is made equal to 1. By making the denominator equal 1, this leads to the maximization problem: maximize weighted output subject to weighted input being equal to 1. This implies re-writing equation (2) in the general form as; max u,v (u y 0 ) (3) 3
  • 4. European Journal of Business and Management www.iiste.org ISSN 2222-1905 (Paper) ISSN 2222-2839 (Online) v xi  1 Subject to: u y i  v xi  i  1,...I u, v  0 The maximization problem in (3) can also be expressed more compactly as: min ,  (4)  y i  Y  0 Subject to: x i  X  0 0 Where xi represents the column vector of inputs and yi represents the column vector of outputs for each unit. X and Y represent respectively, the matrix of inputs and outputs for all the units.  is a scalar quantity that lies in [0,1] range and represents the technical efficiency score of each. When a unit has its  =1, then the unit is at a point on the production frontier. It is technically efficient relative to other units in the comparative group. But for  <1 this implies that the unit is relatively inefficient as it is below the production frontier. The amount by which the score of the inefficient unit differs from 1 indicates the extent to which the unit could reduce inputs without reducing its output.  is a column vector of constants. The solution to the linear programming problem is to seek the minimum value of  that reduces the input variables xi to  xi but at the same time ensures the output level given by yi (Jacobs 2006).The linear programming problem must be solved for each unit in order to obtain the technical level of efficiency of that unit. The model specified in (4) restricts the estimation to constant returns to scale (CRS) which assumes that all the units are producing at optimal scale. This may be considered restrictive since in reality all the units may not be producing at their optimal scale. In other to allow that some of the units may not actually be producing at optimal scale it is necessary to extend model (4) to include variables returns to scale. This is achieved by simply adding the convexity constraint vector N1'   1 to the list of constraints in (4) where N1 is a vector of 1s. Coelli (1996) shows that this additional constraints form a convex of intersecting planes which ensure that the data points are more tightly enveloped than the case under CRS. It is important to note the practical effect of this additional constraint on the estimated efficiency. The efficiency level obtained under assumptions on returns to scale is likely to be different. This is because in DEA efficiency estimation, firms that exhibit variable returns to scale (VRS) are compared only with firms that are operating at the same VRS. This implies that a firm that is operating on decreasing returns to scale and is found to be efficient is efficient only in relation to other firms that are operating at similar scale or size. Thus, DEA efficiency estimation using VRS generates a greater number of efficient firms than when efficiency is estimated under CRS. By implication, a firm that obtains a 100% efficiency score under CRS estimation cannot score less under a VRS assumption, but the converse is not necessarily true. In general firms tend to score higher levels of efficiency under VRS than they do under CRS. An issue in the literature is under what condition to use one rather the other. While Banxia Frontier notes that the assumption of CRS technology is a reasonable one and is the one most widely used in DEA efficiency estimations, Coelli (1996) argues that the use of CRS is more appropriate when all the units are operating at full capacity because the estimates of technical efficiency could be confounded by scale efficiencies (SE). In this case the use of VRS will permit the calculation of SE. The SE could be computed by noting the simple relationship between the three types of inefficiency: TEiCRS  TEiVRS * SEi  SEi  TEiCRS / TEiVRS (5) The DEA is a deterministic model. Since it is non-parametric, it requires no assumptions about the functional form of the production function or cost frontier. However, it does not take into account the stochastic properties of the data. Stochastic errors arise from several sources including the intrinsic randomness of human behavior and inaccuracies arising from measurement. Input-output optimization: An efficiency analyst has the option of conducting efficiency analysis by estimating either input minimization or output maximization. According to Fare and Lovel (1978), the 4
  • 5. European Journal of Business and Management www.iiste.org ISSN 2222-1905 (Paper) ISSN 2222-2839 (Online) efficiency estimates from the two technological orientations will only be equal if the firm is operating CRS technology. However, Coelli (1996) suggests that given that the DEA is a linear programming model which cannot suffer from econometric problems like simultaneous equation bias, it does not matter which orientation one uses. He stresses that “the output- and –input-oriented models will estimate exactly the same frontier and therefore, by definition, identify the same set of DMU’s as being efficient. It is only the efficiency measures associated with the inefficient DMU’s that may differ between the two models” (p.24) In any case, Coelli (1996) and Coeli and Perelman (1999), are of the view that the choice of the orientation will have only a minor influence upon the scores obtained. It has been argued that in the context of hospital the input orientation seems to be more appropriate since hospitals are expected to minimize their inputs into the production function (see for example, Masiye 2007). However, we hold the view that in the context of LICs with huge unmet health need, the output orientation seems to serve the society better as it implies that hospitals have also the function of stimulating demand to expand their outputs for a given levels of health production inputs. Further more, in many cases the inputs are already determined. For example in public hospitals, it is usually difficult to reduce staff or even beds and the budget allocations which are given from „above‟. This also applies in the case of private sector. It is always difficult to reduce the inputs, but there are greater possibilities to use the available inputs to maximize outputs. In this study we adopted the output maximization approach because we expected the health facilities to be maximizing their output at every level of input. This is consistent with economic theory of “conspicuous production” which suggests that hospitals generally pursue production-related objectives including maximization of outputs and quality organization‟s status, and reputation (Ozcan et al. 1992, Davis, 1972, Lee, 1971). Adjusting for Environmental Inputs: There are variables which may influence the efficiency level of a unit but which may lie outside the management‟s control. This has been appropriately called X-efficiency as distinct from technical efficiency (Note 1). These variables are considered to be non-traditional inputs into the production process. Such factors in the context of hospitals may include location, ownership structure, availability of community primary health care units, etc. Jacobs et al. (2006) note not taking into account such environmental factors may lead to serious faulty conclusions about the level of efficiency of the units. It is suggested that one way to take these into account is to divide the entire sample into sub- samples. In this case the sample will be sub-divided on the basis of ownership structure: private, public and not-for profit hospitals. Following Charnes et al. (1981), DEA is applied to each sub-group in turn. The data points are then projected on to their frontiers. Subsequently, a single DEA is applied to the projected data points to assess differences in the respective mean efficiencies of the sub-groups. Alternatively, the environmental factor may be explicitly included as one of the inputs in the production function. In this case, the efficiency of a unit can be compared with that of another DMU operating in a similar environment. A major weakness of the DEA method of estimating efficiency is the flexibility built into the choice of weight. As Coelli (1996) notes, since every unit is allowed to choose the weighting scheme that portrays it in the most favorable light, a unit‟s choice may be unrelated to its inputs or outputs making it appear to be efficient even though it is not. However, if, in spite of this latitude of choice of weighting scheme, a unit appears inefficient, then it must be inefficient. The further problem with DEA is that since it does not make any room for statistical noise, it regards any such noise as inefficiency (Nchare, 2005). It is also sensitive to observations with high leverage. These weaknesses motivate the search for more appropriate methods of efficiency measurement. Such search has given rise to econometric based techniques which are parametric and make assumptions about the distribution of the error terms. 4. Survey Operations The data set for this analysis was generated through a field survey conducted between January and Match 2009 in two states of southeast Nigeria, namely Enugu and Anambra states with a total population of about 9 million people as at 2006. The survey design was guided by the objective of generating a sample of hospital facilities that is representative of the population of hospitals in the states. To achieve this, sampling frames of hospitals in the two states were obtained from the respective SMoH to guide the selection of the samples. There were altogether about a thousand health facilities (public and private) in the two states that qualified to be included in the sample, but a sample of 200 hospitals was selected at random from this frame. It is to be noted that there is a complete dominance of the health systems of both states by private 5
  • 6. European Journal of Business and Management www.iiste.org ISSN 2222-1905 (Paper) ISSN 2222-2839 (Online) medicine which accounts for over 75% of all the hospitals in the states (Ichoku, 2008). This distribution is also reflected in the sample that was generated at the end of the survey. A field survey using random sampling and the questionnaire technique was conducted between January and March 2009 for the purpose of data generation. Experienced teams of field workers were hired and trained and carried out satisfactory pretests before they were mobilized for the actual field survey. Given the long distances between the hospitals and the need to collect accurate information, each team was instructed to interview the chief medical officer or the proprietor of the health facility and to make a revisit if the chief medical officer failed to keep the appointment. It was only when it was impossible to interview the chief medical office or the proprietor of the facility that the next most responsible manager or senior officer was interviewed. In spite of this, it was still necessary to revisit most of the hospitals several times, in some cases up to six times before responses to the questionnaire were obtained. In several other cases, the questionnaire had to be left with the respondents for weeks before they could be retrieved. However, all the questionnaires were completed, giving a 100% rate of return. Respondents were required to provide information on several key variables on inputs and outputs of the hospital as shown in Table 1. The key outputs included the number of admissions, the number of outpatients, the number of X-rays conducted at the X-ray department if this existed and the medical laboratory of the hospitals. The variable inputs included the number of different categories of staff, the number of beds and recurrent costs of services as well as capital costs such as building, expenditures on electric generators, vehicles, etc. It also included information on ownership type, employment records and drugs. Measurements of floor areas were also taken. Much of the information required the examination of hospital records within the reference period of one month. The level of disaggregating the information was also important if the performance of the hospitals were to be meaningfully compared. While the survey recorded 100% retrieval, not all the hospitals provided information on each question. For example, many hospitals were unable to provide information on the floor size of their establishments; this variable was therefore not used in the analysis. The Banxia Frontier was used for the data analysis. 5. Empirical Results 5.1 Descriptive Statistics As indicated in the preceding section, a total of 200 hospitals were sampled from both Enugu and Anambra states. Special care was taken to ensure 100% return and this was achieved (i.e., 99 from Enugu state and 101 from Anambra). The distribution of the sample according to ownership status, number of beds and staff strength is shown in Table 2. Using our operational definition of a private health facility provided above, a total of 149 health facilities representing about 75% of the total health facilities covered in the survey are classified as private while, 51 hospitals (or 25% of the total sample) are government owned health facilities. Of the 149 private hospitals, 141 (70.5%) are private for-profit while 8 (4%) are mission hospitals. This distribution reflects the actual distribution of these categories in the study population but not the actual distribution by ownership across the country. This is because most states in the southeast and southwest of Nigeria are dominated by private medicine while the health care system of those in the north still depend largely on government provided health care (Nigeria Health System Assessment, 2008). Table 2 indicates that while in terms of numerical strength, the for-profit health facilities dominate. In terms of the average size of individual health facilities, they are usually far smaller than mission and government health facilities. This is consistent with the earlier observation that for-profit health facilities tend to be smaller. Most of them are solo-run unlike the public and mission hospitals that are usually better equipped and usually employ larger numbers of staff. The table shows that the average number of staff and beds in for-profit health facilities is about 12 and 16 respectively as against 55 and 122 for church run hospitals and 20 and 21 for government health facilities. In general, public hospitals employ on average about 1.6 doctors and about 18 staff and auxiliary nurses. The private facilities employ on average 1.4 doctors and 8 nurses per hospital. More specifically, the ratio of doctor to registered nurses is 1:4, while the ratio of nurse to beds is 1:2. Similarly, the average expenditure on drug by public health facilities is about N660, 000 ($5,800) per annum on drugs as against about N222, 000 ($US2,000) by the private hospitals. 6
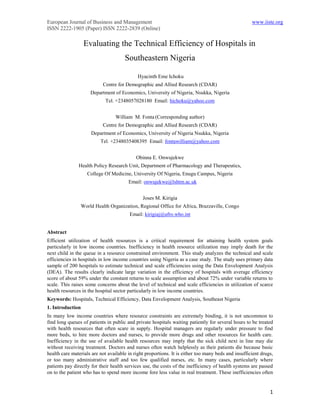
  • 7. European Journal of Business and Management www.iiste.org ISSN 2222-1905 (Paper) ISSN 2222-2839 (Online) Table 3 shows the average sizes of inputs in the two states. The average input of beds in the production of health services in Enugu is 23 per health facility. This is slightly higher than the 21.5 for Anambra state. The use of input of doctors in the health production function is slightly more intensive in Anambra state than in Enugu state while facilities in Enugu state use nurses more intensively. Surprisingly expenditure on drugs per facility in Enugu state is almost double that in Anambra state while expenditure on electricity per facility in Anambra state is half as much again as in Enugu state. This may reflect more intensive use of generators in supplying power in Anambra than in Enugu. (Generally, power outage is a very common phenomenon in Nigeria and most firms have to buy and fuel electric generators to supply power during outages which may sometimes last for days.) Outpatients per health facility in Enugu state are significantly higher than in Anambra state while the number of inpatients per facility in Anambra is higher than in Enugu state. Also the production of laboratory services and X-rays per health facility is significantly higher in Anambra than Enugu state. 5.2 The DEA Output The results of the efficiency estimation show that the mean efficiency score of all the facilities included in the sample under the DEA estimation, assuming CRS, is 59%. The mean score under the VRS assumption is 72%. The mean scale efficiency score is 82.69% implying that about 17% of total inefficiency arose from hospitals not operating at optimal scale. While these estimates appear to be low this has to be interpreted in the context of the general DEA model estimations. Increasing the number of inputs or outputs even if these additional variables are not completely relevant to efficiency measurement will increase the number of efficient units and the efficiency scores generally. This is because such increases in number of variables increases the dimensions of DEA‟s assessment of individual production units, and since each unit is always assessed in the „best of light‟, even such efficiency-irrelevant variable could provide a dimension for an inefficient unit to „shine‟ and thus appear efficient. Under CRS, 48 (24%) of all the facilities are 100% efficient while under VRS, 85 (42.5%) of all the facilities scored 100%. This highlights the differences in estimation under the two assumptions (as discussed above). The results of the CRS as estimated using the Banxia Frontier DEA are summarized in figure 1. The vertical axis in figure 1 represents the number of facilities scoring the given percentages. The horizontal axis plots the interval of scores. For example, 4 health facilities scored between 0 and 10%, 32 between 21 and 30%, 18 between 71 and 80% and 48 scored 100%. From figure 1, it is evident that judged by the CRS, many of the health facilities are not efficient. It is also pertinent to note that many of the facilities are not operating optimally and therefore give rise to large scale inefficiencies. If the facilities were operating at optimal scale, the average level of efficiency would increase by as much as 17% which is the deviation of average SE from 100%. Further analyses show that 84 facilities (42%) of the total number of facilities are operating on CRS. Another 94 (or 47%) are operating on decreasing returns; while only 22 (11%) are operating on increasing returns to scale. Thus a lot of efficiency gains could be achieved by operating the facilities at their full capacity. But there are several reasons why most of them are short on scale efficiency. Since many of the hospitals are small, it is likely that there are inadequate division of labour and consequently lack of specialization which increases scale efficiency. On the other hand decreasing returns to scale is usually associated with oversize and coordination failure. When a firm increases in size, coordination problems begin to set in leading to decreasing outputs for proportionate inputs (Note 2). The details of the efficiency constraints responsible for inefficiency in each inefficient health unit have been analyzed but have not been reported here in details. However, the results show that some inefficient units were assessed to be so because they under-produced one output variable or the other relative to their peers in the reference group. For example, hospital 4 was assessed to have used 20 beds in excess of the requirement for its present level of output, implying that 20 beds were actually redundant in this hospital. This assessment constitutes the basis for potential efficiency improvements as summarized in the next subsection. 5.2.1 Potential Improvements Table 4 summarizes the overall distribution of potential for improvements in outpatient admissions (OPD), Inpatient admissions, laboratory and X-ray services. The table illustrates the fact that many health units need to improve their output of OPD services given their current input variables. The column headings 7
  • 8. European Journal of Business and Management www.iiste.org ISSN 2222-1905 (Paper) ISSN 2222-2839 (Online) represent the required percentage range of improvements in a given output. The numbers represents the number of health units requiring improvements in the various output variables. It indicates, for example, that 50 of the health facilities need to improve the amount of output of outpatient services by between 0 to 10 percent. Five facilities need to improve on their performance with respect to outpatient attendance by 31-40%. Four units need to improve performance by 71 to 80% if they are to be efficient in respect of outpatient services. The potential for overall improvement of the sample units with respect to inpatient admissions is indicated in row 2. The row indicates that 52 health units need to improve their performance with respect to inpatient services by 0-10%, About 12 units need to improve output of inpatient services by between 61-70%. Eight facility units need to improve by as much as 70-80%. Five need improvement by almost 100%. Similar potential for improvements in the laboratory and X-ray services in the health facilities (Note 3) are shown in last two rows where we also find that 51 and 50% units needs to improve their output of laboratory and X-ray services respectively by between 0 and 10 percent. In general, these potentials for improvements in outputs indicate the level of inefficiency that currently exists in most of the hospitals in the study area, and this is reflected in the overall average efficiency. 5.2.2 The Efficient Reference Sets In DEA models of efficiency analysis, efficient decision units are not efficient in absolute terms but only relative to less efficient units. In assessing the efficiency of a particular unit, the estimation process compares the performance of that unit with a set of other efficient units. The efficient unit with which a given unit is assessed is its reference set. The performance of the efficient reference set in the various dimensions of assessment shows why an inefficient unit is adjudged inefficient. This is very important for management policy because it leads to the crucial question of why a given unit is unable to match the performance of peers in its reference set. For example, in the estimated model hospital unit 17 was rated inefficient and scored only 36% when assessed under the CRS technology. Its reference peers include units 1, 12, 27, 32, 33, 40, 57, 114, and 138 all of which had efficiency score of 100%. Comparing the performance of unit 17 in relation to unit 1 shows that unit 17 produces just one third of outpatient services as produced by unit 1, and 29% less of inpatient services as much as unit 1 for the same level of inputs. Thus, the peer-review mechanism helps management to identify the sources of low score and how to provide remedial actions. It also helps to identify the most efficient units in the sample as a whole. This is because a hospital that is frequently used as a reference unit is being put up a model efficient unit that others could learn from. Table 5 provides some of the most efficient units in the sample with the number of times they are used as reference in the assessment of other units. The unit in the table refers to the serial number of a given unit in the sample of 200 hospitals while the reference count refers to the number of times the particular unit was used in assessment of other units. All the units in the table scored 100% efficiency under the CRS and are therefore qualified to be used as „model‟ for other hospitals. However, it is evident that not all the efficient units are equally efficient. Some were efficient but could not be referenced in the assessment of other units. That is their reference count was zero. Some were referenced just once or twice. Table 5 contains the list of efficient hospitals that have been referenced more than twice in the assessment of other hospitals. Units 94, 37 and 32 were referenced only 3 times. Unit 2 was referenced 11 times. Unit 7 was referenced 34 times while unit 33 was referenced 142 times implying that it is the best overall efficient hospital in the sample. The most referenced units therefore provide lessons in efficiency for the inefficient units. In general there is a wide range of differences between the technical efficiency scores of the hospitals in the group ranging from the lowest of 7.5% to the highest of 100% implying that some hospitals are using resources to produce more than 10 times what other hospitals are producing with similar level of resources. Table 6 provides two illustrative examples of technical operational adjustments required to maximize the efficiency of units. Table 6 indicates the hospital unit 4 in the sample of 200 had efficiency score of 57.55, its current use of other staff is considered inefficient because it can actually reduce this input by 54% and still maintain the current output levels. Similarly the same unit 4 is using more nurses and beds than it‟s current level of production requires and needs to reduce the use of nurses by 59%, reduce the number of beds by 17%. It 8
  • 9. European Journal of Business and Management www.iiste.org ISSN 2222-1905 (Paper) ISSN 2222-2839 (Online) can also increase its outputs of OPD by 73%, inpatients by 222%, and laboratory tests by 74% and X-ray by 74%. For unit 76 which scored only 33.70%, its use of „other staff‟ and beds are efficient, but its use of nurses and doctors is inefficient. At the same time it has great potential to improve on its current outputs of OPD, inpatients, laboratory tests and X-ray outputs. For each of all the other inefficient units, such calculations are produced which enables the hospital managers to rationalize their use of resources in other to achieve efficiency relative to their peers. 5.2.3 Returns to Scale and Scale Efficiency As expected, there are significant differences in the estimated efficiency scores under the CRS and VRS, and the SE. The estimated mean efficiency scores were 59.39, 72.88 and 82.69 respectively. A total of 49 hospitals of the 200 sample units were efficient under the CRS; 85 were efficient under VRS and 72 had 100% scale efficiency. As noted above, the large difference between the estimates of CRS and VRS is due to the fact that CRS assumes that all units are operating optimal scale. When this is not the case, the estimates are confounded by scale inefficiencies. Of the total sample, 22 hospitals or 11% of the sample operated increasing returns to scale; 84 (42%) operated at constant returns to scale while 94 representing about 47% of the toal operated decreasing returns to scale. An important observation from the estimation is that there is a high level of correlation between scale at which a unit is operating and the level of efficiency. More importantly efficient hospitals seem to operate constant returns to scale technology. For example, 84 out of the 85 hospitals that scored 100% efficiency under the VRS technology assumption operated constant returns to scale and only one operated decreasing returns to scale while none operated increasing returns. Similarly, under the CRS technology assumption all the 49 hospitals that recorded 100% efficiency operated constant returns to scale. Of the 72 hospitals that had 100% scale efficiency, 21 operated increasing returns, 49 operated constant returns while only 2 had decreasing returns. This suggests that constant returns to scale is more efficient technology for hospitals. Following our earlier observations, constant returns to scale imply that the firm is sufficiently specialized and yet, it is not loosing productivity on account of managerial coordination problems that are associated with complex organizations which lead to decreasing returns to scale. 6. Conclusion The aim of this study has been to provide first hand empirical information about the technical efficiency of hospitals in the southeast of Nigeria with the hope that this can provide some lessons for the hospital sector of many LICs. This is considered critical in view of the scarcity of resources and the severe implications of inefficient utilization of available resources for saving lives. This study provides empirical evidence from Nigeria of the efficiency rates of the hospitals in the facilities under both the CRS and VRS assumptions. Under the CRS method the estimated average efficiency rate is 59% while under the VRS it is 72% on average. The average scale efficiency is 82%. However, the study reports also wide variations between the best and worst performers in the system under the three dimensions. Under the CRS assumption only 48 (or 24%) of the 200 health facilities in the sample were identified as efficient. This compared with the situation under the VRS where 85 (42.5%) of the facilities were identified as efficient. The large differences in these results arose because, as noted, CRS compares the efficiency of each unit in relation to all the efficient units in the sample while VRS compares the efficiency of each unit in relation to only units in the sample operating at the same scale as the unit under assessment. In other words, VRS calculates efficiency devoid of scale inefficiencies while CRS may be confounded by scale inefficiencies. By dividing the CRS with VRS scores, the SE values are obtained. The mean loss in efficiency for many of the facilities is due to their operating at suboptimal levels. As noted above the efficiency scores under DEA must be interpreted with caution and in context. This is because of the tendency of the method to „inflate‟ the efficiency scores as the number of input variables and/or output variables increases even if the additional variables are not altogether relevant for efficiency considerations. The analysis also identified why any given inefficient unit was inefficient relative to the efficient ones. This yielded critical management information about the potential improvements that could be made to improve the efficiency of each inefficient unit. This paper provides limited examples of how much each inefficient unit must reduce its input or increase each output to become efficient. However, it is possible that some facilities may expend resources to ensure quality environment for its patients or one that hires 9
  • 10. European Journal of Business and Management www.iiste.org ISSN 2222-1905 (Paper) ISSN 2222-2839 (Online) compassionate health staff may be rated less efficient than one whose staff are rude and lacking in compassion just on the basis of output. This is an important weakness of this study and needs to be taken into account. The study, however, was able to identify the most outstanding performers in the sample set. As noted above, these efficient performers are by no means efficient in all aspects of their operation, the DEA method adjudged them to be efficient in some respects either in input or output variables, though some consistently showed efficiency in almost all dimensions. A key lesson from this study is the potential large variation in the efficiency of health facilities in many LlCs as evidence from this case study. The study shows that even by the most optimistic standards about the efficiency scores, large gains could be made in the health sector if the health facilities were to become more efficient in their operation. By CRS estimation, improvements of 40% could be obtained and by VRS standard, improvements of up to 26% could be attained in terms of facilities efficiency. Any of these figures is a huge resources gain in a resource-constrained environment given the poor health profile of many LICs. The economic welfare implications of the results are also not lost. What this implies is that given the prevailing level of inefficiency, society and households could make appreciable welfare gains if the hospitals were to become efficient. Inefficient hospitals could be passing on to their poor patients the cost of their inefficiencies in order to remain in business. The estimated levels of inefficiency call for far reaching measures to secure a higher level of efficiency in the hospital sector. For instance, given the level of scale inefficiency in the system alone, the health system regulatory authorities could device better incentives in the form of higher resource allocations to hospitals that are identified as efficient. It could also provide incentives for merging of higher operational scales so that health facilities could gain scale economies and share of expertise. References Banker, R.D., Conrad. R.F. & Straus, R.P (1986). A comparative application of Data Envelopment Analysis and Translog methods: an illustrative study of hospital production. Journal of Management Sciences. 37:30-43 Binger, B.R & Hoffman, E. (1998). Microeconomics with Calculus, 2nd ed. Reading: Addison-Wesley Button, K.J. & Weyman-Jones, T.G. (1992). Ownership structure, institutional organization and measured X-efficiency. The American Economic Review. 62(2) 439-445 Chakravarty, S.R. (2002). Microeconomics, New Delhi: Allied Publishers Charnes, A. Cooper, W.W. and Rhodes, E. (1981) “Evaluating program and managerial efficiency: an application of Data Envelopment Analysis to program follow through” Management Science 27:667-697 Charnes, A. Cooper, W.W. and Rhodes E. (1978). Measuring the efficiency decision making units” European Journal of Operations Research, 2:429-444 Coelli, T.J. (1996). A Guide to FRONTIER Version 4.1: A Computer Program for Stochastic Production and Cost Function Estimation. CEPA Working Papers No. 7/96. Department of Econometrics, University of New England. Dyson R.G, Thanassoulis, E. & Boussofiane, A. (1990). Data Envelopment Analysis. http://www.warwick.ac.uk/-bsrlu/dea/deat/deat1htm Fare, R. & Lovell. C.A.K. (1978). Measuring the technical efficiency of production. Journal of Economic Theory. 19:150-162. Farrell, M.J. (1957). The measurement of productive efficiency. Journal of the Royal Statistical Society. 120:252-281 10
  • 11. European Journal of Business and Management www.iiste.org ISSN 2222-1905 (Paper) ISSN 2222-2839 (Online) Ichoku, H.E., Fonta M.W., & Onwujekwe, O. (2009). Incidence and intensity of catastrophic health financing and impoverishment due to out-of-pocket payments in southeast Nigeria. Journal of Insurance and Risk Management. IV (4), 47-59. Ichoku, H.E. (2008). Anambra State of Nigeria: Public Expenditure Review of the Health Sector. A Report for EU-SRIP, Abuja, Nigeria. Ityavyar, D.A. (1988). Health services inequalities in Nigeria. Social Science & Medicine. 27 (11), 1223- 1235. Jacobs, R. Smith, P.C., & Street, A. (2006). Measuring Efficiency in Health Care: Analytic Techniques and Health Policy. Cambridge: Cambridge University Press Kirigia, J.M. et al. (2004). Using Data Envelopment Analysis to measurement the technical efficiency of public health centers in Kenya. Journal of Medical Systems. 28(2) 155-166. Leibenstein, H. (1977). X-efficiency, technical efficiency, and incomplete information use: a comment. Economic Development and Cultural Change. 25:311-16a”. Nwosu, E. J. (2000). The Challenge of Poverty in Africa. Skillmark Media Ltd., Owerri. Ozcan, Y.A., Luke, R.D., & Haksever, G. (1992). Ownership and organization performance: a comparison of technical efficiency across hospital types. Medical Care. 30(9)781-794 Notes Note 1. While technical efficiency has to do with the technique of combining inputs to produce output, X- efficiency has to do with influences outside the control or knowledge of the management (Button & Weyman-Jones, 1992 and Leibenstein, 1977). Note 2. This is consistent with modern neoclassical economic growth theories that consider increasing returns to scale as an out-come of technological progress. When a small firm operating with labor and capital indivisibilities starts to expand on account of greater division of labor and specialization, then the firm is gaining the advantage of technology change or technical progress in the process of production. In the case of decreasing returns to scale the advantages of specialization is being outweighed by managerial difficulties associated with complex organizations. Note 3. It may be noted that these potential improvements in services do not necessarily imply that all the facilities are currently offering these services. But the estimation assumes that their efficient counterparts are offering these services and therefore they are assessed based on the standard of the efficient units. Table 1: The Inputs/Outputs Variables Used in the Analyis Variable Symbol Definition Output variables Outpatient anOP1 No of outpatients treated in the facility in the last one year Inpatients anOP2 No of inpatient admissions Lab test anOP3 No of laboratory tests conducted 11
  • 12. European Journal of Business and Management www.iiste.org ISSN 2222-1905 (Paper) ISSN 2222-2839 (Online) X-rays anOP4 No. of X-rays attended Input variables Beds Beds No of beds in the facility Doctors acstaff1 No of patients Pharmacists acstaff2 No of pharmacists employed by the facility Nurses regaux No of registered and auxiliary nurses employed Other staff Staff4 No of other paramedical staff employed Drug Drug Annual expenditure on drugs Power Elect Annual expenditure on power including running of generators Equipment Equip Annual expenditure on equipment including maintenance Location loc A dummy variable for urban or rual location State State A dummy for whether a facility is in Enugu or Anambra state Ownership ownership A dummy for ownership status – government or private Table 2: Distribution of health facilities by ownership Mean Std. Dev. Min. Max. Public Beds 21.90 28.59 0 199 Staff 20.02 21.12 12 120 Private: For Profit Beds 15.98 8.77 0 56 Staff 12.26 11.02 1 118 Private: Mission Beds 122.38 88.15 25 255 Staff 55.38 45.72 8 150 Table 3: Distribution of Means of Variables by State State 1: Enugu State State 2: Anambra State S Variable Obs. Mean Std. Dev. Obs. Mean Std. Dev. n Ouputs 1 Outpatients 99 1447.39 4794.291 101 819.32 996.38 2 Inpatients 99 366.66 588.1205 101 389.35 522.59 3 Lab tests 99 405.58 625.6414 101 588.83 648.19 4 X-rays 99 67.75 180.7032 101 113.34 183.31 Inputs 5 Beds 99 23.0 32.07214 101 20.51 30.10 6 Doctors 99 1.35 1.560436 101 1.60 2.38 7 Pharmacists 99 0.65 1.327212 101 0.43 0.89 8 Nurses 99 14.40 45.35 101 8.05 6.51 9 Drug 99 406141.40 2000727 101 262105 219215.8 10 Elect 99 198521.20 191512.9 101 313166.3 270424.8 12
  • 13. European Journal of Business and Management www.iiste.org ISSN 2222-1905 (Paper) ISSN 2222-2839 (Online) 11 Equipment 99 346412.10 582960.1 101 324906.9 193547.9 Table 4: Summary of Distribution of Potential Improvements for Different Output Variables Percentage Improvement Required Output 0-10 11-20 21-30 31-40 41-50 51-60 61-70 71-80 81-90 91-100 OPD 50 1 2 5 0 3 5 4 1 1 Inpatient 52 5 12 6 3 5 12 8 1 5 Admins Lab Services 51 4 11 6 2 5 13 6 1 6 X-ray 50 3 11 4 3 3 5 4 1 2 Table 5: Most Efficient Units Unit Ref Count Unit Ref Unit Ref Unit Ref Count Count Count 33 142 114 27 2 11 128 5 25 104 120 26 5 10 176 4 28 89 159 21 34 10 160 4 40 83 41 15 200 7 147 4 138 59 162 12 163 7 132 4 6 49 113 12 156 7 94 3 7 34 87 11 140 6 37 3 50 31 39 11 3 5 32 3 Table 6: Sources of Inefficiency in Inefficient Hospitals UNIT 4 Efficiency Current Potential % UNIT Efficiency Current Potential %reduction/ Score: Reduction/ 76 Score: increase 57.5% increase 33.70% Inputs Other staff 6 2.76 -53.98 Other staff 2 2 0 Nurses 12 4.91 -59.05 Nurses 7 4.94 -29.49 Pharmacists 0 0 0 Pharmacists 0 0 0 Doctors 1 0.92 -7.67 Doctors 1 0.5 -50.43 beds 20 16.58 -17.12 Beds 8 8 0 Outputs OPD 72 125.17 73.85 Outputs OPD 0 101.1 10110.86 Inpatients 168 540.8 221.91 Inpatients 300 1147.84 282.61 Lab 360 625.85 73.85 Lab 216 640.01 196.3 X-ray 1128 1961.01 73.85 X-ray 540 1600.03 196.3 13
  • 14. European Journal of Business and Management www.iiste.org ISSN 2222-1905 (Paper) ISSN 2222-2839 (Online) Figure 1: Distribution of Efficiency Scores of Health Hospitals 14