SlideShare ist ein Scribd-Unternehmen logo
1 von 41
Downloaden Sie, um offline zu lesen
Global and National
Prevalence of Diabetes
Worldwide Perspective on Diabetes
An epidemic of diabetes and obesity is sweeping the globe, largely
because of marked shifts in dietary practices and physical activity. In
2000, 171 million persons on the planet were known to have diabetes,
and by 2030, this figure is expected to increase to 366 million. More
than 80% of people with diabetes worldwide live in low- and middle-
income countries. During the next 2 decades, the world population is
expected to increase by 37%, but the prevalence of diabetes will increase
by 114%. In India, sub-Saharan Africa, and Latin America, diabetes
prevalence is projected to increase by 150% to 160%.1
In the United States and other developed economies, the rise in
diabetes prevalence is projected to be higher than 50%. As shown in
Figure 46-1, in 2005, 20.8 million people (7% of the population) have
been diagnosed with some form of diabetes. Another 6.2 million with
diabetes are undiagnosed. Of women 20 years or older, 8.8% have
overt diabetes, but there is a strong predilection for this disease among
ethnic groups. Higher-than-expected rates of pregestational diabetes
in women of childbearing age have been reported for 13.3% of non-
Hispanic blacks, 9.5% of Hispanic and Latino Americans, and 12.8%
of Native Americans.2
Epidemiology of Diabetes in
U.S. Women
Studies suggest that the prevalence of diabetes among women of child-
bearing age is increasing in the United States.3,4
Continued immigra-
tion among populations with high rates of type 2 diabetes and the
impact of changes in diet (i.e., increased calories and fat content) and
lifestyle (i.e., sedentary) have brought marked increases in the percent-
age of patients with preexisting diabetes who will become pregnant in
the future. A virtual epidemic of childhood obesity is occurring in the
United States, bringing with it a sharp rise in childhood and adolescent
diabetes. This trend will have a profound impact on obstetrics and
pediatrics in the next 2 decades and beyond.5
Increased outreach
efforts to provide care to the populations experiencing rising rates of
pregestational diabetes will be necessary if a significant increase in
maternal and newborn morbidity is to be avoided. When offspring of
diabetic mothers are compared with weight-matched controls, the risk
of serious birth injury is doubled, the likelihood of cesarean section is
tripled, and the incidence of newborn intensive care unit admission is
quadrupled.6
Before the 20th century, pregnancy in the diabetic woman por-
tended death of mother or child, or both. In the 21st century, centers
providing meticulous metabolic and obstetric surveillance report peri-
natal loss rates approaching but still higher than those seen in the
nondiabetic population.7,8
Nevertheless, major problems with fetal and
maternal management persist. Stillbirth rates have fallen dramatically
but remain threefold or fourfold greater than rates for the normogly-
cemic population. Congenital fetal anomalies, many of them life
threatening and debilitating, remain three to four times more common
in diabetic pregnancies than in nondiabetic pregnancies.9
Macrosomia
and birth injury occur 10 times more frequently in diabetic fetuses.
Studies indicate that the magnitude of such risks is proportional to the
degree of maternal hyperglycemia.10,11
To a great extent, the excessive
fetal and neonatal morbidity of diabetes in pregnancy is preventable
or at least reducible by meticulous prenatal and intrapartum care. This
chapter reviews the pathophysiology of this complex group of disorders
and identifies the obstetric interventions that can improve outcome.
Classification and
Pathobiology of
Diabetes Mellitus
Diagnostic and classification criteria for diabetes were issued by the
American Diabetes Association (ADA) in 1997.12
These criteria were
further modified in 2003 regarding the diagnosis of impaired fasting
glucose.13
This nomenclature is useful because it categorizes patients
according to the underlying pathophysiology, although we recognize
that the criteria are not as mutually exclusive as once thought. The
classification includes four clinical types:
1. Type 1 diabetes, formerly referred to as insulin-dependent or juve-
nile-onset diabetes.
2. Type 2 diabetes, formerly referred to as non–insulin-dependent or
adult-onset diabetes
3. Other specific types of diabetes related to a variety of genetic-,
drug-, or chemical-induced diabetes
4. Gestational diabetes mellitus
An alternative classification that is commonly used in obstetrics was
proposed by Priscilla White when she was at the Joslin Clinic in Boston
Chapter 46
Diabetes in Pregnancy
Thomas R. Moore, MD, and Patrick Catalano, MD
954 CHAPTER 46 Diabetes in Pregnancy
in 1932.14
This classification (Table 46-1) was based on the duration of
the disease and secondary vascular damage to retinal, renal, and car-
diovascular structures. Because the White classification is primarily
descriptive and because it does not reflect the increase in type 2 dia-
betes in the population and the discovery of better-defined genetic
causes, the ADA classification is preferred. The pathophysiology of the
various types of diabetes is discussed subsequently.
Type 1 Diabetes
Type 1 diabetes accounts for approximately 5% to 10% of patients
diagnosed with diabetes in the general population. However, type 1
diabetes may represent a slightly greater fraction of women in the
reproductive age group because of the relatively earlier age of onset of
type 1 diabetes compared with type 2 diabetes. Type 1 diabetes results
from a cellular-mediated autoimmune destruction of the beta cells of
the pancreas. Markers of the immune response include islet cell auto-
antibodies, autoantibodies to insulin, autoantibodies to glutamic acid
decarboxylase (GAD2, formerly designated GAD65), and autoanti-
bodies to the tyrosine phosphatase IA-2 and IA-2β. One and usually
more of these autoantibodies are present in 85% to 90% of individuals
with elevated fasting glucose and type 1 diabetes.15
Autoimmune destruction of beta cells has many genetic predisposi-
tions and is related to environmental factors. Although viruses were
initially implicated, the environmental conditions leading to auto
destruction of the beta cells remain largely undefined. Most evidence
indicates a genetic predisposition related to an individual’s human
leukocyte antigen (HLA) associations with linkage to DQA and DQB
genes. Type 1 diabetes is concordant in 33% to 50% of monozygotic
twins, suggesting that environmental triggers are required to initiate
the disease process in genetically predisposed individuals.
Type 1 diabetes usually is characterized by an abrupt clinical onset
after a period of immune destruction of the beta cells that might have
been in progress for some time. The beta cell destruction continues
after the clinical onset of diabetes, usually leading to an absolute
insulinopenia with resultant life-long requirements for insulin
replacement. Although type 1 diabetes was previously referred to as
juvenile-onset diabetes, it can occur at virtually any age. The disease is
particularly common in whites, especially those of Northern European
ancestry, and Sardinians.
Type 2 Diabetes
Type 2 diabetes involves a loss of balance between insulin sensitivity
and insulin (i.e., beta cell) response. The relationship between these
two factors can be expressed as the disposition index (i.e., the normal
inverse relationship between the two factors can be expressed as a
constant).16
A decline in the disposition index is associated with the
development of type 2 diabetes. Both insulin resistance and beta cell
dysfunction exist in individuals who develop type 2 diabetes. There is
little agreement about whether the beta cell function is an independent
event or is coincident with decreased insulin sensitivity and whether
the abnormalities are causally linked.
The decreased insulin sensitivity and inadequate insulin response
leads to an increase in circulating glucose concentrations, and the
decreased insulin sensitivity in individuals with type 2 diabetes results
in the inability of insulin to suppress lipolysis in adipose tissue. Many
predisposing factors are related to decreased insulin sensitivity (i.e.,
increased insulin resistance). They include obesity, a sedentary lifestyle,
family history and genetics, puberty, advancing age, and of particular
concern to the obstetrician, the intrauterine environment. Although it
Estimated Age-Adjusted Total Prevalence of
Diabetes in People 20 Years or Older,
by Race/Ethnicity—United States, 2005
Percent
American Indians/
Alaska Natives
Non-Hispanic
blacks
Hispanic/Latino
Americans
Non-Hispanic
whites
0 2 4 6 8 10 12 14 16 18 20
FIGURE 46-1 Estimated prevalence of diabetes in the United
States 2005. For American Indians/Alaska Natives, the estimate of
total prevalence was calculated using the estimate of diagnosed
diabetes from the 2003 outpatient database of the Indian Health
Service and the estimate of undiagnosed diabetes from the 1999-
2002 National Health and Nutrition Examination Survey (NHANES).
For the other groups, the 1999-2002 NHANES estimates of total
prevalence (diagnosed and undiagnosed) were projected to the year
2005. (Printed with permission from http://diabetes.niddk.nih.gov/dm/
pubs/statistics/index.htm#age.)
TABLE 46-1 THE WHITE CLASSIFICATION OF DIABETES IN PREGNANCY
White Class Age at Onset (Years) Duration (Years) Complications
A Any Any Diagnosed before pregnancy; no vascular disease
B у20 or <10 No vascular disease
C 10-19 or 10-19 No vascular disease
D <10 or у20 Background retinopathy only or hypertension
E Calcification of pelvic arteries (no longer used)
F Nephropathy (>500 mg of proteinuria per day)
H Arteriosclerotic heart disease
R Proliferative retinopathy or vitreous hemorrhage
T After renal transplantation
Adapted from Hare JW, White P: Gestational diabetes and the White classification. Diabetes Care 3:394, 1980. Copyright © 1980 by the American
Diabetes Association.
955CHAPTER 46 Diabetes in Pregnancy
was formerly believed that type 2 diabetes was primarily a disorder of
older individuals (accounting for its being called adult-onset diabetes),
there has been a significant increase in the prevalence of type 2 diabetes
since 1990. At the turn of the 21st century, an estimated 13.8 million
people had a diagnosis of diabetes, 5 million people had undiagnosed
diabetes, and 41 million people had prediabetes.17
Although it is not in the scope of this chapter to review the spec-
trum of possible causes of type 2 diabetes, the increase in obesity in
the general population is a contributing factor; it is estimated that
approximately two thirds of the population in the United States are
overweight or obese.18
Obesity, particularly central obesity, which is
estimated by waist circumference, is a well-described risk factor. This
increase in visceral obesity affects hepatic metabolic function and is a
rich source of cytokines and inflammatory factors, which are recog-
nized as contributing to increasing insulin resistance.
Criteria for the diagnosis of diabetes in nonpregnant adults are
shown in Table 46-2. Although the 75-g, 2-hour oral glucose tolerance
test (OGTT) is the most sensitive and specific diagnostic test for type
2 diabetes, because of the ease of administration and reproducibility,
the fasting glucose test is often used as a first-line diagnostic test,19
particularly in the nongravid population. Because the onset of type 2
diabetes is usually insidious, hyperglycemia not sufficient to make the
diagnostic criteria for type 2 diabetes is often categorized as impaired
fasting glucose (IFG) (100 mg/dL to 125 mg/dL) or, if the 75-g OGTT
is employed, as impaired glucose tolerance (IGT) (2-hour glucose level
of 140 mg/dL to 199 mg/dL). The IFG and IGT have been officially
designated prediabetes, and prediabetic individuals are at high risk for
the development of type 2 diabetes.19
Gestational Diabetes Mellitus
Gestational diabetes mellitus (GDM) as defined by the Fourth Inter-
national Workshop-Conference on Gestational Diabetes as “carbohy-
drate intolerance of various degrees of severity, with onset or first
recognition during pregnancy.”20
This definition does not preclude the
possibility that glucose intolerance might have predated the pregnancy
or that medications might be needed for optimal glucose control. The
underlying pathophysiology of GDM in most instances is similar to
that observed for type 2 diabetes: an inability to maintain an adequate
insulin response because of the significant decreases in insulin sensitiv-
ity with advancing gestation. About 2% to 13% of women diagnosed
as having GDM have detectable antibodies directed against specific
beta cell antigens.21,22
Some of these deficiencies are population depen-
dent. Other patients diagnosed with GDM have genetic variants that
have been identified as causes of diabetes in the general population,
including autosomal dominant (discussed later) and maternal or mito-
chondrial inheritance patterns.23,24
It is estimated that as many as 3% to 9% of the population of
pregnant women will be diagnosed with GDM.15
This translates into
approximately 135,000 cases of GDM per year in the United States
alone. This is not surprising, because in many respects, GDM is the
harbinger of type 2 diabetes for many women, based on the underlying
pathophysiology of GDM and the increase in obesity in women of
reproductive age. Similarly, there is an increase in the incidence of
GDM in women immigrating to the United States, presumably because
of changes in diet and lifestyle. Clinical recognition of GDM is impor-
tant because therapy can reduce pregnancy complications and poten-
tially reduce long-term sequelae in the offspring.
Genetic and Other Causes of Diabetes
The ADA’s fourth classification of diabetes includes specific types of
diabetes attributed to “other causes.” These causes include genetic
defects in insulin action, diseases of the exocrine pancreas (e.g., cystic
fibrosis), and drug- or chemical-induced diabetes, such as in the treat-
ment of human immunodeficiency virus (HIV) infection or after
organ transplantation.19
One of the well-characterized genetic defects
is often included under the heading of maturity-onset diabetes of
the young (MODY) (i.e., the glucokinase [GK] mutation). In 1998,
Hattersley and colleagues25
described the various phenotypic per-
mutations associated with the mutations of the glucokinase gene.
Glucokinase phosphorylates glucose to glucose-6 phosphate in the
pancreas and liver. A heterozygous glucokinase mutation results in
hyperglycemia, usually with a mildly elevated fasting glucose and
abnormal OGTT result. This occurs because of a defect in the sensing
of glucose by the beta cell, resulting in decreased insulin release, and
to a lesser degree because of reduced hepatic glycogen synthesis. In
pregnancy, it is estimated that 3% of women with GDM and an ele-
vated fasting glucose level greater than 110 mg/dL have this mutation.
If the heterozygous mutation is present in the fetus, then the altered
glucose sensing by the fetal pancreas will result in a decrease in insulin
secretion. In the fetus, insulin is a primary stimulus for growth, and
any defect in fetal insulin secretion results in decreased fetal growth
and possible growth restriction. Depending on whether the mother or
fetus, or both, have a defect in the glucokinase gene, the phenotype of
the infant can vary from intrauterine growth restriction (IUGR)
through normal fetal growth and to macrosomia.
Maternal-Fetal Metabolism
in Normal and Diabetic
Pregnancy
There are significant changes in maternal metabolism in normal preg-
nancy. These include changes in maternal nutrient metabolism (i.e.,
carbohydrate, lipid, and protein metabolism) and changes in factors
such as energy expenditure. The overall goal of these maternal meta-
bolic adaptations is to prepare the pregnant woman to meet the
increased energy needs of the mother and growth of the fetus in the
TABLE 46-2 CRITERIA FOR THE DIAGNOSIS
OF DIABETES
Symptoms of diabetes and a casual plasma glucose level
м200 mg/dL (11.1 mmol/L). Casual is defined as any time of
day without regard to time since the last meal. The classic
symptoms of diabetes include polyuria, polydipsia, and
unexplained weight loss.
or
Fasting plasma glucose level м126 mg/dL (7.0 mmol/L). Fasting is
defined as no caloric intake for at least 8 hours.
or
Two-hour plasma glucose м200 mg/dL (11.1 mmol/L) during an
oral glucose tolerance test. The test should be performed as
described by the World Health Organization, using a glucose
load containing the equivalent of 75-g anhydrous glucose
dissolved in water.
Adapted from American Diabetes Association: Clinical practice
recommendations: Standards of medical care for diabetes—2007.
Diabetes Care 30:S4-S41, 2007.
956 CHAPTER 46 Diabetes in Pregnancy
latter third of pregnancy, when approximately 70% of fetal growth
takes place.26
The alterations in maternal metabolism are relatively
uniform during pregnancy unless there are major perturbations such
as starvation conditions. The metabolic changes during pregnancy
therefore take place on the background of a woman’s pregestational
metabolic status. For example, if a woman is healthy and lean before
conception, there is an increased need to store adipose tissue in early
pregnancy to meet the increased energy demands of late gestation and
to develop insulin resistance in late gestation to provide nutrients for
the growing fetus. If a woman is obese before conception, there is little
need to gain additional adipose tissue, but there is the requirement to
provide nutrients for the fetus in late gestation.
Normal Glucose-Tolerant Pregnancy
Glucose homeostasis is primarily a balance between insulin resistance
and insulin secretion. The alterations in insulin resistance affect endog-
enous glucose production (primarily hepatic glucose metabolism) and
peripheral glucose metabolism, which takes place in skeletal muscle.
In the lean pregnant woman with normal glucose tolerance, there is a
significant 30% increase in basal hepatic glucose production by the
third trimester of pregnancy (Fig. 46-2). This is associated with a sig-
nificant increase in basal or fasting insulin concentrations.27
The
decrease in fasting glucose concentrations most likely is the result of
increasing plasma volumes in early gestation and increased fetoplacen-
tal use in late pregnancy. In the postprandial state, the increasing
insulin concentrations enhance glucose uptake into skeletal muscle
and adipose tissue, and they almost completely suppress hepatic
glucose production. Although this is the case in lean women, obese
women with normal glucose tolerance have a decreased ability for
insulin to completely suppress hepatic glucose production in late preg-
nancy.28
These data support the concept of decreased insulin sensitivity
in late gestation that is more severe in obese women compared with
non-obese counterparts.
Peripheral insulin resistance is defined as the decreased ability of
insulin to affect glucose uptake primarily in skeletal muscle and to a
lesser degree in adipose tissue. Various methods are used to assess
insulin sensitivity in vivo, including mathematical models of fasting
glucose and insulin modeling (e.g., homeostasis model assessment
[HOMA],29
OGTT30
), the intravenous glucose tolerance test (i.e.,
Bergman minimal model),31
and what many consider to be the gold
standard: the hyperinsulinemic-euglycemic clamp.32
Most of these
measures have identified a significant 50% to 60% decrease in insulin
sensitivity in late gestation.33
The changes in insulin sensitivity during
gestation are a reflection of a woman’s pregravid insulin sensitivity
status. Lean women usually have greater pregravid insulin sensitivity
compared with overweight or obese women. These differences mani-
fest before pregnancy, and when evaluated against the metabolic back-
ground of pregnancy, the relationships are similar in late pregnancy,
albeit reduced by approximately 50% to 60% (Fig. 46-3). The decreases
in insulin sensitivity in late pregnancy are accompanied by an increase
in insulin response. The increased insulin response to a glucose load
increases approximately threefold compared with pregravid measures
(Fig. 46-4).
Diabetic Pregnancy
Alterations in glucose metabolism in women with diabetes have been
most extensively examined in women with GDM, although the altera-
tions in glucose metabolism in women with type 2 diabetes are most
likely very similar but with increased insulin resistance and further
decompensation of beta cell function. In lean and obese women with
GDM with mildly elevated fasting glucose levels, there is a similar
increase in basal endogenous glucose production, as was observed in
subjects with normal glucose tolerance, although fasting insulin con-
centrations, particularly in late gestation, are greater than observed in
normal glucose-tolerant women.28,34
However, during insulin infusion
during euglycemic clamps, the ability of insulin to suppress endoge-
nous glucose production is decreased (approximately 80% versus 95%)
in GDM compared with a matched control group. There is also a sig-
Pregravid
90
100
110
120
130
140
mg/min
150
160
170
180
190
Pϭ.0005
Early
pregnancy
Late
pregnancy
FIGURE 46-2 Alterations in glucose production. Longitudinal
changes in total basal endogenous (primarily hepatic) glucose
production (mean ± SD) from pregravid through early gestation (12
to 14 weeks) and late gestation (34 to 36 weeks). (Adapted from
Catalano PM, Tyzbir ED, Wolfe RR, et al: Longitudinal changes in
basal hepatic glucose production and suppression during insulin
infusion in normal pregnant women. Am J Obstet Gynecol 167:913-
919, 1992.)
Pregravid
*Pϭ.0003
Pϭ.04
Pϭ.005
Glucoseinfusionrate(mg/kg.min)
2
4
6
8
10
12
14
Early
pregnancy
Late
pregnancy
FIGURE 46-3 Alterations in insulin resistance. Longitudinal
changes in glucose infusion rate (i.e., insulin sensitivity) in lean
women from pregravid through early (12 to 14 weeks) and late (34
to 36 weeks) pregnancy during hyperinsulinemic-euglycemic clamp
(mean ± SD). The asterisk indicates change over time from pregravid
status through late pregnancy (ANOVA). (Adapted from Catalano PM,
Tyzbir ED, Roman NM, et al: Longitudinal changes in insulin release
and insulin resistance in non-obese pregnant women. Am J Obstet
Gynecol 165:1667-1672, 1991.)
957CHAPTER 46 Diabetes in Pregnancy
nificant decrease in insulin sensitivity in women who go on to develop
GDM, when estimated before conception or after delivery,35
compared
with a matched control group. During pregnancy, the percent decrease
in insulin sensitivity is approximately the same as the percent change
in a matched control group (i.e., approximately 50% to 60%). The
decreased insulin sensitivity observed during pregnancy in the
woman who develops GDM is a function of her pregravid metabolic
status, and clinically, the increased glucose concentrations represent
the inability of pancreatic beta cells to normalize glucose levels
(Fig. 46-5).
The relationship between insulin sensitivity and insulin response
has been characterized by Bergman and colleagues16
as a hyperbolic
curve or, when multiplied, as the disposition index. A curve that is
“shifted to the left” can be plotted for individuals who go on to develop
GDM (Fig. 46-6). Whether the insulin resistance precedes the beta
cell defect or they occur concomitantly is not known with certainty.
However, Buchanan36
proposed that insulin resistance caused the beta
cell dysfunction in susceptible individuals. The increased risk of type
2 diabetes in women who formerly had GDM may be a function of
decreasing insulin sensitivity (i.e., worsening insulin resistance) exac-
erbated by increasing age, adiposity, and the inability of the beta cells
to fully compensate.
The data on the changes on glucose metabolism in women with
type 1 diabetes are not as well examined. Schmitz and coworkers37
evaluated the longitudinal changes in insulin sensitivity in women with
type 1 diabetes in early and late pregnancy and after delivery. There
was a 50% decrease in insulin sensitivity in late gestation. There was
no significant difference in insulin sensitivity in these women in early
pregnancy or within 1 week of delivery compared with nonpregnant
women with type 1 diabetes. Based on the available data, women with
Pregravid
Pϭ.025
Pϭ.025
*Pϭ.0001
1stPhaseinsulinresponse(μU/mL)2ndPhaseinsulinresponse(μU/mL)
0
100
200
400
300
500
600
700
800
A
B
Early
pregnancy
Late
pregnancy
Pregravid
Pϭ001
*Pϭ.0001
0
1000
2000
4000
3000
5000
Early
pregnancy
Late
pregnancy
FIGURE 46-4 Increased insulin response. Changes in first (A) and
second (B) phase pregravid through early (12 to 14 weeks) and late
(34 to 36 weeks) pregnancy insulin response during an intravenous
glucose tolerance test (mean ± SD). The asterisk indicates change
over time from pregravid status through late pregnancy (ANOVA).
(Adapted from Catalano PM, Tyzbir ED, Roman NM, et al:
Longitudinal changes in insulin release and insulin resistance in non-
obese pregnant women. Am J Obstet Gynecol 165:1667-1672, 1991.)
Control
GDM
Ptϭ0.0001
Pgϭ0.03
Pregravid
0
0.1
0.2
0.3
Early pregnancy Late pregnancy
FIGURE 46-5 Alterations in insulin sensitivity. Longitudinal
changes in insulin sensitivity during clamp 40 mU·m−2
·min−1
insulin
infusion in obese women (mean ± SD). GDM, gestational diabetes
mellitus; Pg, difference between groups; Pt, individual longitudinal
changes with time. (Adapted from Catalano PM, Huston L, Amini SB,
Kalhan SC: Longitudinal changes in glucose metabolism during
pregnancy in obese women with normal glucose tolerance and
gestational diabetes. Am J Obstet Gynecol 180:903-916, 1999.)
0.0
0
200
Insulin sensitivity index (ISI)
GDM
Normal
3rd Trimester Postpartum
Insulinsecretionrate(ISR)
400
600
800
1000
0.1 0.2 0.3 0.4
FIGURE 46-6 Insulin sensitivity and secretion relationships
in normal women and women with gestational diabetes
mellitus. Prehepatic insulin secretion was assessed during
steady-state hyperglycemia using plasma insulin and C-peptide
concentrations and C-peptide kinetics in individual patients. (Printed
with permission from Buchanan TA: Pancreatic β-cell defects in
gestational diabetes: Implications for the pathogenesis and prevention
of type 2 diabetes. J Clin Endocrinol Metab 86:989-993, 2001.)
958 CHAPTER 46 Diabetes in Pregnancy
type 1 diabetes have similar alterations in insulin sensitivity compared
with women with normal glucose tolerance.
Mechanism of Insulin Resistance
The mechanisms related to the changes in insulin resistance during
pregnancy are better characterized because of research in the past
decade. The insulin resistance of pregnancy is almost completely
reversed shortly after delivery,38
consistent with the clinically marked
decrease in insulin requirements. The placenta has long been suspected
of producing hormonal factors related to these alterations in metabo-
lism. The placental mediators of insulin resistance in late pregnancy
have been ascribed to alterations in maternal cortisol concentrations
and placenta-derived hormones such as human placental lactogen
(HPL), progesterone, and estrogen.39-41
Kirwan and associates42
re-
ported that circulating tumor necrosis factor-α (TNF-α) concentra-
tions had an inverse correlation with insulin sensitivity as estimated
from clamp studies. Among leptin, HPL, cortisol, human chorionic
gonadotropin, estradiol, progesterone, and prolactin, TNF-α was the
only significant predictor of the changes in insulin sensitivity from the
pregravid period through late gestation. TNF-α and other cytokines
are produced by the placenta, and 95% of these molecules are trans-
ported to maternal rather than fetal circulations.42
Other factors, such
as circulating free fatty acids, may contribute to the insulin resistance
of pregnancy.43
Studies in human skeletal muscle and adipose tissue have demon-
strated defects in the post-receptor insulin-signaling cascade during
pregnancy. Friedman and colleagues showed that women in late
pregnancy have reduced insulin receptor substrate-1 (IRS-1) concen-
trations compared with those of matched nonpregnant women.44
Downregulation of the IRS-1 protein closely parallels insulin’s
decreased ability to induce additional steps in the insulin signaling
cascade that result in the transporter (GLUT-4) arriving at the cell
surface to allow glucose to enter the cell. Downregulation of IRS-1
closely parallels the decreased ability of insulin to stimulate 2-
deoxyglucose uptake in vitro in pregnant skeletal muscle. During late
pregnancy in women with GDM, in addition to decreased IRS-1 con-
centrations, the insulin receptor-β (i.e., component of the insulin
receptor within the cell rather than on the cell surface) has a decreased
ability to undergo tyrosine phosphorylation.44
This is an important
step in the action of insulin after it has bound to the insulin receptor
on the cell surface. This additional defect in the insulin-signaling
cascade is not found in pregnant or nonpregnant women with
normal glucose tolerance and results in a 25% lower glucose transport
activity. TNF-α also acts by means of a serine/threonine kinase,
thereby inhibiting IRS-1 and tyrosine phosphorylation of the insulin
receptor.45
These post-receptor defects may contribute in part to the
pathogenesis of GDM and an increased risk for type 2 diabetes in later
life.
Complications of Diabetes
during Pregnancy
Maternal Morbidity
Women with pregestational diabetes are at risk for a number of obstet-
ric and medical complications. The relative risk of these problems is
proportional to the duration and severity of disease. Evers and cowork-
ers reported the maternal morbidity of a cohort of 323 type 1 diabetic
pregnancies followed prospectively in the Netherlands.46
Glycemic
control was excellent (Hb A1c ≤7.0% in 75%), but the rates of pre-
eclampsia (12.7%), preterm delivery (32%), cesarean section (44%),
and maternal mortality (60 deaths per 100,000 pregnancies) were con-
siderably higher than in the nondiabetic population.
Retinopathy
Diabetic retinopathy is the leading cause of blindness between the ages
of 24 and 64 years.47
Some form of retinopathy is present in virtually
100% of women who have had type 1 diabetes for 25 years or more;
approximately 20% of these women are legally blind. The topic of
diabetic retinopathy has been reviewed elsewhere.48
The pattern of progression of diabetic retinopathy is predictable,
proceeding from mild nonproliferative abnormalities, which are asso-
ciated with increased vascular permeability, to moderate and severe
nonproliferative diabetic retinopathy, which is characterized by vascu-
lar closure, to proliferative diabetic retinopathy, which is characterized
by the growth of new blood vessels on the retina and posterior surface
of the vitreous. It has been proposed that pregnancy accelerates
these changes, although the mechanism is controversial.49
Trials have
not shown any acceleration in microvascular complications when
pregnant and nonpregnant diabetic subjects were closely followed and
compared.50
Vision loss resulting from diabetic retinopathy results from several
mechanisms. First, central vision may be impaired by macular edema
or capillary nonperfusion. Second, the new blood vessels of prolifera-
tive diabetic retinopathy and contraction of the accompanying fibrous
tissue can distort the retina and lead to tractional retinal detachment,
producing severe and often irreversible vision loss. Third, the new
blood vessels may bleed, adding the further complication of preretinal
or vitreous hemorrhage.
FACTORS AFFECTING PROGRESSION OF
RETINOPATHY DURING PREGNANCY
Although past studies suggested that rapid induction of glycemic
control in early pregnancy stimulated retinal vascular proliferation,51
later investigations indicate that the severity and duration of diabetes
before pregnancy have a greater effect. Temple and colleagues52
studied
179 women with pregestational type 1 diabetes, performing dilated
fundal examination at the first prenatal visit, 24 weeks, and 34 weeks.
Progression to proliferative diabetic retinopathy occurred in only
2.2%, and moderate progression occurred in 2.8%. However, progres-
sion was significantly greater in women who had had diabetes for more
than 10 years (10% versus 0%; P = .007) and in women with moderate
to severe background retinopathy before pregnancy (30% versus 3.7%;
P = .01). In the European Diabetes (EURODIAB) Prospective Compli-
cations Study, 793 potentially childbearing women at baseline com-
pleted the follow-up, and 21% gave birth. Duration of diabetes and
high HbA1c levels at recruitment were significant risk factors for reti-
nopathy progression, whereas giving birth was not.50
OPHTHALMOLOGIC MANAGEMENT
DURING PREGNANCY
Screening for retinopathy by a qualified ophthalmologist is recom-
mended before pregnancy and again during the first trimester for
patients with pregestational diabetes because of the demonstrated
effectiveness of laser photocoagulation therapy in arresting progres-
sion. Patients with minimal disease should be re-examined once
or twice during the pregnancy and at 3 and 6 months after delivery.
Those with significant retinal pathology may require monthly
follow-up.53
959CHAPTER 46 Diabetes in Pregnancy
Nephropathy
Diabetes is the most common cause of end-stage renal disease in the
United States and Europe. In the United States, diabetic nephropathy
accounts for about 45% of new cases of this condition. In 2003, the
cost for treatment of diabetic patients with end-stage renal disease was
in excess of $55,000 annually per person and more than $5 billion in
aggregate.54
About 20% to 40% of patients with type 1 or type 2 dia-
betes develop evidence of nephropathy over time, but the rate and
extent of progression are highly individual.53
The pathophysiology of diabetic renal disease is incompletely
understood, but several factors play a role, including genetic suscepti-
bility, control of hyperglycemia, and the duration and severity of coex-
isting hypertension. Additional insults, such as repeated urinary tract
infections, excessive glycogen deposition, and papillary necrosis, all
hasten deterioration of renal function. The kidney is normal at the
onset of diabetes, but within a few years, glomerular basement mem-
brane thickening can be identified. By 5 years, there is expansion of the
glomerular mesangium, resulting in diffuse diabetic glomerulosclero-
sis. All patients with marked mesangial expansion exhibit proteinuria
exceeding 400 mg in 24 hours. The peak incidence of nephropathy
occurs after about 16 years of diabetes.
CATEGORIES OF DIABETIC NEPHROPATHY
Categories of diabetic nephropathy are distinguished by the level
of urinary protein excretion. Table 46-3 shows normal values and
the current clinical criteria for microalbuminuria and nephropathy.
Screening for microalbuminuria can be performed by three methods:
measurement of the albumin-to-creatinine ratio in a random spot
collection; 24-hour collection with creatinine, allowing the simultane-
ous measurement of creatinine clearance; and timed (e.g., 4-hour or
overnight) collection. The first method is preferred because it is the
easiest to carry out in an ambulatory setting, and it provides adequately
accurate information. The other methods are rarely used.55
EFFECT OF PREGNANCY ON PROGRESSION
OF NEPHROPATHY
Although some clinicians discourage pregnancy in women with
diabetic renal disease because of concerns of permanent renal deterio-
ration as a result of the pregnancy, recent data consistently indicate
that pregnancy does not measurably alter the time course of diabetic
renal disease.
Progression of diabetic nephropathy is closely related to the degree
of glycemic control. To the extent that most women have better glyce-
mic control during pregnancy, delay or slowing of renal function dete-
rioration can be expected. A study of renal function for 4 years before
and 4 years after pregnancy in 11 patients with diabetic nephropathy56
showed that the gradual rise in serum creatinine over that period
was unaffected by the intervening pregnancy. Imbasciati and co-
workers57
performed a longitudinal study of 58 women with chronic
renal disease, following each through pregnancy. The mean serum
creatinine level was 6 mg/dL at the start of the study and 6 mg/dL after
delivery. Although they found that women with glomerular filtration
rates less than 40 mL/min and with proteinuria greater than 1 g/day
had increased risk of delivering a child with a birth weight less than
2500 g (odds ratio [OR] = 5.1; 95% confidence interval [CI], 1.03 to
25.6), the association was not related to renal disease, hypertension,
and maternal age. When the cohort was taken as a whole, even those
with lower glomerular filtration rates and higher levels of proteinuria
had similarly modest changes in renal function when after- and before-
pregnancy indices were compared.57
Rossing and colleagues58
evaluated the effect of pregnancy on dete-
rioration of renal function in 93 women older than 20 years. They
compared groups of never-pregnant and ever-pregnant women who
received similar medical therapy and who had similar degrees of renal
function at the start of the study. The results are shown in Figure 46-7.
Based on this excellent prospective study, it is evident that pregnancy
neither alters the time course of renal disease nor increases the likeli-
hood of transition to end-stage renal disease.
COURSE OF DIABETIC NEPHROPATHY
DURING PREGNANCY
In general, patients with underlying renal disease before pregnancy
can be expected to experience various degrees of deterioration during
pregnancy. The physiologic changes associated with normal pregnancy
increase renal blood flow and glomerular filtration by 30% to 50%.
Most women with preexisting diabetic nephropathy experience this
improvement in renal function, especially during the second trimes-
ter.59
During the third trimester, however, when mean arterial pressure
and peripheral vascular resistance typically increase, women with
diabetic microvascular disease may experience marked diminution of
renal function, an exacerbation in hypertension, and in many cases,
preeclampsia. The third-trimester increase in maternal blood pressure
and serum creatinine concentration are among the most common
FIGURE 46-7 End-stage renal disease. Cumulative incidence of
end-stage renal disease (ESRD) in ever-pregnant (triangles) and never-
pregnant (circles) groups. (From Rossing K, Jacobsen P, Hommel E,
et al: Pregnancy and progression of diabetic nephropathy.
Diabetologia 45:36, 2002.)
TABLE 46-3 CATEGORIES OF DIABETIC
RENAL DISEASE
Category* Albumin-to-Creatinine Ratio (mg/mg)†
Normal <30
Microalbuminuria 30-299
Nephropathy ≥300
*Categories of diabetic nephropathy are distinguished by the level of
urinary protein excretion. Two of three collections in a 3- to 6-month
period should be abnormal for a diagnosis of microalbuminuria or
nephropathy.
†
The ratio of albumin to creatinine was determined by random spot
collection.
Adapted from American Diabetes Association. Standards of medical
care in diabetes. Diabetes Care 28(Suppl 1):S4-S36, 2005.
960 CHAPTER 46 Diabetes in Pregnancy
precipitating events leading to indicated preterm delivery in diabetic
women. Although delivering the fetus to interrupt the precipitous
rise in blood pressure may result in premature birth, this is usually
preferable to the risk of maternal renal failure or stroke (discussed
later).
Reece and colleagues60
reviewed the outcomes of 315 pregnant
women with preexisting diabetic nephropathy. Of these, 17% ulti-
mately developed end-stage renal disease, and 5% died as a result of
renal insufficiency. During pregnancy, proteinuria and mean arterial
pressure significantly increased from the first to the third trimester
(P < .05). Another study by Purdy and coworkers61
demonstrated a rise
in the mean serum creatinine level from 1.8 mg/dL before pregnancy
to 2.5 mg/dL in the third trimester. Renal function was stable in 27%,
transiently worsened during pregnancy in 27%, and demonstrated a
permanent decline in 45%. Proteinuria increased during pregnancy in
79%, and exacerbation of hypertension or preeclampsia occurred in
73%.
Ekbom and colleagues62
compared the outcomes of pregnancies
in women with microalbuminuria or overt nephropathy and those
without. Their results (Fig. 46-8) indicate that the likelihood of preterm
delivery is considerably increased for women with microalbuminuria,
mainly because of preeclampsia.
RENAL DIALYSIS IN DIABETIC
PREGNANT WOMEN
Although women receiving dialysis for end-stage renal disease are
often amenorrheic or at least anovulatory, pregnancies have become
increasingly common63
during therapy (3% to 7%).64
Unfortunately,
the prognosis for pregnancy in diabetic women with end-stage renal
disease continues to be exceedingly poor, with fetal loss rates remaining
in the range of 30% to 50% over the past decade. Neonatal death rates
are between 5% and 15%, and less than one half of pregnancies among
women with end-stage renal disease result in viable children. About
60% of births are premature, often because of uncontrollable hyper-
tension, renal failure, or fetal growth failure.65
Of the 20% to 25% of
pregnancies ending in live births, 40% of babies are severely growth
restricted.
A major practical problem with achieving a successful pregnancy
outcome while on hemodialysis is proper maintenance of maternal
vascular volume. Dialysis teams are accustomed to removing signifi-
cant vascular volume at each session. However, during a normal preg-
nancy, there is a progressive expansion in vascular volume of at least
20% to 30% above nonpregnant values from 8 to 30 weeks’ gestation.
This volume augmentation is required to maintain uteroplacental per-
fusion and fetal growth. Pregnancies in which vascular volume does
not increase appropriately have a high incidence of fetal growth restric-
tion and stillbirths. Difficulties with vascular underfill (e.g., hyperten-
sion, poor fetal growth, asphyxia) and overfill (e.g., hypertension) are
common in pregnant patients on hemodialysis and often are difficult
to rectify.
The poor prognosis associated with hemodialysis combined with
other considerations has prompted increased interest in continuous
ambulatory peritoneal dialysis. Several successful pregnancy series
have been reported.65-67
Although fluid and chemical balance is con-
stant and heparinization is not necessary, intrauterine deaths, abrup-
tion, prematurity, hypertension, and fetal distress still occur. The best
strategy for most diabetic women on dialysis desiring pregnancy is to
undergo kidney transplantation.
RENAL TRANSPLANTATION
Successful pregnancy after renal transplantation is now a reality.
Davison’s67
review of 1569 pregnancies in women with renal allografts
found that of the 60% of pregnancies that continued beyond the first
trimester, 92% resulted in a viable infant. Preeclampsia occurred
in 30%, preterm delivery in about 50%, and IUGR in 20%. Patients
with the worst renal function had the poorest pregnancy outcomes.
Similar results were reported by Yassaee and Moshiri.68
The most
common maternal complications in 95 pregnancies were anemia
in 65%, and preeclampsia in 47%. Three patients lost their graft,
and six had impaired kidney allograft function 2 years after
pregnancy.68
In a historical cohort study, 86 women who had at least one post-
transplantation pregnancy were compared with 125 who had no preg-
nancy after renal transplantation. Patients were matched for age, cause
of end-stage renal disease, treatment protocol, and first serum creati-
nine level. The 5-year patient and graft survival rates were not signifi-
cantly different between the study groups. Among the women with at
least one pregnancy, only 10% had serum creatinine levels above
1.5 mg/dL at the end of 46 months of follow-up, compared with 28%
of the never-pregnant group.69
Based on these findings, it appears that
perinatal outcomes are better in patients who have undergone renal
100%
90%
80%
70%
60%
50%
40%
30%
20%
10%
0%
Preterm birth IUGR Preeclampsia
Normal
Microalbuminuria
Nephropathy
FIGURE 46-8 Outcomes of pregnancies in women with
microalbuminuria or overt nephropathy. Pregnancy outcomes are
compared for diabetic women with underlying renal disease. IUGR,
intrauterine growth restriction. (Adapted from Ekbom P, Damm P,
Feldt-Rasmussen U, et al: Pregnancy outcome in type 1 diabetic
women with microalbuminuria. Diabetes Care 24:1739, 2001.
Copyright © American Diabetes Association. Reprinted with
permission from the American Diabetes Association.)
961CHAPTER 46 Diabetes in Pregnancy
transplantation than in those with end-stage renal disease who are on
dialysis.
Cardiovascular Complications
Cardiovascular complications experienced by pregnant women with
diabetes include chronic hypertension, pregnancy-induced hyperten-
sion, and rarely, atherosclerotic heart disease. In composite studies
of all types of diabetic pregnancies, the incidence of hypertensive
disorders during pregnancy varies from 15% to 30%,70,71
with the rate
of hypertension increased fourfold over that for the nondiabetic
population.72
CHRONIC HYPERTENSION
Chronic hypertension (i.e., blood pressure at or above 140/90
mm Hg before 20 weeks’ gestation)73
complicates 10% to 20% of preg-
nancies in diabetic women and up to 40% of those in diabetic women
with preexisting renal or retinal vascular disease.74
The perinatal prob-
lems encountered with chronic hypertension include IUGR, maternal
stroke, preeclampsia, and abruptio placentae. In pregestational diabe-
tes, the prevalence of chronic hypertension increases with duration of
diabetes and is closely associated with nephropathy.72,75
The Diabetes in Early Pregnancy (DIEP) study reported that women
with type 1 diabetes have higher mean blood pressures throughout
pregnancy than do normal controls.76
In a significant proportion
of patients, this difference is probably evidence of underlying renal
compromise. Preexisting chronic hypertension should be suspected
when the diabetic patient’s systolic blood pressure exceeds
130/80 mm Hg before the third trimester. The diagnosis is strength-
ened by finding a failure of mean blood pressure to decline normally
in the late second trimester, elevation in the blood urea nitrogen level
above 10 mg/dL, serum creatinine concentration above 1 mg/dL, cre-
atinine clearance less than 100 mL/min, or a combination of these
factors.
PREECLAMPSIA
Preeclampsia is more common among women with diabetes, occur-
ring four times as frequently in women with pregestational diabetes as
in those without diabetes.72
The risk of developing preeclampsia is
proportional to the duration of diabetes before pregnancy and the
existence of nephropathy and hypertension; more than one third of
pregnant women who have had diabetes for more than 20 years develop
this condition. As is shown in Figure 46-9, patients with White class B
diabetes have a risk profile similar to that of nondiabetic patients, but
women with evidence of renal or retinal vasculopathy (classes D, F, or
R) have a 50% excess risk of hypertensive complications over the rate
observed for those with no hypertension. Women with diabetic
nephropathy have similar rates of preeclampsia.
Renal function assessments should be performed in each trimester
in women with overt diabetic vascular disease and in those who have
had diabetes for more than 10 years. Significant proteinuria, plasma
uric acid levels above 6 mg/dL, or evidence of HELLP syndrome
(hemolysis, elevated liver enzymes, and low platelets) should prompt a
workup for preeclampsia.
HEART DISEASE
Although coronary heart disease is rarely encountered in preg-
nant women with diabetes, a study by Airaksinen and colleagues77
suggests that such women may have preclinical cardiomyopathy and
autonomic neuropathy. The diabetic women studied had less than the
expected increase in left ventricular size and stroke volume in preg-
nancy, lower heart rate increases, and smaller increments in cardiac
output.
Although uncommon, atherosclerotic heart disease (White class H)
may afflict diabetic patients in the later reproductive years. Patients
with this complication have a mean age of 34 years and exhibit other
evidence of diabetic vascular involvement (White class D or R).78
For
diabetic women with cardiac involvement, pregnancy outcome is
0%
Percentpreeclampsia
No
hypertension
HypertensionHypertension
and
proteinuria
Class B Class C Class D Class F/R
5%
10%
15%
20%
25%
30%
35%
40%
FIGURE 46-9 Likelihood of preeclampsia in diabetic pregnancy by White’s class and preexisting
hypertension. The risk of developing preeclampsia is proportional to the duration of diabetes before pregnancy
and the existence of nephropathy and hypertension. (From Sibai BM, Caritis S, Hauth J, et al: Risks of
preeclampsia and adverse neonatal outcomes among women with pregestational diabetes mellitus. National
Institute of Child Health and Human Development Network of Maternal-Fetal Medicine Units. Am J Obstet
Gynecol 182:364, 2000.)
962 CHAPTER 46 Diabetes in Pregnancy
dismal, with a maternal mortality rate of 50% or higher and perinatal
loss rates approaching 30%.79
Recognition of cardiac compromise in
pregnant women with diabetes may be difficult because of the decrease
in exercise tolerance that occurs during normal pregnancy. Compro-
mised cardiac function may also be difficult to detect in patients
restricted to bed rest for hypertension or poor fetal growth. It is
prudent to obtain a detailed cardiovascular history in all diabetic
patients and to consider electrocardiography and maternal echocar-
diography in patients who have type 1 diabetes and are older than 30
years or in patients who have had diabetes for 10 years or more. With
intensive monitoring, successful pregnancy is possible, albeit hazard-
ous for women with significant cardiac disease.80
Diabetic Ketoacidosis
Diabetic ketoacidosis (DKA) during pregnancy is a medical emergency
for the mother and fetus. Pregnant women with type 1 diabetes are at
increased risk for DKA, although the incidence and morbidity of this
complication have decreased from 20% or more in the older literature
to approximately 2% in later reports.81
The rate of intrauterine fetal
death, formerly as high as 35% with DKA during pregnancy, has
dropped to 10% or less.
Precipitating factors for ketoacidosis include pulmonary, urinary,
or soft tissue infections; poor compliance; and unrecognized new onset
of diabetes. Because severe DKA threatens the life of the mother and
fetus, prompt treatment is essential. Fetal well-being in particular is in
jeopardy until maternal metabolic homeostasis is reestablished. High
levels of plasma glucose and ketones are readily transported to the
fetus, which may be unable to secrete sufficient quantities of insulin to
prevent DKA in utero.
DKA evolves from inadequate insulin action and functional hypo-
glycemia at the target tissue level. This leads to increased hepatic
glucose release but decreased or absent tissue disposal of glucose.
Glucose-lacking tissues release ketone bodies, and vascular hypergly-
cemia promotes osmotic diuresis. Over time, the diuresis causes pro-
found vascular volume depletion and loss of electrolytes. The release
of stress hormones (i.e., catecholamines, glucagon, growth hormone,
and cortisol) further impairs insulin action and contributes to insulin
resistance. Left unchecked, this cycle of dehydration, tissue hypoglyce-
mia, and electrolyte depletion can lead to multisystem collapse, coma,
and death.
Early in the illness, hyperglycemia and ketosis are moderate. If
hyperglycemia is not corrected, diuresis, dehydration, and hyperosmo-
lality follow. Pregnant women in the early stages of ketoacidosis
respond quickly to appropriate treatment of the initiating cause (e.g.,
broad-spectrum antibiotics), additional doses of regular insulin, and
volume replacement.
Patients with advanced DKA usually present with typical findings,
including hyperventilation, normal or obtunded mental state (depend-
ing on severity of the acidosis), dehydration, hypotension, and a fruity
odor to the breath. Abdominal pain and vomiting may be prominent
symptoms. The diagnosis of DKA is confirmed by the presence of
hyperglycemia (glucose >200 mg/100 mL) with positive test results for
serum ketones at a level of 1:4 or greater.
As many as one third of patients in the early or very late stages of
DKA may have initial blood glucose levels less than 200 mg/dL.82
A
pregnant diabetic patient with a history of poor food intake or vomit-
ing for more than 12 to 16 hours should have a thorough workup for
DKA, including a complete blood cell count and electrolyte determina-
tions. A serum bicarbonate level below 18 mg/dL should prompt per-
formance of an arterial blood gas analysis. In all cases of DKA, the
diagnosis is confirmed by arterial blood gases demonstrating a meta-
bolic acidemia (i.e., base excess of −4 or lower).83
Table 46-4 contains a protocol for treatment of DKA. The impor-
tant steps in management should include the following:
᭿ Search for and treat the precipitating cause. Typical initiators
include pyelonephritis and pulmonary or gastrointestinal viral
infections.
᭿ Perform vigorous and sustained volume resuscitation. The
patient will continue to generate vascular volume deficits
TABLE 46-4 TREATMENT PROTOCOL FOR DIABETIC KETOACIDOSIS*
Measures Initial Phase (6-24 hr) Recovery Phase
General Search for initiating cause of ketoacidosis.
Insert bladder catheter.
If patient is unconscious, establish nasogastric tube.
Continue treatment of initiating cause.
Remove bladder catheter when vascular volume is replaced.
Fluids Administer 0.9% NaCl at 1000 mL/hr × 2 hr and then
500 mL/hr until 5-8 L infused.
Continue 0.9% NaCl at 100 mL/hr for at least 48 hours to avoid
return of ketoacidosis.
Insulin Administer 20 U of insulin by IV bolus and then 5-10 U/hr
by IV infusion.
When acidosis is resolved and plasma glucose <160 mg/dL,
reduce insulin infusion to 0.7-2.0 U/hr.
Return to patient’s prior SC insulin dosing after plasma glucose
is stable for at least 12 hr.
Glucose When plasma glucose is <250 mg/dL, add 5% dextrose to
0.9% NaCl.
Potassium If serum K+
level is normal or low, infuse KCl at 20 mEq/hr.
If serum K+
level is high, wait until K+
is normal, then KCl
at 20 mEq/hr.
Measure serum K+
level every 2-4 hr.
Use oral potassium supplementation for 1 week.
Bicarbonate If pH is <7.1, add one ampule of bicarbonate (50 mEq) to
IV; repeat until pH >7.1.
*These are general guidelines. Because there may be wide variation in individual patient needs, there is no substitute for careful monitoring of each
patient, particularly in the initial phase of therapy.
IM, intramuscular; IV, intravenous; KCl, potassium chloride; NaCl, sodium chloride; SC, subcutaneous.
Adapted from American College of Obstetricians and Gynecologists (ACOG): Clinical management guidelines for obstetrician-gynecologists. ACOG
practice bulletin no. 60, March 2005. Pregestational diabetes mellitus. Obstet Gynecol 105:675-685, 2005.
963CHAPTER 46 Diabetes in Pregnancy
until her glucose levels and acidosis are largely resolved. A
physiologic fluid such as 0.9% NaCl with 20 mEq/L of
potassium should be used and continued until the acidosis is
substantially corrected (base excess of −2 or less). This usually
requires an infusion at 1 to 2 L/hr for the first 1 to 2 hours,
followed by reduced rates (150 to 200 mL/hr) until the base
deficit approaches a normal level.
᭿ Place a bladder catheter to monitor urine output.
᭿ Use insulin to correct hyperglycemia. Although intermittent
injections can be used, a continuous infusion of regular or
short-acting insulin (i.e., lispro or aspart) allows frequent
adjustments. When giving insulin as a continuous infusion,
1 to 2 units/hr gradually corrects the patient’s glucose
abnormality over 4 to 8 hours. Attempts to normalize plasma
glucose levels rapidly (i.e., in less than 2 to 3 hours) may result
in hypoglycemia and further physiologic counterregulatory
responses.
᭿ Monitor serum bicarbonate levels and arterial blood gas base
deficits every 1 to 3 hours to guide management. Even when
the plasma glucose level is normalized, acidemia may persist,
as evidenced by continuing abnormalities in the patient’s
electrolyte concentrations. Unless volume therapy is
continued until the patient’s electrolyte stores and plasma
concentrations have substantially returned to normal, DKA
may reappear, and the cycle of metabolic derangement will
be renewed.
When DKA occurs after 24 weeks’ gestation, fetal status should be
continuously monitored by fetal heart rate monitoring or a biophysical
profile, or both. However, even when fetal status is questionable during
the phase of therapeutic volume and plasma glucose correction, emer-
gency cesarean section should be avoided. Usually, correction of the
maternal metabolic disorder is effective in normalizing fetal status.
Nevertheless, if a reasonable effort has been expended in correcting the
maternal metabolic disorder and the fetal status remains a concern,
delivery should not be delayed.
Fetal Morbidity and Mortality
Perinatal mortality in diabetic pregnancy has decreased 30-fold since
the discovery of insulin in 1922 and the institution of intensive
obstetric and infant care in the 1970s. Improved techniques of main-
taining maternal euglycemia have led to later timing of delivery and
reduced iatrogenic respiratory distress syndrome. Nevertheless, the
perinatal mortality rates reported for diabetic women remain appro-
ximately twice those observed in the nondiabetic population (Table
46-5). Congenital malformations, respiratory distress syndrome, and
extreme prematurity account for most perinatal deaths in diabetic
pregnancies.
Miscarriage
Studies of miscarriage rates from a decade ago indicated an increased
incidence of spontaneous abortion among women with pregestational
diabetes, especially those with poor glucose control during the peri-
conceptional period. Given the well-documented association between
congenital anomalies and hyperglycemia, such a finding is not surpris-
ing. Sutherland and Pritchard84
reported the outcomes of 164 diabetic
pregnancies managed with relaxed glycemic control and found a spon-
taneous abortion rate of almost double the expected rate. Miodovnik
and coworkers85
studied spontaneous abortion in diabetic pregnancy
prospectively and found an increasing rate among patients with more
advanced classes of diabetes (rates for classes C, D, and F were 25%,
44%, and 22%, respectively). Later studies of populations with better
glycemic control report miscarriage rates similar to those in the non-
diabetic population,86,87
indicating that diabetic women with excellent
glycemic control have a risk of miscarriage equivalent to those without
diabetes.
These studies can be used to encourage patients who have not yet
conceived to achieve excellent glycemic control. Patients presenting in
early pregnancy with normal glycohemoglobin values can be reassured
that the overall elevation in risk of miscarriage is modest. However, for
patients with glycohemoglobin values 2 to 3 standard deviations above
the norm, intense early pregnancy surveillance is indicated.
Congenital Anomalies
Among women with overt diabetes before conception, the risk of a
structural anomaly in the fetus is increased fourfold to eightfold,88
compared with the 1% to 2% risk for the general population. In a
cohort study of 2359 pregnancies in women with pregestational dia-
betes, the major congenital anomaly rate was 4.6% overall, with 4.8%
for type 1 diabetes and 4.3% for type 2 diabetes, more than double the
expected rate. Neural tube defects were increased 4.2-fold and congeni-
tal heart disease by 3.4-fold. Of all anomalies confirmed in the neonate,
only 65% were diagnosed antenatally.9
The typical congenital anoma-
lies observed in diabetic pregnancies and their frequency of occurrence
are listed in Table 46-6.
There is no increase in birth defects among offspring of diabetic
fathers and nondiabetic women and women who develop gestational
diabetes after the first trimester, indicating that glycemic control during
embryogenesis is the main factor in the genesis of diabetes-associated
birth defects. A classic report by Miller and coauthors89
compared the
frequency of congenital anomalies in patients with normal or high
first-trimester maternal glycohemoglobin levels and found only a 3.4%
rate of anomalies with an Hb A1c value less than 8.5%, whereas the rate
TABLE 46-5 PERINATAL MORTALITY RATES IN
DIABETIC PREGNANCY*
Group Gestational Overt Normal†
Fetal mortality rate (%)* 4.7 10.4 5.7
Neonatal mortality rate (%)* 3.3 12.2 4.7
Perinatal mortality rate (%)* 8.0 22.6 10.4
*Mortality rates = deaths per 1000 live births.
†
Normal was determined from California data from 1986; figures were
corrected for birth weight, sex, and race.
TABLE 46-6 CONGENITAL MALFORMATIONS
IN INFANTS OF INSULIN-
DEPENDENT DIABETIC MOTHERS
Anomaly
Approximate
Relative Risk
Percent
Risk (%)
All cardiac defects 18 8.5
All central nervous system anomalies 16 5.3
Anencephaly 13
Spina bifida 20
All congenital anomalies 8 18.4
Adapted from Becerra JE, Khoury MJ, Cordero JF, et al: Diabetes
mellitus during pregnancy and the risks for specific birth defects:
A population based case-control study. Pediatrics 85:1, 1990.
964 CHAPTER 46 Diabetes in Pregnancy
of malformations in patients with poorer glycemic control in the peri-
conceptional period (Hb A1c above 8.5) was 22.4%. Lucas and cowork-
ers90
reported an overall malformation rate of 13.3% in 105 diabetic
patients. However, the risk of delivering a malformed infant was zero
with an Hb A1 value less than 7%, 14% with Hb A1 between 7.2% and
9.1%, 23% with Hb A1 between 9.2% and 11.1%, and 25% with Hb A1
greater than 11.2%.
PATHOGENESIS
The mechanism by which hyperglycemia disturbs embryonic devel-
opment is multifactorial. The potential teratologic role of disturbances
in the metabolism of inositol, prostaglandins, and reactive oxygen
species has been established.91
Embryonic hyperglycemia may promote
excessive formation of oxygen radicals in susceptible fetal tissues,
which are inhibitors of prostacyclin.92
The resulting overabundance of
thromboxanes and other prostaglandins may then disrupt the vascu-
larization of developing tissues. In support of this theory, addition of
prostaglandin inhibitors to mouse embryos in culture medium pre-
vented glucose-induced embryopathy.93
The pathogenic role of free
radical species in teratogenesis with diabetes has been underscored by
demonstrating the effect of dietary antioxidants experimentally. High
doses of vitamins C and E decreased fetal dysmorphogenesis to non-
diabetic levels in rat pregnancy and rat embryo culture.94,95
PREVENTION
Because the critical time for teratogenesis is during the period 3 to
6 weeks after conception, nutritional and metabolic intervention must
be instituted preconceptionally to be effective. Several clinical trials of
preconceptional metabolic care have demonstrated that malformation
rates equivalent to those in the general population can be achieved
with meticulous glycemic control.96
Although studies of dietary folate
and vitamin C supplementation have demonstrated success in reduc-
ing the incidence of congenital anomalies in experimental diabetes in
rats,97
the efficacy of a high-antioxidant diet in preventing diabetes-
induced structural anomalies in humans has not been adequately
explored. Preconceptional management of pregestational diabetics is
discussed in the following sections.
Intrauterine Growth Restriction
Although the weights of infants of diabetic mothers (IDMs) usually
are skewed into the upper range, IUGR occurs with significant fre-
quency in diabetic pregnancies, especially in women with underlying
vascular disease. Additional factors that increase the risk for IUGR in
a diabetic pregnancy include the higher incidence of structural anoma-
lies and maternal hypertension.
Asymmetrical IUGR is encountered most frequently in diabetic
patients with vasculopathy (i.e., retinal, renal, or chronic hyperten-
sion).88
This association suggests that uteroplacental vasculopathy may
promote restricted fetal growth in these patients.98
Patients with poor
glycemic control and frequent episodes of ketosis and hypoglycemia
are also prone to preeclampsia and poor fetal growth. Whether fetal
growth restriction results from poor maternal-placental blood flow or
intrinsically poor placental function is unresolved.99
Fetal Obesity
Macrosomia has been defined using various criteria, which include
birth weight greater than the 90th percentile, birth weight greater than
4000 g, and estimates of neonatal adiposity based on body composi-
tion measures. As early as 1923, research by Moulton100
described vari-
ability in weight among various mammalian species that was attributed
to the amount of adipose tissue or fat mass rather than lean body mass.
Using autopsy data and chemical analysis of 169 stillbirths, Sparks101
described a relatively comparable rate of accretion of lean body mass
in fetuses that were small for gestational age (SGA), average for gesta-
tional age (AGA), and large for gestational age (LGA), but he found
considerable variation in the accretion of fetal fat in utero. The human
fetus at term has the greatest percent of body fat (approximately 10%
to 12%) compared with other mammals.102
GROWTH DYNAMICS
The increased growth of the mother is composed primarily of total
body water and adipose tissue in early gestation.26
Relative to the feto-
placental unit, the human placenta attains most of its growth by the
middle of the second trimester. In contrast, approximately 70% of fetal
growth occurs over the last third of gestation (1000 g at 28 weeks to
3500 g at term). Yang and associates6
reported that IDMs with diabetes
still have an increased relative risk (RR) of being LGA (RR = 3.59;
95% confidence interval [CI], 1.55 to 5.84) compared with the infants
of women with normal glucose tolerance.100
Ogata and colleagues,103
using serial ultrasound measures of the fetus of women with diabetes,
described an increase in the rate of abdominal circumference growth
after 24 weeks’ gestation. The increase in growth appears to affect pri-
marily insulin-sensitive tissues such as the subcutaneous fat included
in measures of abdominal circumference.104
Ninety-five percent of the
variance in fetal abdominal circumference can be accounted for by
subcutaneous fat rather than intra-abdominal measures such as liver
size. This is consistent with the inability of the fetal liver to store much
glycogen in early third trimester. Reece and coworkers105
showed that
fetuses of diabetic mothers have normal growth of lean body mass such
as head and skeletal growth, even when there is marked hyperglycemia.
In longitudinal ultrasound studies, Bernstein and associates106
reported
that fetal fat and lean body mass demonstrate unique growth profiles.
These unique ultrasound profiles potentially provide a more sensitive
marker of abnormal fetal growth, particularly in infants of women
with diabetes based on the increased fat mass rather than lean mass of
these neonates.106
At delivery, body composition studies by Catalano
and colleagues107
have shown that birth weight alone, even when AGA,
may not be a sensitive enough measure of fetal growth in the infant of
the diabetic mother. They reported that although there were no sig-
nificant differences in birth weight or lean body mass, the infants of
women with GDM had increased fat mass and percent body fat com-
pared with a normoglycemic control group (Table 46-7).
PATHOPHYSIOLOGY OF FETAL OVERGROWTH
Maternal Glucose Concentrations. Because glucose is the most
easily measured nutrient and marker of diabetes, most studies evaluat-
ing the effect of diabetes on fetal growth have used measures of glucose
as a reference. Findings from the DIEP indicate that birth weight cor-
related best with second- and third-trimester postprandial glucose
measures. When 2-hour postmeal glucose measures averaged 120 mg/
dL or less, approximately 20% of infants were macrosomic. In contrast,
when 2-hour postprandial glucose measures averaged up to 160 mg/
dL, the rate of macrosomia reached 35%.108
Similarly, Combs and
coworkers109
reported that macrosomia was significantly associated
with postprandial glucose levels between 29 and 32 weeks’ gestation.109
In contrast, Persson and associates110
showed that fasting glucose
concentrations account for 12% of the variance in birth weight and
correlated best with estimates of neonatal fat. Uvena and colleagues111
found the strongest correlation was between fasting glucose and neo-
natal adiposity, rather than postprandial measures.
Fetal Insulin Concentrations. Based on the early work of Ped-
ersen,112
fetal insulin has long been considered a principal driving
965CHAPTER 46 Diabetes in Pregnancy
factor of in utero fetal growth. Experimental data gathered from non-
human primates by Susa and coworkers113
showed that in the rhesus
monkey when implanted with an Alzet pump, which delivered con-
tinuous, increasing insulin concentrations to the fetus independent of
the mother’s metabolic condition, there was evidence of fetal over-
growth.111
In contrast, when genetic mutations such as glucokinase
deficiencies existed only in the fetus, the inability of the beta cell to
respond to increasing glucose concentrations results in fetal growth
restriction.25
Many studies have confirmed the correspondence of
increased cord insulin concentrations with fetal macrosomia. Schwartz
and associates114
found that umbilical cord insulin concentrations at
delivery correlated with the degree of macrosomia. Cordocentesis
studies in late third trimester showed that the ratio of fetal plasma
insulin to glucose and the degree of macrosomia were strongly corre-
lated.115
Krew and colleagues116
reported that amniotic fluid C-peptide
measures at term had a strong correlation with fetal adiposity but not
lean body mass.
The relationship between elevated insulin concentrations and fetal
macrosomia exists in late pregnancy, and there is evidence of altered
metabolic function in early gestation. Carpenter and colleagues117
reported that elevated amniotic fluid insulin concentrations obtained
from normoglycemic patients at 14 to 20 weeks’ gestation and adjusted
for maternal age and weight correlated with the likelihood of subse-
quently diagnosed GDM (OR = 1.9; CI, 1.3 to 2.4). Each increase in
amniotic fluid insulin multiple of the median (MOM) was associated
with a threefold increase in fetal macrosomia.117
These data support
the concept that the underlying pathophysiology of GDM and fetal
macrosomia may exist earlier in gestation than is routinely screened
for and that it is consistent with subclinical pregravid maternal meta-
bolic disturbances.
Growth Factors. There has been considerable interest in the role
of insulin-like growth factors (IGFs) and fetal growth. Members of the
IGF family have been implicated in abnormalities of increased and
decreased fetal growth in humans. IGF-1 and the ratio of IGF-2 to
the IGF-2 soluble receptor have been positively correlated with the
Ponderal index.118
However, there is also direct evidence using rodent
knockout models. Baker and coworkers119
reported that null mutations
for the IGF1 or IGF2 gene decreases neonatal weight by 40% in mice.
The effect of both genes is additive.119
Liu and associates120
previously
reported that IGF-1, IGF-2, and IGF-binding protein-3 (IGFBP-3)
were significantly elevated in women with type 1 and 2 diabetes com-
pared with a control group. These data are consistent with the findings
of other investigators, including data for women with type 1 and 2
diabetes.121,122
Roth and colleagues123
reported that cord levels of IGF-1
were significantly greater in macrosomic IDMs than in nonmacroso-
mic infants of glucose-tolerant or diabetic mothers. Radaelli and
coworkers124
showed that there was a strong negative correlation
between maternal circulating IGFBP-1 and lean body mass in the
infants. The study authors speculated that IGFBP-1 might influence
fetal growth by affecting IGF mediated placental nutrient transport,
particularly of glucose or amino acids rather than lipids. Decreased
IGFBP-1 levels are in keeping with a potential negative transcriptional
regulation of the IGFBP1 gene by insulin.124
Maternal Obesity. Obesity is an epidemic in developed countries
and the developing world.125
In the United States, the prevalence of
obesity, defined as a body mass index (BMI = weight/height2
) greater
than 30 rose to 30.5% in 2000, compared with 22.9% from 1994
through 1998. The proportion of the population meeting the defini-
tion of overweight (BMI > 25) increased from 55.9% to 64.5% during
the same period.18
The risk of obesity is disproportionate among the
races, increasing most among African Americans and Hispanics, the
same populations at risk for type 2 diabetes. Several studies suggest
that maternal obesity before conception has an independent effect on
fetal macrosomia. Vohr and associates126
analyzed various risk factors
for neonatal macrosomia in women with overt and GDM compared
with obese and normal weight controls.126
Multiple regression analyses
revealed the pre-pregnancy weight and weight gain were significant
predictors for infants of GDM and control mothers. In an effort to
better understand the potential independent effect of maternal obesity
on growth of infants of GDM and normoglycemic women, Catalano
and colleagues127
performed a stepwise logistic regression analysis on
data for 220 infants of mothers with normal glucose tolerance and 195
infants of GDM (Table 46-8). Gestational age at term had the strongest
correlation with birth weight and lean body mass. In contrast, maternal
pregravid BMI had the strongest correlation (approximately 7%) with
fat mass and percent body fat. Although almost 50% of the subjects
had GDM, only 2% fraction of the variance was correlated to fat
mass.127
These data support an independent effect of maternal pre-
gravid obesity on fetal growth, particularly fat mass, independent of
GDM.
Other Fuels. Many factors are related to fetal overgrowth of the
infant of a woman with diabetes. The significant decreases in insulin
sensitivity in late gestation affect glucose and lipid and amino acid
metabolism. Although we clinically concentrate on glucose, other
nutrients most probably contribute to fetal overgrowth. This concept
is consistent with the hypothesis of fuel-mediated teratogenesis first
proposed by Freinkel in 1980.128
Circulating amino acid concentrations
reflect the balance between protein breakdown and synthesis. Dug-
gleby and Jackson129
estimated that there is a 15% increase in protein
synthesis during the second trimester and a further 25% increase in
the third trimester compared with levels in nonpregnant women.
These differences appear to have a strong relationship to fetal growth,
particularly lean body mass. Butte and coworkers130
and Metzger and
associates131
independently reported higher amino acid concentrations
in women with GDM compared with a normoglycemic control group.
Zimmer and colleagues132
reported no significant difference in amino
acid turnover in women with GDM and a control group. However, the
TABLE 46-7 NEONATAL ANTHROPOMETRICS
OF NEWBORNS OF WOMEN WITH
GESTATIONAL DIABETES
MELLITUS AND NORMAL
GLUCOSE TOLERANCE
Feature Measured*
GDM
(n = 195)
NGT
(n = 220) P Value
Weight (g) 3398 ± 550 3337 ± 549 .26
Fat free mass (g) 2962 ± 405 2975 ± 408 .74
Fat mass (g) 436 ± 206 362 ± 198 .0002
Body fat (%) 2.4 ± 4.6 10.4 ± 4.6 .0001
Skinfold
Triceps 4.7 ± 1.1 4.2 ± 1.0 .0001
Subscapular 5.4 ± 1.4 4.6 ± 1.2 .0001
Flank 4.2 ± 1.2 3.8 ± 1.0 .0001
Thigh 6.0 ± 1.4 5.4 ± 1.5 .0001
Abdominal wall 3.5 ± 0.9 3.0 ± 0.8 .0001
*Data are presented as the mean ± SD.
GDM, gestational diabetes mellitus; NGT, normal glucose tolerance.
Adapted from Catalano PM, Thomas A, Huston-Presley L, Amini SB:
Increased fetal adiposity: A very sensitive marker of abnormal in utero
development. Am J Obstet Gynecol 189:1698-1704, 2003.
966 CHAPTER 46 Diabetes in Pregnancy
investigators found that hyperinsulinemia was required to maintain
normal amino acid turnover in the GDM women.132
Kalhan and
coworkers133
reported that leucine turnover and oxidation were greater
in the obese woman with GDM compared with less obese control
subjects. The increased insulin concentrations required to maintain
appropriate amino acid levels in the woman with diabetes may be
another manifestation of the increased insulin resistance in pregnant
women with GDM.
Knopp and associates134
found that there is a twofold to fourfold
increase in triglyceride concentrations and a 25% to 50% increase in
cholesterol during gestation. This group also reported a further increase
in triglyceride and high-density lipoprotein cholesterol concentrations
in type 2 and GDM patients.135
Similarly, Xiang and colleagues43
described increased basal free fatty acid concentrations in Hispanic
women with GDM in the third trimester compared with a matched
control group.136
Knopp and coworkers137
also reported that mid-tri-
mester triglyceride concentrations were a better predictor of macroso-
mia than glucose values during the glucose tolerance test. Similarly,
Kitajima and colleagues138
examined lipid profiles in women with an
abnormal glucose challenge test in pregnancy and reported that the
triglycerides had a significant correlation with birth weight, even after
adjusting for significant covariables. Although lipid transport from the
mother to fetus is not well understood, maternal lipid metabolism may
play a significant role in fetal growth, particularly in accrual of adipose
tissue.
Birth Injury
Birth injury is more common among the offspring of diabetic mothers,
and macrosomic fetuses are at the highest risk.139
The most common
birth injuries associated with diabetes are brachial plexus palsy, facial
nerve injury, humerus or clavicle fracture, and cephalhematoma. Athu-
korala and associates140
studied women with gestational diabetes and
found a positive relationship between the severity of maternal fasting
hyperglycemia and the incidence of shoulder dystocia, with a doubling
of risk with each 1-mmol increase in the fasting plasma glucose value
on the OGTT. Shoulder dystocia occurred more often in diabetic deliv-
eries requiring operative vaginal assistance (RR = 9.58; CI, 3.70 to
24.81: P < .001) and in fetuses above the 90th percentile of birth weight
for age (RR = 4.57; CI, 1.74 to 12.01; P < .005) (Fig. 46-10).
Most of the birth injuries occurring in infants of diabetic pregnancy
are associated with difficult vaginal delivery and shoulder dystocia.
Although shoulder dystocia occurs in 0.3% to 0.5% of vaginal deliver-
ies among normal pregnant women, the incidence is twofold to four-
fold higher for women with diabetes because the excessive fetal fat
deposition associated with hyperglycemia in poorly controlled diabetic
pregnancy causes the fetal shoulder and abdominal widths to become
massive.140
Although one half of shoulder dystocias occur in infants of
normal birth weight (2500 to 4000 g), the incidence of shoulder dys-
TABLE 46-8 STEPWISE REGRESSION
ANALYSIS OF FACTORS RELATING
TO FETAL GROWTH AND BODY
COMPOSITION IN INFANTS OF
WOMEN WITH GESTATIONAL
DIABETES MELLITUS (n = 195)
AND NORMAL GLUCOSE
TOLERANCE (n = 220)
Factor r 2
Dr 2
P value
Birth Weight
Estimated gestational age 0.114 —
Pregravid weight 0.162 0.048
Weight gain 0.210 0.048
Smoking (−) 0.227 0.017
Parity 0.239 0.012 .0001
Lean Body Mass
Estimated gestational age 0.122 —
Smoking (−) 0.153 0.031
Pregravid weight 0.179 0.026
Weight gain 0.212 0.033
Parity 0.225 0.013
Maternal height 0.241 0.016
Paternal weight 0.250 0.009 .0001
Fat Mass*
Pregravid BMI 0.066 —
Estimated gestational age 0.136 0.070
Weight gain 0.171 0.035
Group (GDM) 0.187 0.016 .0001
Percent Body Fat*
Pregravid BMI 0.072 —
Estimated gestational age 0.116 0.044
Weight gain 0.147 0.031
Group (GDM) 0.166 0.019 .0001
*Pregravid maternal obesity has the strongest correlation with
neonatal measures of fat mass/% body fat in contrast to lean body
mass.
BMI, body mass index; GDM, gestational diabetes mellitus.
Adapted from Catalano PM, Ehrenberg HM: The short and long term
implications of maternal obesity on the mother and her offspring.
BJOG 113:1126-1133, 2006.
Assisted, DM
Unassisted, DM
Assisted, no DM
Unassisted, no DM
3750–4000
3500–3750
4250–4500
Birth weight (grams)
0
50
100
150
200
250
Shoulderdystociaincidenceper1000
300
350
400
4000–4250
4750–5000
4500–4750
FIGURE 46-10 Risk of shoulder dystocia by diabetes status and
instrumental delivery. Shoulder dystocia occurred more often in
diabetic deliveries requiring operative vaginal assistance and in
fetuses above the 90th percentile of birth weight for age. DM,
diabetes mellitus. (From Nesbitt TS, Gilbert WM, Herrchen B:
Shoulder dystocia and associated risk factors with macrosomic
infants born in California. Am J Obstet Gynecol 179:476, 1998.)
967CHAPTER 46 Diabetes in Pregnancy
tocia rises 10-fold to 5% to 7% among infants weighing 4000 g or
more. However, if maternal diabetes is present, the risk at each birth-
weight class is increased fivefold.141
These risks are further magnified
if a forceps or vacuum delivery is performed.142
The level of glycemic control is strongly correlated with the risk of
shoulder dystocia and birth injury, presumably because increasing
levels of hyperglycemia are associated with greater fetal fat deposition.
Athukorola and colleagues140
reported a positive correlation between
the severity of maternal fasting hyperglycemia and the risk of shoulder
dystocia, with each 1-mmol increase in the fasting value in the OGTT
associated with an increasing relative risk of 2.09 (CI, 1.03 to 4.25).
Although it would be desirable to predict shoulder dystocia on
the basis of warning signs during labor such as labor protraction, a
suspected macrosomic infant, or the need for midpelvic forceps
delivery, less than 30% of these events can be predicted from clinical
factors.143
Neonatal Morbidity and Mortality
Polycythemia and Hyperviscosity
Polycythemia (i.e., central venous hemoglobin concentration >20 g/dL
or hematocrit >65%) occurs in 5% to 10% of IDMs and is apparently
related to glycemic control. Hyperglycemia is a powerful stimulus for
fetal erythropoietin production, which is probably mediated by
decreased fetal oxygen tension.144
Untreated, neonatal polycythemia
may promote vascular sludging, ischemia, and infarction of vital
tissues, including the kidneys and central nervous system.
Neonatal Hypoglycemia
Approximately 15% to 25% of neonates delivered from women with
diabetes during gestation develop hypoglycemia during the immediate
newborn period.145
Neonatal hypoglycemia is less common when tight
glycemic control is maintained during pregnancy146
and in labor.
A detailed study by Taylor and associates147
found no correlation
between the likelihood of neonatal hypoglycemia and Hb A1c, whereas
mean maternal glucose levels during labor were strongly predictive.
Because unrecognized postnatal hypoglycemia may lead to neonatal
seizures, coma, and brain damage, it is imperative that the neonatal
team caring for the neonate follow a protocol of frequent postnatal
glucose monitoring until metabolic stability is ensured.
Neonatal Hypocalcemia and Hyperbilirubinemia
Low levels of serum calcium (<7 mg/100 mL) have been reported in
up to 50% of IDMs during the first 3 days of life, although later series
record an incidence of 5% or less with better-managed pregnancies.148
Neonatal hyperbilirubinemia occurs in approximately 25% of IDMs,
a rate approximately double that for normal infants, with prematurity
and polycythemia being the primary contributing factors. Close moni-
toring of the newborn of diabetic pregnancy is necessary to avoid the
further morbidity of kernicterus, seizures, and neurologic damage.
Hypertrophic and Congestive Cardiomyopathy
In some macrosomic, plethoric infants of mothers with poorly con-
trolled diabetes, a thickened myocardium and significant asymmetrical
septal hypertrophy has been described.149
The prevalence of clinical
and subclinical asymmetrical septal hypertrophy in IDMs has been
estimated to be as high as 30% at birth, with resolution by 1 year of
age.150
Kjos and colleagues151
found that cardiac dysfunction associated
with this entity often leads to respiratory distress, which may be mis-
taken for hyaline membrane disease.
IDMs who manifest cardiac dysfunction in the neonatal period
may have congestive or hypertrophic cardiomyopathy. This condition
is often asymptomatic and unrecognized. Echocardiograms show a
hypercontractile, thickened myocardium, often with septal hypertro-
phy disproportionate to the ventricular free walls.152
The ventricular
chambers are often smaller than normal, and there may be anterior
systolic motion of the mitral valve, producing left ventricular outflow
tract obstruction.
Neonatal septal hypertrophy may be a response to chronic hyper-
glycemia. The maternal level of IGF-1, which is elevated in subopti-
mallycontrolleddiabeticpregnancy,issignificantlyelevatedinneonates
with asymmetrical septal hypertrophy. Because IGF-1 does not cross
the placenta, it may exert its action through binding to the IGF-1
receptor on the placenta.153
Halse and coworkers154
found that the level
of B-type natriuretic protein (BNP), a marker for congestive cardiac
failure, is elevated in neonates whose mothers had poor glycemic
control during the third trimester.
Septal hypertrophy can be identified with sonography in the pre-
natal period. Cooper and coworkers155
performed serial fetal echocar-
diography on 61 pregnant, diabetic women, demonstrating excessive
ventricular septal thickness in the fetuses that were diagnosed postna-
tally with asymmetrical septal hypertrophy. When the newborns with
asymmetrical septal hypertrophy were compared with normal infants,
birth weights (4009 versus 3457 g; P < .01) and maternal glycosylated
hemoglobin levels (6.7% versus 5.7%) were higher in infants with
cardiomyopathy.
Respiratory Distress Syndrome
Until recently, respiratory distress syndrome was the most common
and most serious disease in IDMs. In the 1970s, improved prenatal
maternal management for diabetes and new techniques in obstetrics
for timing and mode of delivery resulted in a dramatic decline in its
incidence, from 31% to 3%.156
However, even when matched by gesta-
tional week of pregnancy, IDMs are more than 20 times as likely as
infants from normal pregnancies to develop respiratory distress
syndrome.157
The increased susceptibility to respiratory distress may result from
altered production of alveolar surfactant or abnormal pulmonary
function. Kulovich and Gluck158
reported delayed timing of phospho-
lipid production in diabetic pregnancy, as indicated by a delay in the
appearance of phosphatidylglycerol in the amniotic fluid. In their
study, maturational delay occurred only in gestational diabetes (White
class A patients); fetuses of women with other forms of diabetes showed
normal or accelerated maturation of pulmonary phospholipid profiles.
Although some investigators have failed to demonstrate a delay in
lung maturation in diabetic pregnancy,159,160
most reports in the litera-
ture indicate a significant biochemical and physiologic delay in IDMs.
Tyden and colleagues161
and Landon and coworkers162
reported that
fetal lung maturity occurred later in pregnancies with poor glycemic
control (mean plasma glucose level >110 mg/dL), regardless of class of
diabetes, when the infants were stratified by maternal plasma glucose
levels. These findings were confirmed by Moore,163
who demonstrated
no differences in the rate of rise of the amniotic fluid lecithin-to-
sphingomyelin ratio among types of diabetes or degree of glucose
control but found that amniotic fluid phosphatidylglycerol was delayed
approximately 1.5 weeks in women with pregestational or GDM dia-
betes compared with controls (Fig. 46-11). The delay in phosphatidyl-
glycerol was associated with an earlier and higher peak in the level of
phosphatidyl inositol, suggesting that elevated maternal plasma levels
of myoinositol in diabetic women may inhibit or delay the production
of phosphatidylglycerol in the fetus.
968 CHAPTER 46 Diabetes in Pregnancy
It is possible that poor neonatal respiratory performance in the
IDM may have a histologic basis in addition to a biochemical
cause. Kjos and coauthors151
identified respiratory distress in 3.4% of
infants delivered of diabetic women, but surfactant-deficient airway
disease accounted for less than one third of cases, with transient tachy-
pnea, hypertrophic cardiomyopathy, and pneumonia responsible for
most.
The near-term infant of a mother with poorly controlled diabetes
is more likely to have neonatal respiratory dysfunction than is the
infant of a nondiabetic mother. The observations of Moore163
indicate
that the average nondiabetic fetus achieves pulmonary maturity at 34
to 35 weeks’ gestation, with more than 99% of normal newborns
having a mature phospholipid profile by 37 weeks. In diabetic preg-
nancy, however, it cannot be assumed that lung maturity exists until
approximately 10 days after the nondiabetic time (38.5 gestational
weeks). Any delivery contemplated before 38.5 weeks’ gestation for
other than the most urgent fetal and maternal indications should be
preceded by documentation of pulmonary maturity by amniocentesis.
The neonatal complications of the offspring of diabetic pregnancy is
discussed further in Chapter 58.
Long-Term Risks for the Fetus of the
Obese Mother
Although much has been written about the increased risk of the meta-
bolic syndrome (i.e., obesity, hypertension, insulin resistance, and dys-
lipidemia) in infants born SGA, evidence points toward an increase in
adolescent and adult obesity in infants born LGA or macrosomic.
There has been abundant evidence linking higher birth weights to
increased obesity of adolescents and adults for at least 25 years.164
Large
cohort studies such as the Nurses Health Study165
and the Health Pro-
fessional Follow-up Study166
report a J-shaped curve (i.e., a slightly
greater BMI among subjects born small but a much greater prevalence
of overweight and obesity in those born large).167
The increased preva-
lence of adolescent obesity is related to an increased risk of the meta-
bolic syndrome. The increased incidence of obesity accounts for much
of the 33% increase in type 2 diabetes, particularly among the young.
Between 50% and 90% of adolescents with type 2 diabetes have a BMI
greater than 27,168
and 25% of obese children between 4 and 10 years
old have impaired glucose tolerance.169
The epidemic of obesity and
subsequent risk for diabetes and components of the metabolic syn-
drome may begin in utero with fetal overgrowth and adiposity, rather
than undergrowth.
A retrospective cohort study by Whitaker170
enrolling more than
8400 children in the United States in the early 1990s reported that
children who were born to obese mothers (based on BMI in the first
trimester) were twice as likely to be obese when they were 2 years old.
If a woman had a BMI of 30 or more in the first trimester, the preva-
lences of childhood obesity (BMI > 95th percentile based on criteria
of the Centers for Disease Control and Prevention [CDC]) at ages 2,
3, and 4 years were 15.1%, 20.6%, and 24.1%, respectively. This was
between 2.4 and 2.7 times the prevalence of obesity observed in
children of mothers whose BMI values were in the normal range (18.5
to 24.9). This effect was only slightly modified by birth weight.
There is an independent effect of maternal pregravid weight and
diabetes on birth weight and on the adolescent risk of obesity. Langer
and colleagues171
reported that in obese women with GDM whose
glucose was well controlled on diet alone, the odds of fetal macrosomia
(birth weight >4000 g) were significantly increased (OR = 2.12) com-
pared with women with well-controlled (diet only) GDM and normal
BMIs. Similar results were reported for women with GDM who were
poorly controlled with diet or with insulin. In well-controlled, insulin-
requiring women with GDM, there was no significant increased risk
of macrosomia with increasing pregravid BMI. Dabelea and associ-
ates172
reported that the mean adolescent BMI was 2.6 kg/m2
greater in
sibling offspring of diabetic pregnancies compared with the index
siblings born when the mothers previously had normal glucose toler-
ance. Both maternal pregravid obesity and the presence of maternal
diabetes may independently affect the risk of adolescent obesity in the
offspring.
This risk of developing the metabolic syndrome in adolescents was
addressed by Boney and colleagues173
in longitudinal cohort study of
AGA and LGA infants of women with normal glucose tolerance and
GDM. The metabolic syndrome was defined as the presence of two or
more of the following components: obesity, hypertension, glucose
intolerance, and dyslipidemia. Maternal obesity was defined as a pre-
gravid BMI higher than 27.3. Children who were LGA at birth had an
increased hazard ratio (HR) for metabolic syndrome (HR = 2.19; CI,
1.25 to 3.82; P = .01) by age 11 years, as did children of obese women
(HR = 1.81; CI, 1.03 to 3.19; P = .04). The presence of maternal GDM
was not independently significant, but the risk for developing meta-
bolic syndrome was significantly different between LGA and AGA off-
spring of GDM by age 11 years (RR = 3.6).
Childhood Neurologic Abnormalities
Several reports have suggested childhood neurodevelopmental abnor-
malities in offspring of diabetic mothers. Rizzo and colleagues174
com-
pared the offspring of 201 mothers with diabetes with 83 children of
normal mothers and correlated subsequent childhood obesity in the
offspring of diabetic mothers with internalizing behavior problems,
29
0
Cumulative%PGՆ3%
20
40
60
80
100
31 33 35
Gestational week at amniocentesis
37 39 41 43
Controls
Overt DM
GDM
FIGURE 46-11 Delay in fetal pulmonary phosphatidyl
glycerol. The delay in fetal pulmonary phosphatidyl glycerol was
associated with a sustained peak in phosphatidyl inositol in diabetic
pregnancy, suggesting that elevated maternal plasma levels of
myoinositol in a diabetic woman may inhibit or delay the production
of phosphatidyl glycerol in the fetus. DM, diabetes mellitus; GDM,
gestational diabetes mellitus; PG, phosphatidyl glycerol. (From Moore
TR: A comparison of amniotic fluid fetal pulmonary phospholipids in
normal and diabetic pregnancy. Am J Obstet Gynecol 186:641, 2002.)
969CHAPTER 46 Diabetes in Pregnancy
somatic complaints, anxiety or depression, and social problems. Ornoy
and associates175
assessed IQ scores on the Wechsler Intelligence Scale
for Children–Revised (WISC-R) and Bender tests of the children born
to diabetic mothers. No differences were found between the study
groups in various sensorimotor functions compared with controls, but
the children of diabetic mothers performed less well than controls in
fine and gross motor functions, and they scored lower on the Pollack
taper test, which is designed to detect inattention and hyperactivity.
These investigators also found a negative correlation between the
severity of maternal hyperglycemia, as assessed by glycosylated hemo-
globin levels in the third trimester, and performance on neurodevel-
opmental and behavioral tests.
Preconceptional
Management of Women with
Pregestational Diabetes
Although widely underused,176
preconceptional care programs have
consistently been associated with decreased morbidity and mortality.177
Patients enrolled in preconceptional diabetes-management programs
obtain earlier prenatal care and have lower Hb A1c values in the first
trimester.178
A comparison of outcomes among women participating
in a intensive preconceptional program with outcomes among women
receiving standard care demonstrated lower perinatal mortality (0%
versus 7%) and reduced congenital anomalies (2% versus 14%). When
the preconceptional program was discontinued because of a lack of
funds, the congenital anomaly rate increased by more than 50%.7
Risk Assessment
Several factors should be considered in preconceptional diabetes risk
assessment (Table 46-9):
᭿ Glycemic control should be assessed directly from glucose logs
and by glycosylated hemoglobin levels.
᭿ For patients who have had diabetes for 10 years or longer, an
electrocardiogram, an echocardiogram, and microalbuminuria
and serum creatinine studies should be performed.
᭿ Because retinopathy can progress during pregnancy, the patient
should establish a relationship with a qualified ophthalmologic
provider. A baseline retinal evaluation should be completed
within the year before conception, with laser photocoagulation
performed if needed. Previous laser treatment is not a
contraindication to pregnancy and may avoid significant
hemorrhage during pregnancy.
᭿ Thyroid function (i.e., thyroid-stimulating hormone and free
thyroxine) should be evaluated and corrected as necessary in
all patients with pregestational diabetes because of the frequent
coincidence of autoimmune thyroid disease and diabetes.
᭿ A daily prenatal vitamin that provides 1 mg of folic acid should
be prescribed for a minimum of 3 months before conception,
because folate supplementation significantly reduces the risk of
congenital neural tube defects.
᭿ The patient’s occupational, financial, and personal situation
should be reviewed, because job and family pressures can
become barriers to achieving and maintaining excellent
glycemic control. In patients with pre-pregnancy hypertension
or proteinuria, particular emphasis should be given to defining
support systems that permit extended bed rest in the third
trimester, if it becomes necessary.
᭿ The patient’s preconception medications should be reviewed
and altered to avoid teratogenicity and potential embryonic
toxicity. Statins are pregnancy category X drugs and should
be discontinued before conception. Angiotensin-converting
enzyme (ACE) inhibitors and angiotensin receptor blockers
(ARBs) should be discontinued before conception because of
first trimester teratogenicity and fetal renal toxicity in the
second half of pregnancy. Among oral antidiabetic agents used
by reproductive-aged women, metformin and acarbose are
classified as pregnancy category B drugs, although systematic
data on safety are lacking. All other agents are category C
drugs, and unless the potential risks and benefits of oral
antidiabetic agents in the preconception period have been
TABLE 46-9 PRECONCEPTIONAL EVALUATION OF THE DIABETIC PATIENT
Procedure Tests Recommendations
Medical history, family history, review of
symptoms
Selected patients: fasting and postprandial
C-peptide determinations to clarify type
of diabetes
Avoid pregnancy until Hb A1c value is in the
normal, nonpregnant range
Physical examination findings
Hypertension ECG, cardiac, renal evaluation Antihypertensive medications
Retinopathy Retinal evaluation Ophthalmology consultation
Goiter T4, thyroid-stimulating hormones, antibodies
Neuropathy Vascular, podiatric evaluations
Obesity Exercise, weight loss
Proteinuria 24-hr urine for protein, creatinine Nephrology consultation if renal function
abnormal
Diabetes assessment Hb A1c
Glycemic control Home glucose monitoring
Stable glycemic profile
Nutrition Dietitian consultation
Occupational and family life assessment Help prepare patient for lifestyle commitments
necessary for tight glycemic control
ECG, electrocardiogram; Hb, hemoglobin; T4, thyroxine.
4 u1.0-b978-1-4160-4224-2..50049-1..docpdf

Weitere ähnliche Inhalte

Was ist angesagt?

Was ist angesagt? (20)

Diabetes Mellitus Kf
Diabetes Mellitus KfDiabetes Mellitus Kf
Diabetes Mellitus Kf
 
Diabetes project done
Diabetes project doneDiabetes project done
Diabetes project done
 
Diabetes mellitus edit 3
Diabetes mellitus edit 3Diabetes mellitus edit 3
Diabetes mellitus edit 3
 
Malnutrition
MalnutritionMalnutrition
Malnutrition
 
Child Malnutrition in the Developing World
Child Malnutrition in the Developing WorldChild Malnutrition in the Developing World
Child Malnutrition in the Developing World
 
Malnutrition
MalnutritionMalnutrition
Malnutrition
 
Enf celiaca
Enf celiacaEnf celiaca
Enf celiaca
 
Malnutrition
MalnutritionMalnutrition
Malnutrition
 
Immediate and underlying causes of malnutrition
Immediate and underlying causes of malnutritionImmediate and underlying causes of malnutrition
Immediate and underlying causes of malnutrition
 
Diabetes In America
Diabetes In AmericaDiabetes In America
Diabetes In America
 
Malnutrition
MalnutritionMalnutrition
Malnutrition
 
Type 1 Diabetes
Type 1 DiabetesType 1 Diabetes
Type 1 Diabetes
 
Malnutrition
MalnutritionMalnutrition
Malnutrition
 
malnutrition
malnutritionmalnutrition
malnutrition
 
Malnutrition
MalnutritionMalnutrition
Malnutrition
 
Malnutrition
MalnutritionMalnutrition
Malnutrition
 
Malnutrition in adolescents and pregnant women
Malnutrition in adolescents and pregnant womenMalnutrition in adolescents and pregnant women
Malnutrition in adolescents and pregnant women
 
Epidemiology:Undernutrition
Epidemiology:UndernutritionEpidemiology:Undernutrition
Epidemiology:Undernutrition
 
Diabetes
DiabetesDiabetes
Diabetes
 
MALNUTRITION IN INDIA
MALNUTRITION IN INDIA MALNUTRITION IN INDIA
MALNUTRITION IN INDIA
 

Andere mochten auch

Teaching large multilevel classes
Teaching large multilevel classesTeaching large multilevel classes
Teaching large multilevel classesOlga Morozan
 
What is creative non fiction
What is creative non fictionWhat is creative non fiction
What is creative non fictionDebbie Gascoyne
 
Creative non fiction portfolio
Creative non fiction portfolioCreative non fiction portfolio
Creative non fiction portfolioDebbie Gascoyne
 
Writing creative non fiction
Writing creative non fictionWriting creative non fiction
Writing creative non fictionJimi Kayode
 
What is creative nonfiction
What is creative nonfictionWhat is creative nonfiction
What is creative nonfictionewolterb
 

Andere mochten auch (6)

Teaching large multilevel classes
Teaching large multilevel classesTeaching large multilevel classes
Teaching large multilevel classes
 
What is creative non fiction
What is creative non fictionWhat is creative non fiction
What is creative non fiction
 
Creative non fiction portfolio
Creative non fiction portfolioCreative non fiction portfolio
Creative non fiction portfolio
 
Writing creative non fiction
Writing creative non fictionWriting creative non fiction
Writing creative non fiction
 
What is creative nonfiction
What is creative nonfictionWhat is creative nonfiction
What is creative nonfiction
 
Creative Non-fiction
Creative Non-fictionCreative Non-fiction
Creative Non-fiction
 

Ähnlich wie 4 u1.0-b978-1-4160-4224-2..50049-1..docpdf

Idf course module 1 introduction to diabetes
Idf course module 1 introduction to diabetesIdf course module 1 introduction to diabetes
Idf course module 1 introduction to diabetesDiabetes for all
 
17Barbara Fletcher, RN, MN, FAANClinical Associate Profe.docx
17Barbara Fletcher, RN, MN, FAANClinical Associate Profe.docx17Barbara Fletcher, RN, MN, FAANClinical Associate Profe.docx
17Barbara Fletcher, RN, MN, FAANClinical Associate Profe.docxRAJU852744
 
17Barbara Fletcher, RN, MN, FAANClinical Associate Profe.docx
17Barbara Fletcher, RN, MN, FAANClinical Associate Profe.docx17Barbara Fletcher, RN, MN, FAANClinical Associate Profe.docx
17Barbara Fletcher, RN, MN, FAANClinical Associate Profe.docxaulasnilda
 
Diabetes_MellituS.ppt
Diabetes_MellituS.pptDiabetes_MellituS.ppt
Diabetes_MellituS.pptDrNasir7
 
A Case Study On A 52-Year-Old Female Patient Diagnosed With Type II Diabetes ...
A Case Study On A 52-Year-Old Female Patient Diagnosed With Type II Diabetes ...A Case Study On A 52-Year-Old Female Patient Diagnosed With Type II Diabetes ...
A Case Study On A 52-Year-Old Female Patient Diagnosed With Type II Diabetes ...Richard Hogue
 
Diabetes Type 1 Sara MartinezChamberlain College of Nursing.docx
Diabetes Type 1 Sara MartinezChamberlain College of Nursing.docxDiabetes Type 1 Sara MartinezChamberlain College of Nursing.docx
Diabetes Type 1 Sara MartinezChamberlain College of Nursing.docxlynettearnold46882
 
Diabetes Mellitus
Diabetes MellitusDiabetes Mellitus
Diabetes MellitusDrManuSS
 
Diabetes Mellitus Types Diet Maintenance and Exercise
Diabetes Mellitus Types  Diet Maintenance and ExerciseDiabetes Mellitus Types  Diet Maintenance and Exercise
Diabetes Mellitus Types Diet Maintenance and Exerciseshama shabbir
 

Ähnlich wie 4 u1.0-b978-1-4160-4224-2..50049-1..docpdf (20)

Idf course module 1 introduction to diabetes
Idf course module 1 introduction to diabetesIdf course module 1 introduction to diabetes
Idf course module 1 introduction to diabetes
 
17Barbara Fletcher, RN, MN, FAANClinical Associate Profe.docx
17Barbara Fletcher, RN, MN, FAANClinical Associate Profe.docx17Barbara Fletcher, RN, MN, FAANClinical Associate Profe.docx
17Barbara Fletcher, RN, MN, FAANClinical Associate Profe.docx
 
17Barbara Fletcher, RN, MN, FAANClinical Associate Profe.docx
17Barbara Fletcher, RN, MN, FAANClinical Associate Profe.docx17Barbara Fletcher, RN, MN, FAANClinical Associate Profe.docx
17Barbara Fletcher, RN, MN, FAANClinical Associate Profe.docx
 
-2.pptx
-2.pptx-2.pptx
-2.pptx
 
Diabetes Mellitus
Diabetes MellitusDiabetes Mellitus
Diabetes Mellitus
 
Diabetes Mellitus
Diabetes MellitusDiabetes Mellitus
Diabetes Mellitus
 
Diabetes_MellituS.ppt
Diabetes_MellituS.pptDiabetes_MellituS.ppt
Diabetes_MellituS.ppt
 
Diabetes Mellitus.ppt
Diabetes Mellitus.pptDiabetes Mellitus.ppt
Diabetes Mellitus.ppt
 
A Case Study On A 52-Year-Old Female Patient Diagnosed With Type II Diabetes ...
A Case Study On A 52-Year-Old Female Patient Diagnosed With Type II Diabetes ...A Case Study On A 52-Year-Old Female Patient Diagnosed With Type II Diabetes ...
A Case Study On A 52-Year-Old Female Patient Diagnosed With Type II Diabetes ...
 
G0212832
G0212832G0212832
G0212832
 
Diabetes Type 1 Sara MartinezChamberlain College of Nursing.docx
Diabetes Type 1 Sara MartinezChamberlain College of Nursing.docxDiabetes Type 1 Sara MartinezChamberlain College of Nursing.docx
Diabetes Type 1 Sara MartinezChamberlain College of Nursing.docx
 
Diabetes case-study
Diabetes case-studyDiabetes case-study
Diabetes case-study
 
Diabetes mellitus
Diabetes mellitusDiabetes mellitus
Diabetes mellitus
 
36831.ppt
36831.ppt36831.ppt
36831.ppt
 
Diabetes Mellitus
Diabetes MellitusDiabetes Mellitus
Diabetes Mellitus
 
Diabetis ppt
Diabetis pptDiabetis ppt
Diabetis ppt
 
Presentation1
Presentation1Presentation1
Presentation1
 
36831
3683136831
36831
 
Diabetes notes by BISWANATH PRUSTY
Diabetes notes by BISWANATH PRUSTYDiabetes notes by BISWANATH PRUSTY
Diabetes notes by BISWANATH PRUSTY
 
Diabetes Mellitus Types Diet Maintenance and Exercise
Diabetes Mellitus Types  Diet Maintenance and ExerciseDiabetes Mellitus Types  Diet Maintenance and Exercise
Diabetes Mellitus Types Diet Maintenance and Exercise
 

Mehr von Loveis1able Khumpuangdee (20)

Rollup01
Rollup01Rollup01
Rollup01
 
Protec
ProtecProtec
Protec
 
Factsheet hfm
Factsheet hfmFactsheet hfm
Factsheet hfm
 
Factsheet
FactsheetFactsheet
Factsheet
 
Eidnotebook54
Eidnotebook54Eidnotebook54
Eidnotebook54
 
Data l3 148
Data l3 148Data l3 148
Data l3 148
 
Data l3 147
Data l3 147Data l3 147
Data l3 147
 
Data l3 127
Data l3 127Data l3 127
Data l3 127
 
Data l3 126
Data l3 126Data l3 126
Data l3 126
 
Data l3 113
Data l3 113Data l3 113
Data l3 113
 
Data l3 112
Data l3 112Data l3 112
Data l3 112
 
Data l3 92
Data l3 92Data l3 92
Data l3 92
 
Data l3 89
Data l3 89Data l3 89
Data l3 89
 
Data l2 80
Data l2 80Data l2 80
Data l2 80
 
Hfm reccomment10072555
Hfm reccomment10072555Hfm reccomment10072555
Hfm reccomment10072555
 
Hfm work2550
Hfm work2550Hfm work2550
Hfm work2550
 
Factsheet hfm
Factsheet hfmFactsheet hfm
Factsheet hfm
 
Publichealth
PublichealthPublichealth
Publichealth
 
แนวทางการดาเน ํ นงานป ิ องก ้ นควบค ั มการระบาดของโรคม ุ ือ เท้า ปาก สําหรบแพ...
แนวทางการดาเน ํ นงานป ิ องก ้ นควบค ั มการระบาดของโรคม ุ ือ เท้า ปาก สําหรบแพ...แนวทางการดาเน ํ นงานป ิ องก ้ นควบค ั มการระบาดของโรคม ุ ือ เท้า ปาก สําหรบแพ...
แนวทางการดาเน ํ นงานป ิ องก ้ นควบค ั มการระบาดของโรคม ุ ือ เท้า ปาก สําหรบแพ...
 
hand foot mouth
hand foot mouthhand foot mouth
hand foot mouth
 

Kürzlich hochgeladen

Premium Call Girls Cottonpet Whatsapp 7001035870 Independent Escort Service
Premium Call Girls Cottonpet Whatsapp 7001035870 Independent Escort ServicePremium Call Girls Cottonpet Whatsapp 7001035870 Independent Escort Service
Premium Call Girls Cottonpet Whatsapp 7001035870 Independent Escort Servicevidya singh
 
Call Girls Tirupati Just Call 9907093804 Top Class Call Girl Service Available
Call Girls Tirupati Just Call 9907093804 Top Class Call Girl Service AvailableCall Girls Tirupati Just Call 9907093804 Top Class Call Girl Service Available
Call Girls Tirupati Just Call 9907093804 Top Class Call Girl Service AvailableDipal Arora
 
VIP Service Call Girls Sindhi Colony 📳 7877925207 For 18+ VIP Call Girl At Th...
VIP Service Call Girls Sindhi Colony 📳 7877925207 For 18+ VIP Call Girl At Th...VIP Service Call Girls Sindhi Colony 📳 7877925207 For 18+ VIP Call Girl At Th...
VIP Service Call Girls Sindhi Colony 📳 7877925207 For 18+ VIP Call Girl At Th...jageshsingh5554
 
Call Girls Kochi Just Call 9907093804 Top Class Call Girl Service Available
Call Girls Kochi Just Call 9907093804 Top Class Call Girl Service AvailableCall Girls Kochi Just Call 9907093804 Top Class Call Girl Service Available
Call Girls Kochi Just Call 9907093804 Top Class Call Girl Service AvailableDipal Arora
 
(Rocky) Jaipur Call Girl - 09521753030 Escorts Service 50% Off with Cash ON D...
(Rocky) Jaipur Call Girl - 09521753030 Escorts Service 50% Off with Cash ON D...(Rocky) Jaipur Call Girl - 09521753030 Escorts Service 50% Off with Cash ON D...
(Rocky) Jaipur Call Girl - 09521753030 Escorts Service 50% Off with Cash ON D...indiancallgirl4rent
 
All Time Service Available Call Girls Marine Drive 📳 9820252231 For 18+ VIP C...
All Time Service Available Call Girls Marine Drive 📳 9820252231 For 18+ VIP C...All Time Service Available Call Girls Marine Drive 📳 9820252231 For 18+ VIP C...
All Time Service Available Call Girls Marine Drive 📳 9820252231 For 18+ VIP C...Arohi Goyal
 
Call Girls Varanasi Just Call 9907093804 Top Class Call Girl Service Available
Call Girls Varanasi Just Call 9907093804 Top Class Call Girl Service AvailableCall Girls Varanasi Just Call 9907093804 Top Class Call Girl Service Available
Call Girls Varanasi Just Call 9907093804 Top Class Call Girl Service AvailableDipal Arora
 
Manyata Tech Park ( Call Girls ) Bangalore ✔ 6297143586 ✔ Hot Model With Sexy...
Manyata Tech Park ( Call Girls ) Bangalore ✔ 6297143586 ✔ Hot Model With Sexy...Manyata Tech Park ( Call Girls ) Bangalore ✔ 6297143586 ✔ Hot Model With Sexy...
Manyata Tech Park ( Call Girls ) Bangalore ✔ 6297143586 ✔ Hot Model With Sexy...vidya singh
 
Call Girls Ooty Just Call 9907093804 Top Class Call Girl Service Available
Call Girls Ooty Just Call 9907093804 Top Class Call Girl Service AvailableCall Girls Ooty Just Call 9907093804 Top Class Call Girl Service Available
Call Girls Ooty Just Call 9907093804 Top Class Call Girl Service AvailableDipal Arora
 
Call Girls Coimbatore Just Call 9907093804 Top Class Call Girl Service Available
Call Girls Coimbatore Just Call 9907093804 Top Class Call Girl Service AvailableCall Girls Coimbatore Just Call 9907093804 Top Class Call Girl Service Available
Call Girls Coimbatore Just Call 9907093804 Top Class Call Girl Service AvailableDipal Arora
 
Call Girls Jabalpur Just Call 9907093804 Top Class Call Girl Service Available
Call Girls Jabalpur Just Call 9907093804 Top Class Call Girl Service AvailableCall Girls Jabalpur Just Call 9907093804 Top Class Call Girl Service Available
Call Girls Jabalpur Just Call 9907093804 Top Class Call Girl Service AvailableDipal Arora
 
Call Girls Service Jaipur Grishma WhatsApp ❤8445551418 VIP Call Girls Jaipur
Call Girls Service Jaipur Grishma WhatsApp ❤8445551418 VIP Call Girls JaipurCall Girls Service Jaipur Grishma WhatsApp ❤8445551418 VIP Call Girls Jaipur
Call Girls Service Jaipur Grishma WhatsApp ❤8445551418 VIP Call Girls Jaipurparulsinha
 
♛VVIP Hyderabad Call Girls Chintalkunta🖕7001035870🖕Riya Kappor Top Call Girl ...
♛VVIP Hyderabad Call Girls Chintalkunta🖕7001035870🖕Riya Kappor Top Call Girl ...♛VVIP Hyderabad Call Girls Chintalkunta🖕7001035870🖕Riya Kappor Top Call Girl ...
♛VVIP Hyderabad Call Girls Chintalkunta🖕7001035870🖕Riya Kappor Top Call Girl ...astropune
 
Call Girls Siliguri Just Call 9907093804 Top Class Call Girl Service Available
Call Girls Siliguri Just Call 9907093804 Top Class Call Girl Service AvailableCall Girls Siliguri Just Call 9907093804 Top Class Call Girl Service Available
Call Girls Siliguri Just Call 9907093804 Top Class Call Girl Service AvailableDipal Arora
 
Top Rated Bangalore Call Girls Richmond Circle ⟟ 8250192130 ⟟ Call Me For Gen...
Top Rated Bangalore Call Girls Richmond Circle ⟟ 8250192130 ⟟ Call Me For Gen...Top Rated Bangalore Call Girls Richmond Circle ⟟ 8250192130 ⟟ Call Me For Gen...
Top Rated Bangalore Call Girls Richmond Circle ⟟ 8250192130 ⟟ Call Me For Gen...narwatsonia7
 
Book Paid Powai Call Girls Mumbai 𖠋 9930245274 𖠋Low Budget Full Independent H...
Book Paid Powai Call Girls Mumbai 𖠋 9930245274 𖠋Low Budget Full Independent H...Book Paid Powai Call Girls Mumbai 𖠋 9930245274 𖠋Low Budget Full Independent H...
Book Paid Powai Call Girls Mumbai 𖠋 9930245274 𖠋Low Budget Full Independent H...Call Girls in Nagpur High Profile
 
Night 7k to 12k Chennai City Center Call Girls 👉👉 7427069034⭐⭐ 100% Genuine E...
Night 7k to 12k Chennai City Center Call Girls 👉👉 7427069034⭐⭐ 100% Genuine E...Night 7k to 12k Chennai City Center Call Girls 👉👉 7427069034⭐⭐ 100% Genuine E...
Night 7k to 12k Chennai City Center Call Girls 👉👉 7427069034⭐⭐ 100% Genuine E...hotbabesbook
 
Chandrapur Call girls 8617370543 Provides all area service COD available
Chandrapur Call girls 8617370543 Provides all area service COD availableChandrapur Call girls 8617370543 Provides all area service COD available
Chandrapur Call girls 8617370543 Provides all area service COD availableDipal Arora
 
The Most Attractive Hyderabad Call Girls Kothapet 𖠋 6297143586 𖠋 Will You Mis...
The Most Attractive Hyderabad Call Girls Kothapet 𖠋 6297143586 𖠋 Will You Mis...The Most Attractive Hyderabad Call Girls Kothapet 𖠋 6297143586 𖠋 Will You Mis...
The Most Attractive Hyderabad Call Girls Kothapet 𖠋 6297143586 𖠋 Will You Mis...chandars293
 
Top Rated Hyderabad Call Girls Erragadda ⟟ 6297143586 ⟟ Call Me For Genuine ...
Top Rated  Hyderabad Call Girls Erragadda ⟟ 6297143586 ⟟ Call Me For Genuine ...Top Rated  Hyderabad Call Girls Erragadda ⟟ 6297143586 ⟟ Call Me For Genuine ...
Top Rated Hyderabad Call Girls Erragadda ⟟ 6297143586 ⟟ Call Me For Genuine ...chandars293
 

Kürzlich hochgeladen (20)

Premium Call Girls Cottonpet Whatsapp 7001035870 Independent Escort Service
Premium Call Girls Cottonpet Whatsapp 7001035870 Independent Escort ServicePremium Call Girls Cottonpet Whatsapp 7001035870 Independent Escort Service
Premium Call Girls Cottonpet Whatsapp 7001035870 Independent Escort Service
 
Call Girls Tirupati Just Call 9907093804 Top Class Call Girl Service Available
Call Girls Tirupati Just Call 9907093804 Top Class Call Girl Service AvailableCall Girls Tirupati Just Call 9907093804 Top Class Call Girl Service Available
Call Girls Tirupati Just Call 9907093804 Top Class Call Girl Service Available
 
VIP Service Call Girls Sindhi Colony 📳 7877925207 For 18+ VIP Call Girl At Th...
VIP Service Call Girls Sindhi Colony 📳 7877925207 For 18+ VIP Call Girl At Th...VIP Service Call Girls Sindhi Colony 📳 7877925207 For 18+ VIP Call Girl At Th...
VIP Service Call Girls Sindhi Colony 📳 7877925207 For 18+ VIP Call Girl At Th...
 
Call Girls Kochi Just Call 9907093804 Top Class Call Girl Service Available
Call Girls Kochi Just Call 9907093804 Top Class Call Girl Service AvailableCall Girls Kochi Just Call 9907093804 Top Class Call Girl Service Available
Call Girls Kochi Just Call 9907093804 Top Class Call Girl Service Available
 
(Rocky) Jaipur Call Girl - 09521753030 Escorts Service 50% Off with Cash ON D...
(Rocky) Jaipur Call Girl - 09521753030 Escorts Service 50% Off with Cash ON D...(Rocky) Jaipur Call Girl - 09521753030 Escorts Service 50% Off with Cash ON D...
(Rocky) Jaipur Call Girl - 09521753030 Escorts Service 50% Off with Cash ON D...
 
All Time Service Available Call Girls Marine Drive 📳 9820252231 For 18+ VIP C...
All Time Service Available Call Girls Marine Drive 📳 9820252231 For 18+ VIP C...All Time Service Available Call Girls Marine Drive 📳 9820252231 For 18+ VIP C...
All Time Service Available Call Girls Marine Drive 📳 9820252231 For 18+ VIP C...
 
Call Girls Varanasi Just Call 9907093804 Top Class Call Girl Service Available
Call Girls Varanasi Just Call 9907093804 Top Class Call Girl Service AvailableCall Girls Varanasi Just Call 9907093804 Top Class Call Girl Service Available
Call Girls Varanasi Just Call 9907093804 Top Class Call Girl Service Available
 
Manyata Tech Park ( Call Girls ) Bangalore ✔ 6297143586 ✔ Hot Model With Sexy...
Manyata Tech Park ( Call Girls ) Bangalore ✔ 6297143586 ✔ Hot Model With Sexy...Manyata Tech Park ( Call Girls ) Bangalore ✔ 6297143586 ✔ Hot Model With Sexy...
Manyata Tech Park ( Call Girls ) Bangalore ✔ 6297143586 ✔ Hot Model With Sexy...
 
Call Girls Ooty Just Call 9907093804 Top Class Call Girl Service Available
Call Girls Ooty Just Call 9907093804 Top Class Call Girl Service AvailableCall Girls Ooty Just Call 9907093804 Top Class Call Girl Service Available
Call Girls Ooty Just Call 9907093804 Top Class Call Girl Service Available
 
Call Girls Coimbatore Just Call 9907093804 Top Class Call Girl Service Available
Call Girls Coimbatore Just Call 9907093804 Top Class Call Girl Service AvailableCall Girls Coimbatore Just Call 9907093804 Top Class Call Girl Service Available
Call Girls Coimbatore Just Call 9907093804 Top Class Call Girl Service Available
 
Call Girls Jabalpur Just Call 9907093804 Top Class Call Girl Service Available
Call Girls Jabalpur Just Call 9907093804 Top Class Call Girl Service AvailableCall Girls Jabalpur Just Call 9907093804 Top Class Call Girl Service Available
Call Girls Jabalpur Just Call 9907093804 Top Class Call Girl Service Available
 
Call Girls Service Jaipur Grishma WhatsApp ❤8445551418 VIP Call Girls Jaipur
Call Girls Service Jaipur Grishma WhatsApp ❤8445551418 VIP Call Girls JaipurCall Girls Service Jaipur Grishma WhatsApp ❤8445551418 VIP Call Girls Jaipur
Call Girls Service Jaipur Grishma WhatsApp ❤8445551418 VIP Call Girls Jaipur
 
♛VVIP Hyderabad Call Girls Chintalkunta🖕7001035870🖕Riya Kappor Top Call Girl ...
♛VVIP Hyderabad Call Girls Chintalkunta🖕7001035870🖕Riya Kappor Top Call Girl ...♛VVIP Hyderabad Call Girls Chintalkunta🖕7001035870🖕Riya Kappor Top Call Girl ...
♛VVIP Hyderabad Call Girls Chintalkunta🖕7001035870🖕Riya Kappor Top Call Girl ...
 
Call Girls Siliguri Just Call 9907093804 Top Class Call Girl Service Available
Call Girls Siliguri Just Call 9907093804 Top Class Call Girl Service AvailableCall Girls Siliguri Just Call 9907093804 Top Class Call Girl Service Available
Call Girls Siliguri Just Call 9907093804 Top Class Call Girl Service Available
 
Top Rated Bangalore Call Girls Richmond Circle ⟟ 8250192130 ⟟ Call Me For Gen...
Top Rated Bangalore Call Girls Richmond Circle ⟟ 8250192130 ⟟ Call Me For Gen...Top Rated Bangalore Call Girls Richmond Circle ⟟ 8250192130 ⟟ Call Me For Gen...
Top Rated Bangalore Call Girls Richmond Circle ⟟ 8250192130 ⟟ Call Me For Gen...
 
Book Paid Powai Call Girls Mumbai 𖠋 9930245274 𖠋Low Budget Full Independent H...
Book Paid Powai Call Girls Mumbai 𖠋 9930245274 𖠋Low Budget Full Independent H...Book Paid Powai Call Girls Mumbai 𖠋 9930245274 𖠋Low Budget Full Independent H...
Book Paid Powai Call Girls Mumbai 𖠋 9930245274 𖠋Low Budget Full Independent H...
 
Night 7k to 12k Chennai City Center Call Girls 👉👉 7427069034⭐⭐ 100% Genuine E...
Night 7k to 12k Chennai City Center Call Girls 👉👉 7427069034⭐⭐ 100% Genuine E...Night 7k to 12k Chennai City Center Call Girls 👉👉 7427069034⭐⭐ 100% Genuine E...
Night 7k to 12k Chennai City Center Call Girls 👉👉 7427069034⭐⭐ 100% Genuine E...
 
Chandrapur Call girls 8617370543 Provides all area service COD available
Chandrapur Call girls 8617370543 Provides all area service COD availableChandrapur Call girls 8617370543 Provides all area service COD available
Chandrapur Call girls 8617370543 Provides all area service COD available
 
The Most Attractive Hyderabad Call Girls Kothapet 𖠋 6297143586 𖠋 Will You Mis...
The Most Attractive Hyderabad Call Girls Kothapet 𖠋 6297143586 𖠋 Will You Mis...The Most Attractive Hyderabad Call Girls Kothapet 𖠋 6297143586 𖠋 Will You Mis...
The Most Attractive Hyderabad Call Girls Kothapet 𖠋 6297143586 𖠋 Will You Mis...
 
Top Rated Hyderabad Call Girls Erragadda ⟟ 6297143586 ⟟ Call Me For Genuine ...
Top Rated  Hyderabad Call Girls Erragadda ⟟ 6297143586 ⟟ Call Me For Genuine ...Top Rated  Hyderabad Call Girls Erragadda ⟟ 6297143586 ⟟ Call Me For Genuine ...
Top Rated Hyderabad Call Girls Erragadda ⟟ 6297143586 ⟟ Call Me For Genuine ...
 

4 u1.0-b978-1-4160-4224-2..50049-1..docpdf

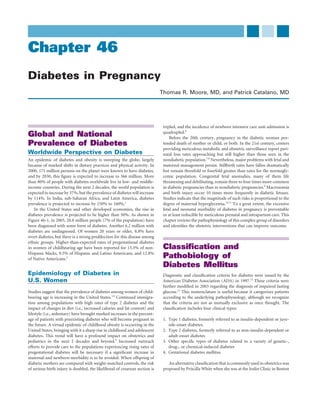
  • 1. Global and National Prevalence of Diabetes Worldwide Perspective on Diabetes An epidemic of diabetes and obesity is sweeping the globe, largely because of marked shifts in dietary practices and physical activity. In 2000, 171 million persons on the planet were known to have diabetes, and by 2030, this figure is expected to increase to 366 million. More than 80% of people with diabetes worldwide live in low- and middle- income countries. During the next 2 decades, the world population is expected to increase by 37%, but the prevalence of diabetes will increase by 114%. In India, sub-Saharan Africa, and Latin America, diabetes prevalence is projected to increase by 150% to 160%.1 In the United States and other developed economies, the rise in diabetes prevalence is projected to be higher than 50%. As shown in Figure 46-1, in 2005, 20.8 million people (7% of the population) have been diagnosed with some form of diabetes. Another 6.2 million with diabetes are undiagnosed. Of women 20 years or older, 8.8% have overt diabetes, but there is a strong predilection for this disease among ethnic groups. Higher-than-expected rates of pregestational diabetes in women of childbearing age have been reported for 13.3% of non- Hispanic blacks, 9.5% of Hispanic and Latino Americans, and 12.8% of Native Americans.2 Epidemiology of Diabetes in U.S. Women Studies suggest that the prevalence of diabetes among women of child- bearing age is increasing in the United States.3,4 Continued immigra- tion among populations with high rates of type 2 diabetes and the impact of changes in diet (i.e., increased calories and fat content) and lifestyle (i.e., sedentary) have brought marked increases in the percent- age of patients with preexisting diabetes who will become pregnant in the future. A virtual epidemic of childhood obesity is occurring in the United States, bringing with it a sharp rise in childhood and adolescent diabetes. This trend will have a profound impact on obstetrics and pediatrics in the next 2 decades and beyond.5 Increased outreach efforts to provide care to the populations experiencing rising rates of pregestational diabetes will be necessary if a significant increase in maternal and newborn morbidity is to be avoided. When offspring of diabetic mothers are compared with weight-matched controls, the risk of serious birth injury is doubled, the likelihood of cesarean section is tripled, and the incidence of newborn intensive care unit admission is quadrupled.6 Before the 20th century, pregnancy in the diabetic woman por- tended death of mother or child, or both. In the 21st century, centers providing meticulous metabolic and obstetric surveillance report peri- natal loss rates approaching but still higher than those seen in the nondiabetic population.7,8 Nevertheless, major problems with fetal and maternal management persist. Stillbirth rates have fallen dramatically but remain threefold or fourfold greater than rates for the normogly- cemic population. Congenital fetal anomalies, many of them life threatening and debilitating, remain three to four times more common in diabetic pregnancies than in nondiabetic pregnancies.9 Macrosomia and birth injury occur 10 times more frequently in diabetic fetuses. Studies indicate that the magnitude of such risks is proportional to the degree of maternal hyperglycemia.10,11 To a great extent, the excessive fetal and neonatal morbidity of diabetes in pregnancy is preventable or at least reducible by meticulous prenatal and intrapartum care. This chapter reviews the pathophysiology of this complex group of disorders and identifies the obstetric interventions that can improve outcome. Classification and Pathobiology of Diabetes Mellitus Diagnostic and classification criteria for diabetes were issued by the American Diabetes Association (ADA) in 1997.12 These criteria were further modified in 2003 regarding the diagnosis of impaired fasting glucose.13 This nomenclature is useful because it categorizes patients according to the underlying pathophysiology, although we recognize that the criteria are not as mutually exclusive as once thought. The classification includes four clinical types: 1. Type 1 diabetes, formerly referred to as insulin-dependent or juve- nile-onset diabetes. 2. Type 2 diabetes, formerly referred to as non–insulin-dependent or adult-onset diabetes 3. Other specific types of diabetes related to a variety of genetic-, drug-, or chemical-induced diabetes 4. Gestational diabetes mellitus An alternative classification that is commonly used in obstetrics was proposed by Priscilla White when she was at the Joslin Clinic in Boston Chapter 46 Diabetes in Pregnancy Thomas R. Moore, MD, and Patrick Catalano, MD
  • 2. 954 CHAPTER 46 Diabetes in Pregnancy in 1932.14 This classification (Table 46-1) was based on the duration of the disease and secondary vascular damage to retinal, renal, and car- diovascular structures. Because the White classification is primarily descriptive and because it does not reflect the increase in type 2 dia- betes in the population and the discovery of better-defined genetic causes, the ADA classification is preferred. The pathophysiology of the various types of diabetes is discussed subsequently. Type 1 Diabetes Type 1 diabetes accounts for approximately 5% to 10% of patients diagnosed with diabetes in the general population. However, type 1 diabetes may represent a slightly greater fraction of women in the reproductive age group because of the relatively earlier age of onset of type 1 diabetes compared with type 2 diabetes. Type 1 diabetes results from a cellular-mediated autoimmune destruction of the beta cells of the pancreas. Markers of the immune response include islet cell auto- antibodies, autoantibodies to insulin, autoantibodies to glutamic acid decarboxylase (GAD2, formerly designated GAD65), and autoanti- bodies to the tyrosine phosphatase IA-2 and IA-2β. One and usually more of these autoantibodies are present in 85% to 90% of individuals with elevated fasting glucose and type 1 diabetes.15 Autoimmune destruction of beta cells has many genetic predisposi- tions and is related to environmental factors. Although viruses were initially implicated, the environmental conditions leading to auto destruction of the beta cells remain largely undefined. Most evidence indicates a genetic predisposition related to an individual’s human leukocyte antigen (HLA) associations with linkage to DQA and DQB genes. Type 1 diabetes is concordant in 33% to 50% of monozygotic twins, suggesting that environmental triggers are required to initiate the disease process in genetically predisposed individuals. Type 1 diabetes usually is characterized by an abrupt clinical onset after a period of immune destruction of the beta cells that might have been in progress for some time. The beta cell destruction continues after the clinical onset of diabetes, usually leading to an absolute insulinopenia with resultant life-long requirements for insulin replacement. Although type 1 diabetes was previously referred to as juvenile-onset diabetes, it can occur at virtually any age. The disease is particularly common in whites, especially those of Northern European ancestry, and Sardinians. Type 2 Diabetes Type 2 diabetes involves a loss of balance between insulin sensitivity and insulin (i.e., beta cell) response. The relationship between these two factors can be expressed as the disposition index (i.e., the normal inverse relationship between the two factors can be expressed as a constant).16 A decline in the disposition index is associated with the development of type 2 diabetes. Both insulin resistance and beta cell dysfunction exist in individuals who develop type 2 diabetes. There is little agreement about whether the beta cell function is an independent event or is coincident with decreased insulin sensitivity and whether the abnormalities are causally linked. The decreased insulin sensitivity and inadequate insulin response leads to an increase in circulating glucose concentrations, and the decreased insulin sensitivity in individuals with type 2 diabetes results in the inability of insulin to suppress lipolysis in adipose tissue. Many predisposing factors are related to decreased insulin sensitivity (i.e., increased insulin resistance). They include obesity, a sedentary lifestyle, family history and genetics, puberty, advancing age, and of particular concern to the obstetrician, the intrauterine environment. Although it Estimated Age-Adjusted Total Prevalence of Diabetes in People 20 Years or Older, by Race/Ethnicity—United States, 2005 Percent American Indians/ Alaska Natives Non-Hispanic blacks Hispanic/Latino Americans Non-Hispanic whites 0 2 4 6 8 10 12 14 16 18 20 FIGURE 46-1 Estimated prevalence of diabetes in the United States 2005. For American Indians/Alaska Natives, the estimate of total prevalence was calculated using the estimate of diagnosed diabetes from the 2003 outpatient database of the Indian Health Service and the estimate of undiagnosed diabetes from the 1999- 2002 National Health and Nutrition Examination Survey (NHANES). For the other groups, the 1999-2002 NHANES estimates of total prevalence (diagnosed and undiagnosed) were projected to the year 2005. (Printed with permission from http://diabetes.niddk.nih.gov/dm/ pubs/statistics/index.htm#age.) TABLE 46-1 THE WHITE CLASSIFICATION OF DIABETES IN PREGNANCY White Class Age at Onset (Years) Duration (Years) Complications A Any Any Diagnosed before pregnancy; no vascular disease B у20 or <10 No vascular disease C 10-19 or 10-19 No vascular disease D <10 or у20 Background retinopathy only or hypertension E Calcification of pelvic arteries (no longer used) F Nephropathy (>500 mg of proteinuria per day) H Arteriosclerotic heart disease R Proliferative retinopathy or vitreous hemorrhage T After renal transplantation Adapted from Hare JW, White P: Gestational diabetes and the White classification. Diabetes Care 3:394, 1980. Copyright © 1980 by the American Diabetes Association.
  • 3. 955CHAPTER 46 Diabetes in Pregnancy was formerly believed that type 2 diabetes was primarily a disorder of older individuals (accounting for its being called adult-onset diabetes), there has been a significant increase in the prevalence of type 2 diabetes since 1990. At the turn of the 21st century, an estimated 13.8 million people had a diagnosis of diabetes, 5 million people had undiagnosed diabetes, and 41 million people had prediabetes.17 Although it is not in the scope of this chapter to review the spec- trum of possible causes of type 2 diabetes, the increase in obesity in the general population is a contributing factor; it is estimated that approximately two thirds of the population in the United States are overweight or obese.18 Obesity, particularly central obesity, which is estimated by waist circumference, is a well-described risk factor. This increase in visceral obesity affects hepatic metabolic function and is a rich source of cytokines and inflammatory factors, which are recog- nized as contributing to increasing insulin resistance. Criteria for the diagnosis of diabetes in nonpregnant adults are shown in Table 46-2. Although the 75-g, 2-hour oral glucose tolerance test (OGTT) is the most sensitive and specific diagnostic test for type 2 diabetes, because of the ease of administration and reproducibility, the fasting glucose test is often used as a first-line diagnostic test,19 particularly in the nongravid population. Because the onset of type 2 diabetes is usually insidious, hyperglycemia not sufficient to make the diagnostic criteria for type 2 diabetes is often categorized as impaired fasting glucose (IFG) (100 mg/dL to 125 mg/dL) or, if the 75-g OGTT is employed, as impaired glucose tolerance (IGT) (2-hour glucose level of 140 mg/dL to 199 mg/dL). The IFG and IGT have been officially designated prediabetes, and prediabetic individuals are at high risk for the development of type 2 diabetes.19 Gestational Diabetes Mellitus Gestational diabetes mellitus (GDM) as defined by the Fourth Inter- national Workshop-Conference on Gestational Diabetes as “carbohy- drate intolerance of various degrees of severity, with onset or first recognition during pregnancy.”20 This definition does not preclude the possibility that glucose intolerance might have predated the pregnancy or that medications might be needed for optimal glucose control. The underlying pathophysiology of GDM in most instances is similar to that observed for type 2 diabetes: an inability to maintain an adequate insulin response because of the significant decreases in insulin sensitiv- ity with advancing gestation. About 2% to 13% of women diagnosed as having GDM have detectable antibodies directed against specific beta cell antigens.21,22 Some of these deficiencies are population depen- dent. Other patients diagnosed with GDM have genetic variants that have been identified as causes of diabetes in the general population, including autosomal dominant (discussed later) and maternal or mito- chondrial inheritance patterns.23,24 It is estimated that as many as 3% to 9% of the population of pregnant women will be diagnosed with GDM.15 This translates into approximately 135,000 cases of GDM per year in the United States alone. This is not surprising, because in many respects, GDM is the harbinger of type 2 diabetes for many women, based on the underlying pathophysiology of GDM and the increase in obesity in women of reproductive age. Similarly, there is an increase in the incidence of GDM in women immigrating to the United States, presumably because of changes in diet and lifestyle. Clinical recognition of GDM is impor- tant because therapy can reduce pregnancy complications and poten- tially reduce long-term sequelae in the offspring. Genetic and Other Causes of Diabetes The ADA’s fourth classification of diabetes includes specific types of diabetes attributed to “other causes.” These causes include genetic defects in insulin action, diseases of the exocrine pancreas (e.g., cystic fibrosis), and drug- or chemical-induced diabetes, such as in the treat- ment of human immunodeficiency virus (HIV) infection or after organ transplantation.19 One of the well-characterized genetic defects is often included under the heading of maturity-onset diabetes of the young (MODY) (i.e., the glucokinase [GK] mutation). In 1998, Hattersley and colleagues25 described the various phenotypic per- mutations associated with the mutations of the glucokinase gene. Glucokinase phosphorylates glucose to glucose-6 phosphate in the pancreas and liver. A heterozygous glucokinase mutation results in hyperglycemia, usually with a mildly elevated fasting glucose and abnormal OGTT result. This occurs because of a defect in the sensing of glucose by the beta cell, resulting in decreased insulin release, and to a lesser degree because of reduced hepatic glycogen synthesis. In pregnancy, it is estimated that 3% of women with GDM and an ele- vated fasting glucose level greater than 110 mg/dL have this mutation. If the heterozygous mutation is present in the fetus, then the altered glucose sensing by the fetal pancreas will result in a decrease in insulin secretion. In the fetus, insulin is a primary stimulus for growth, and any defect in fetal insulin secretion results in decreased fetal growth and possible growth restriction. Depending on whether the mother or fetus, or both, have a defect in the glucokinase gene, the phenotype of the infant can vary from intrauterine growth restriction (IUGR) through normal fetal growth and to macrosomia. Maternal-Fetal Metabolism in Normal and Diabetic Pregnancy There are significant changes in maternal metabolism in normal preg- nancy. These include changes in maternal nutrient metabolism (i.e., carbohydrate, lipid, and protein metabolism) and changes in factors such as energy expenditure. The overall goal of these maternal meta- bolic adaptations is to prepare the pregnant woman to meet the increased energy needs of the mother and growth of the fetus in the TABLE 46-2 CRITERIA FOR THE DIAGNOSIS OF DIABETES Symptoms of diabetes and a casual plasma glucose level м200 mg/dL (11.1 mmol/L). Casual is defined as any time of day without regard to time since the last meal. The classic symptoms of diabetes include polyuria, polydipsia, and unexplained weight loss. or Fasting plasma glucose level м126 mg/dL (7.0 mmol/L). Fasting is defined as no caloric intake for at least 8 hours. or Two-hour plasma glucose м200 mg/dL (11.1 mmol/L) during an oral glucose tolerance test. The test should be performed as described by the World Health Organization, using a glucose load containing the equivalent of 75-g anhydrous glucose dissolved in water. Adapted from American Diabetes Association: Clinical practice recommendations: Standards of medical care for diabetes—2007. Diabetes Care 30:S4-S41, 2007.
  • 4. 956 CHAPTER 46 Diabetes in Pregnancy latter third of pregnancy, when approximately 70% of fetal growth takes place.26 The alterations in maternal metabolism are relatively uniform during pregnancy unless there are major perturbations such as starvation conditions. The metabolic changes during pregnancy therefore take place on the background of a woman’s pregestational metabolic status. For example, if a woman is healthy and lean before conception, there is an increased need to store adipose tissue in early pregnancy to meet the increased energy demands of late gestation and to develop insulin resistance in late gestation to provide nutrients for the growing fetus. If a woman is obese before conception, there is little need to gain additional adipose tissue, but there is the requirement to provide nutrients for the fetus in late gestation. Normal Glucose-Tolerant Pregnancy Glucose homeostasis is primarily a balance between insulin resistance and insulin secretion. The alterations in insulin resistance affect endog- enous glucose production (primarily hepatic glucose metabolism) and peripheral glucose metabolism, which takes place in skeletal muscle. In the lean pregnant woman with normal glucose tolerance, there is a significant 30% increase in basal hepatic glucose production by the third trimester of pregnancy (Fig. 46-2). This is associated with a sig- nificant increase in basal or fasting insulin concentrations.27 The decrease in fasting glucose concentrations most likely is the result of increasing plasma volumes in early gestation and increased fetoplacen- tal use in late pregnancy. In the postprandial state, the increasing insulin concentrations enhance glucose uptake into skeletal muscle and adipose tissue, and they almost completely suppress hepatic glucose production. Although this is the case in lean women, obese women with normal glucose tolerance have a decreased ability for insulin to completely suppress hepatic glucose production in late preg- nancy.28 These data support the concept of decreased insulin sensitivity in late gestation that is more severe in obese women compared with non-obese counterparts. Peripheral insulin resistance is defined as the decreased ability of insulin to affect glucose uptake primarily in skeletal muscle and to a lesser degree in adipose tissue. Various methods are used to assess insulin sensitivity in vivo, including mathematical models of fasting glucose and insulin modeling (e.g., homeostasis model assessment [HOMA],29 OGTT30 ), the intravenous glucose tolerance test (i.e., Bergman minimal model),31 and what many consider to be the gold standard: the hyperinsulinemic-euglycemic clamp.32 Most of these measures have identified a significant 50% to 60% decrease in insulin sensitivity in late gestation.33 The changes in insulin sensitivity during gestation are a reflection of a woman’s pregravid insulin sensitivity status. Lean women usually have greater pregravid insulin sensitivity compared with overweight or obese women. These differences mani- fest before pregnancy, and when evaluated against the metabolic back- ground of pregnancy, the relationships are similar in late pregnancy, albeit reduced by approximately 50% to 60% (Fig. 46-3). The decreases in insulin sensitivity in late pregnancy are accompanied by an increase in insulin response. The increased insulin response to a glucose load increases approximately threefold compared with pregravid measures (Fig. 46-4). Diabetic Pregnancy Alterations in glucose metabolism in women with diabetes have been most extensively examined in women with GDM, although the altera- tions in glucose metabolism in women with type 2 diabetes are most likely very similar but with increased insulin resistance and further decompensation of beta cell function. In lean and obese women with GDM with mildly elevated fasting glucose levels, there is a similar increase in basal endogenous glucose production, as was observed in subjects with normal glucose tolerance, although fasting insulin con- centrations, particularly in late gestation, are greater than observed in normal glucose-tolerant women.28,34 However, during insulin infusion during euglycemic clamps, the ability of insulin to suppress endoge- nous glucose production is decreased (approximately 80% versus 95%) in GDM compared with a matched control group. There is also a sig- Pregravid 90 100 110 120 130 140 mg/min 150 160 170 180 190 Pϭ.0005 Early pregnancy Late pregnancy FIGURE 46-2 Alterations in glucose production. Longitudinal changes in total basal endogenous (primarily hepatic) glucose production (mean ± SD) from pregravid through early gestation (12 to 14 weeks) and late gestation (34 to 36 weeks). (Adapted from Catalano PM, Tyzbir ED, Wolfe RR, et al: Longitudinal changes in basal hepatic glucose production and suppression during insulin infusion in normal pregnant women. Am J Obstet Gynecol 167:913- 919, 1992.) Pregravid *Pϭ.0003 Pϭ.04 Pϭ.005 Glucoseinfusionrate(mg/kg.min) 2 4 6 8 10 12 14 Early pregnancy Late pregnancy FIGURE 46-3 Alterations in insulin resistance. Longitudinal changes in glucose infusion rate (i.e., insulin sensitivity) in lean women from pregravid through early (12 to 14 weeks) and late (34 to 36 weeks) pregnancy during hyperinsulinemic-euglycemic clamp (mean ± SD). The asterisk indicates change over time from pregravid status through late pregnancy (ANOVA). (Adapted from Catalano PM, Tyzbir ED, Roman NM, et al: Longitudinal changes in insulin release and insulin resistance in non-obese pregnant women. Am J Obstet Gynecol 165:1667-1672, 1991.)
  • 5. 957CHAPTER 46 Diabetes in Pregnancy nificant decrease in insulin sensitivity in women who go on to develop GDM, when estimated before conception or after delivery,35 compared with a matched control group. During pregnancy, the percent decrease in insulin sensitivity is approximately the same as the percent change in a matched control group (i.e., approximately 50% to 60%). The decreased insulin sensitivity observed during pregnancy in the woman who develops GDM is a function of her pregravid metabolic status, and clinically, the increased glucose concentrations represent the inability of pancreatic beta cells to normalize glucose levels (Fig. 46-5). The relationship between insulin sensitivity and insulin response has been characterized by Bergman and colleagues16 as a hyperbolic curve or, when multiplied, as the disposition index. A curve that is “shifted to the left” can be plotted for individuals who go on to develop GDM (Fig. 46-6). Whether the insulin resistance precedes the beta cell defect or they occur concomitantly is not known with certainty. However, Buchanan36 proposed that insulin resistance caused the beta cell dysfunction in susceptible individuals. The increased risk of type 2 diabetes in women who formerly had GDM may be a function of decreasing insulin sensitivity (i.e., worsening insulin resistance) exac- erbated by increasing age, adiposity, and the inability of the beta cells to fully compensate. The data on the changes on glucose metabolism in women with type 1 diabetes are not as well examined. Schmitz and coworkers37 evaluated the longitudinal changes in insulin sensitivity in women with type 1 diabetes in early and late pregnancy and after delivery. There was a 50% decrease in insulin sensitivity in late gestation. There was no significant difference in insulin sensitivity in these women in early pregnancy or within 1 week of delivery compared with nonpregnant women with type 1 diabetes. Based on the available data, women with Pregravid Pϭ.025 Pϭ.025 *Pϭ.0001 1stPhaseinsulinresponse(μU/mL)2ndPhaseinsulinresponse(μU/mL) 0 100 200 400 300 500 600 700 800 A B Early pregnancy Late pregnancy Pregravid Pϭ001 *Pϭ.0001 0 1000 2000 4000 3000 5000 Early pregnancy Late pregnancy FIGURE 46-4 Increased insulin response. Changes in first (A) and second (B) phase pregravid through early (12 to 14 weeks) and late (34 to 36 weeks) pregnancy insulin response during an intravenous glucose tolerance test (mean ± SD). The asterisk indicates change over time from pregravid status through late pregnancy (ANOVA). (Adapted from Catalano PM, Tyzbir ED, Roman NM, et al: Longitudinal changes in insulin release and insulin resistance in non- obese pregnant women. Am J Obstet Gynecol 165:1667-1672, 1991.) Control GDM Ptϭ0.0001 Pgϭ0.03 Pregravid 0 0.1 0.2 0.3 Early pregnancy Late pregnancy FIGURE 46-5 Alterations in insulin sensitivity. Longitudinal changes in insulin sensitivity during clamp 40 mU·m−2 ·min−1 insulin infusion in obese women (mean ± SD). GDM, gestational diabetes mellitus; Pg, difference between groups; Pt, individual longitudinal changes with time. (Adapted from Catalano PM, Huston L, Amini SB, Kalhan SC: Longitudinal changes in glucose metabolism during pregnancy in obese women with normal glucose tolerance and gestational diabetes. Am J Obstet Gynecol 180:903-916, 1999.) 0.0 0 200 Insulin sensitivity index (ISI) GDM Normal 3rd Trimester Postpartum Insulinsecretionrate(ISR) 400 600 800 1000 0.1 0.2 0.3 0.4 FIGURE 46-6 Insulin sensitivity and secretion relationships in normal women and women with gestational diabetes mellitus. Prehepatic insulin secretion was assessed during steady-state hyperglycemia using plasma insulin and C-peptide concentrations and C-peptide kinetics in individual patients. (Printed with permission from Buchanan TA: Pancreatic β-cell defects in gestational diabetes: Implications for the pathogenesis and prevention of type 2 diabetes. J Clin Endocrinol Metab 86:989-993, 2001.)
  • 6. 958 CHAPTER 46 Diabetes in Pregnancy type 1 diabetes have similar alterations in insulin sensitivity compared with women with normal glucose tolerance. Mechanism of Insulin Resistance The mechanisms related to the changes in insulin resistance during pregnancy are better characterized because of research in the past decade. The insulin resistance of pregnancy is almost completely reversed shortly after delivery,38 consistent with the clinically marked decrease in insulin requirements. The placenta has long been suspected of producing hormonal factors related to these alterations in metabo- lism. The placental mediators of insulin resistance in late pregnancy have been ascribed to alterations in maternal cortisol concentrations and placenta-derived hormones such as human placental lactogen (HPL), progesterone, and estrogen.39-41 Kirwan and associates42 re- ported that circulating tumor necrosis factor-α (TNF-α) concentra- tions had an inverse correlation with insulin sensitivity as estimated from clamp studies. Among leptin, HPL, cortisol, human chorionic gonadotropin, estradiol, progesterone, and prolactin, TNF-α was the only significant predictor of the changes in insulin sensitivity from the pregravid period through late gestation. TNF-α and other cytokines are produced by the placenta, and 95% of these molecules are trans- ported to maternal rather than fetal circulations.42 Other factors, such as circulating free fatty acids, may contribute to the insulin resistance of pregnancy.43 Studies in human skeletal muscle and adipose tissue have demon- strated defects in the post-receptor insulin-signaling cascade during pregnancy. Friedman and colleagues showed that women in late pregnancy have reduced insulin receptor substrate-1 (IRS-1) concen- trations compared with those of matched nonpregnant women.44 Downregulation of the IRS-1 protein closely parallels insulin’s decreased ability to induce additional steps in the insulin signaling cascade that result in the transporter (GLUT-4) arriving at the cell surface to allow glucose to enter the cell. Downregulation of IRS-1 closely parallels the decreased ability of insulin to stimulate 2- deoxyglucose uptake in vitro in pregnant skeletal muscle. During late pregnancy in women with GDM, in addition to decreased IRS-1 con- centrations, the insulin receptor-β (i.e., component of the insulin receptor within the cell rather than on the cell surface) has a decreased ability to undergo tyrosine phosphorylation.44 This is an important step in the action of insulin after it has bound to the insulin receptor on the cell surface. This additional defect in the insulin-signaling cascade is not found in pregnant or nonpregnant women with normal glucose tolerance and results in a 25% lower glucose transport activity. TNF-α also acts by means of a serine/threonine kinase, thereby inhibiting IRS-1 and tyrosine phosphorylation of the insulin receptor.45 These post-receptor defects may contribute in part to the pathogenesis of GDM and an increased risk for type 2 diabetes in later life. Complications of Diabetes during Pregnancy Maternal Morbidity Women with pregestational diabetes are at risk for a number of obstet- ric and medical complications. The relative risk of these problems is proportional to the duration and severity of disease. Evers and cowork- ers reported the maternal morbidity of a cohort of 323 type 1 diabetic pregnancies followed prospectively in the Netherlands.46 Glycemic control was excellent (Hb A1c ≤7.0% in 75%), but the rates of pre- eclampsia (12.7%), preterm delivery (32%), cesarean section (44%), and maternal mortality (60 deaths per 100,000 pregnancies) were con- siderably higher than in the nondiabetic population. Retinopathy Diabetic retinopathy is the leading cause of blindness between the ages of 24 and 64 years.47 Some form of retinopathy is present in virtually 100% of women who have had type 1 diabetes for 25 years or more; approximately 20% of these women are legally blind. The topic of diabetic retinopathy has been reviewed elsewhere.48 The pattern of progression of diabetic retinopathy is predictable, proceeding from mild nonproliferative abnormalities, which are asso- ciated with increased vascular permeability, to moderate and severe nonproliferative diabetic retinopathy, which is characterized by vascu- lar closure, to proliferative diabetic retinopathy, which is characterized by the growth of new blood vessels on the retina and posterior surface of the vitreous. It has been proposed that pregnancy accelerates these changes, although the mechanism is controversial.49 Trials have not shown any acceleration in microvascular complications when pregnant and nonpregnant diabetic subjects were closely followed and compared.50 Vision loss resulting from diabetic retinopathy results from several mechanisms. First, central vision may be impaired by macular edema or capillary nonperfusion. Second, the new blood vessels of prolifera- tive diabetic retinopathy and contraction of the accompanying fibrous tissue can distort the retina and lead to tractional retinal detachment, producing severe and often irreversible vision loss. Third, the new blood vessels may bleed, adding the further complication of preretinal or vitreous hemorrhage. FACTORS AFFECTING PROGRESSION OF RETINOPATHY DURING PREGNANCY Although past studies suggested that rapid induction of glycemic control in early pregnancy stimulated retinal vascular proliferation,51 later investigations indicate that the severity and duration of diabetes before pregnancy have a greater effect. Temple and colleagues52 studied 179 women with pregestational type 1 diabetes, performing dilated fundal examination at the first prenatal visit, 24 weeks, and 34 weeks. Progression to proliferative diabetic retinopathy occurred in only 2.2%, and moderate progression occurred in 2.8%. However, progres- sion was significantly greater in women who had had diabetes for more than 10 years (10% versus 0%; P = .007) and in women with moderate to severe background retinopathy before pregnancy (30% versus 3.7%; P = .01). In the European Diabetes (EURODIAB) Prospective Compli- cations Study, 793 potentially childbearing women at baseline com- pleted the follow-up, and 21% gave birth. Duration of diabetes and high HbA1c levels at recruitment were significant risk factors for reti- nopathy progression, whereas giving birth was not.50 OPHTHALMOLOGIC MANAGEMENT DURING PREGNANCY Screening for retinopathy by a qualified ophthalmologist is recom- mended before pregnancy and again during the first trimester for patients with pregestational diabetes because of the demonstrated effectiveness of laser photocoagulation therapy in arresting progres- sion. Patients with minimal disease should be re-examined once or twice during the pregnancy and at 3 and 6 months after delivery. Those with significant retinal pathology may require monthly follow-up.53
  • 7. 959CHAPTER 46 Diabetes in Pregnancy Nephropathy Diabetes is the most common cause of end-stage renal disease in the United States and Europe. In the United States, diabetic nephropathy accounts for about 45% of new cases of this condition. In 2003, the cost for treatment of diabetic patients with end-stage renal disease was in excess of $55,000 annually per person and more than $5 billion in aggregate.54 About 20% to 40% of patients with type 1 or type 2 dia- betes develop evidence of nephropathy over time, but the rate and extent of progression are highly individual.53 The pathophysiology of diabetic renal disease is incompletely understood, but several factors play a role, including genetic suscepti- bility, control of hyperglycemia, and the duration and severity of coex- isting hypertension. Additional insults, such as repeated urinary tract infections, excessive glycogen deposition, and papillary necrosis, all hasten deterioration of renal function. The kidney is normal at the onset of diabetes, but within a few years, glomerular basement mem- brane thickening can be identified. By 5 years, there is expansion of the glomerular mesangium, resulting in diffuse diabetic glomerulosclero- sis. All patients with marked mesangial expansion exhibit proteinuria exceeding 400 mg in 24 hours. The peak incidence of nephropathy occurs after about 16 years of diabetes. CATEGORIES OF DIABETIC NEPHROPATHY Categories of diabetic nephropathy are distinguished by the level of urinary protein excretion. Table 46-3 shows normal values and the current clinical criteria for microalbuminuria and nephropathy. Screening for microalbuminuria can be performed by three methods: measurement of the albumin-to-creatinine ratio in a random spot collection; 24-hour collection with creatinine, allowing the simultane- ous measurement of creatinine clearance; and timed (e.g., 4-hour or overnight) collection. The first method is preferred because it is the easiest to carry out in an ambulatory setting, and it provides adequately accurate information. The other methods are rarely used.55 EFFECT OF PREGNANCY ON PROGRESSION OF NEPHROPATHY Although some clinicians discourage pregnancy in women with diabetic renal disease because of concerns of permanent renal deterio- ration as a result of the pregnancy, recent data consistently indicate that pregnancy does not measurably alter the time course of diabetic renal disease. Progression of diabetic nephropathy is closely related to the degree of glycemic control. To the extent that most women have better glyce- mic control during pregnancy, delay or slowing of renal function dete- rioration can be expected. A study of renal function for 4 years before and 4 years after pregnancy in 11 patients with diabetic nephropathy56 showed that the gradual rise in serum creatinine over that period was unaffected by the intervening pregnancy. Imbasciati and co- workers57 performed a longitudinal study of 58 women with chronic renal disease, following each through pregnancy. The mean serum creatinine level was 6 mg/dL at the start of the study and 6 mg/dL after delivery. Although they found that women with glomerular filtration rates less than 40 mL/min and with proteinuria greater than 1 g/day had increased risk of delivering a child with a birth weight less than 2500 g (odds ratio [OR] = 5.1; 95% confidence interval [CI], 1.03 to 25.6), the association was not related to renal disease, hypertension, and maternal age. When the cohort was taken as a whole, even those with lower glomerular filtration rates and higher levels of proteinuria had similarly modest changes in renal function when after- and before- pregnancy indices were compared.57 Rossing and colleagues58 evaluated the effect of pregnancy on dete- rioration of renal function in 93 women older than 20 years. They compared groups of never-pregnant and ever-pregnant women who received similar medical therapy and who had similar degrees of renal function at the start of the study. The results are shown in Figure 46-7. Based on this excellent prospective study, it is evident that pregnancy neither alters the time course of renal disease nor increases the likeli- hood of transition to end-stage renal disease. COURSE OF DIABETIC NEPHROPATHY DURING PREGNANCY In general, patients with underlying renal disease before pregnancy can be expected to experience various degrees of deterioration during pregnancy. The physiologic changes associated with normal pregnancy increase renal blood flow and glomerular filtration by 30% to 50%. Most women with preexisting diabetic nephropathy experience this improvement in renal function, especially during the second trimes- ter.59 During the third trimester, however, when mean arterial pressure and peripheral vascular resistance typically increase, women with diabetic microvascular disease may experience marked diminution of renal function, an exacerbation in hypertension, and in many cases, preeclampsia. The third-trimester increase in maternal blood pressure and serum creatinine concentration are among the most common FIGURE 46-7 End-stage renal disease. Cumulative incidence of end-stage renal disease (ESRD) in ever-pregnant (triangles) and never- pregnant (circles) groups. (From Rossing K, Jacobsen P, Hommel E, et al: Pregnancy and progression of diabetic nephropathy. Diabetologia 45:36, 2002.) TABLE 46-3 CATEGORIES OF DIABETIC RENAL DISEASE Category* Albumin-to-Creatinine Ratio (mg/mg)† Normal <30 Microalbuminuria 30-299 Nephropathy ≥300 *Categories of diabetic nephropathy are distinguished by the level of urinary protein excretion. Two of three collections in a 3- to 6-month period should be abnormal for a diagnosis of microalbuminuria or nephropathy. † The ratio of albumin to creatinine was determined by random spot collection. Adapted from American Diabetes Association. Standards of medical care in diabetes. Diabetes Care 28(Suppl 1):S4-S36, 2005.
  • 8. 960 CHAPTER 46 Diabetes in Pregnancy precipitating events leading to indicated preterm delivery in diabetic women. Although delivering the fetus to interrupt the precipitous rise in blood pressure may result in premature birth, this is usually preferable to the risk of maternal renal failure or stroke (discussed later). Reece and colleagues60 reviewed the outcomes of 315 pregnant women with preexisting diabetic nephropathy. Of these, 17% ulti- mately developed end-stage renal disease, and 5% died as a result of renal insufficiency. During pregnancy, proteinuria and mean arterial pressure significantly increased from the first to the third trimester (P < .05). Another study by Purdy and coworkers61 demonstrated a rise in the mean serum creatinine level from 1.8 mg/dL before pregnancy to 2.5 mg/dL in the third trimester. Renal function was stable in 27%, transiently worsened during pregnancy in 27%, and demonstrated a permanent decline in 45%. Proteinuria increased during pregnancy in 79%, and exacerbation of hypertension or preeclampsia occurred in 73%. Ekbom and colleagues62 compared the outcomes of pregnancies in women with microalbuminuria or overt nephropathy and those without. Their results (Fig. 46-8) indicate that the likelihood of preterm delivery is considerably increased for women with microalbuminuria, mainly because of preeclampsia. RENAL DIALYSIS IN DIABETIC PREGNANT WOMEN Although women receiving dialysis for end-stage renal disease are often amenorrheic or at least anovulatory, pregnancies have become increasingly common63 during therapy (3% to 7%).64 Unfortunately, the prognosis for pregnancy in diabetic women with end-stage renal disease continues to be exceedingly poor, with fetal loss rates remaining in the range of 30% to 50% over the past decade. Neonatal death rates are between 5% and 15%, and less than one half of pregnancies among women with end-stage renal disease result in viable children. About 60% of births are premature, often because of uncontrollable hyper- tension, renal failure, or fetal growth failure.65 Of the 20% to 25% of pregnancies ending in live births, 40% of babies are severely growth restricted. A major practical problem with achieving a successful pregnancy outcome while on hemodialysis is proper maintenance of maternal vascular volume. Dialysis teams are accustomed to removing signifi- cant vascular volume at each session. However, during a normal preg- nancy, there is a progressive expansion in vascular volume of at least 20% to 30% above nonpregnant values from 8 to 30 weeks’ gestation. This volume augmentation is required to maintain uteroplacental per- fusion and fetal growth. Pregnancies in which vascular volume does not increase appropriately have a high incidence of fetal growth restric- tion and stillbirths. Difficulties with vascular underfill (e.g., hyperten- sion, poor fetal growth, asphyxia) and overfill (e.g., hypertension) are common in pregnant patients on hemodialysis and often are difficult to rectify. The poor prognosis associated with hemodialysis combined with other considerations has prompted increased interest in continuous ambulatory peritoneal dialysis. Several successful pregnancy series have been reported.65-67 Although fluid and chemical balance is con- stant and heparinization is not necessary, intrauterine deaths, abrup- tion, prematurity, hypertension, and fetal distress still occur. The best strategy for most diabetic women on dialysis desiring pregnancy is to undergo kidney transplantation. RENAL TRANSPLANTATION Successful pregnancy after renal transplantation is now a reality. Davison’s67 review of 1569 pregnancies in women with renal allografts found that of the 60% of pregnancies that continued beyond the first trimester, 92% resulted in a viable infant. Preeclampsia occurred in 30%, preterm delivery in about 50%, and IUGR in 20%. Patients with the worst renal function had the poorest pregnancy outcomes. Similar results were reported by Yassaee and Moshiri.68 The most common maternal complications in 95 pregnancies were anemia in 65%, and preeclampsia in 47%. Three patients lost their graft, and six had impaired kidney allograft function 2 years after pregnancy.68 In a historical cohort study, 86 women who had at least one post- transplantation pregnancy were compared with 125 who had no preg- nancy after renal transplantation. Patients were matched for age, cause of end-stage renal disease, treatment protocol, and first serum creati- nine level. The 5-year patient and graft survival rates were not signifi- cantly different between the study groups. Among the women with at least one pregnancy, only 10% had serum creatinine levels above 1.5 mg/dL at the end of 46 months of follow-up, compared with 28% of the never-pregnant group.69 Based on these findings, it appears that perinatal outcomes are better in patients who have undergone renal 100% 90% 80% 70% 60% 50% 40% 30% 20% 10% 0% Preterm birth IUGR Preeclampsia Normal Microalbuminuria Nephropathy FIGURE 46-8 Outcomes of pregnancies in women with microalbuminuria or overt nephropathy. Pregnancy outcomes are compared for diabetic women with underlying renal disease. IUGR, intrauterine growth restriction. (Adapted from Ekbom P, Damm P, Feldt-Rasmussen U, et al: Pregnancy outcome in type 1 diabetic women with microalbuminuria. Diabetes Care 24:1739, 2001. Copyright © American Diabetes Association. Reprinted with permission from the American Diabetes Association.)
  • 9. 961CHAPTER 46 Diabetes in Pregnancy transplantation than in those with end-stage renal disease who are on dialysis. Cardiovascular Complications Cardiovascular complications experienced by pregnant women with diabetes include chronic hypertension, pregnancy-induced hyperten- sion, and rarely, atherosclerotic heart disease. In composite studies of all types of diabetic pregnancies, the incidence of hypertensive disorders during pregnancy varies from 15% to 30%,70,71 with the rate of hypertension increased fourfold over that for the nondiabetic population.72 CHRONIC HYPERTENSION Chronic hypertension (i.e., blood pressure at or above 140/90 mm Hg before 20 weeks’ gestation)73 complicates 10% to 20% of preg- nancies in diabetic women and up to 40% of those in diabetic women with preexisting renal or retinal vascular disease.74 The perinatal prob- lems encountered with chronic hypertension include IUGR, maternal stroke, preeclampsia, and abruptio placentae. In pregestational diabe- tes, the prevalence of chronic hypertension increases with duration of diabetes and is closely associated with nephropathy.72,75 The Diabetes in Early Pregnancy (DIEP) study reported that women with type 1 diabetes have higher mean blood pressures throughout pregnancy than do normal controls.76 In a significant proportion of patients, this difference is probably evidence of underlying renal compromise. Preexisting chronic hypertension should be suspected when the diabetic patient’s systolic blood pressure exceeds 130/80 mm Hg before the third trimester. The diagnosis is strength- ened by finding a failure of mean blood pressure to decline normally in the late second trimester, elevation in the blood urea nitrogen level above 10 mg/dL, serum creatinine concentration above 1 mg/dL, cre- atinine clearance less than 100 mL/min, or a combination of these factors. PREECLAMPSIA Preeclampsia is more common among women with diabetes, occur- ring four times as frequently in women with pregestational diabetes as in those without diabetes.72 The risk of developing preeclampsia is proportional to the duration of diabetes before pregnancy and the existence of nephropathy and hypertension; more than one third of pregnant women who have had diabetes for more than 20 years develop this condition. As is shown in Figure 46-9, patients with White class B diabetes have a risk profile similar to that of nondiabetic patients, but women with evidence of renal or retinal vasculopathy (classes D, F, or R) have a 50% excess risk of hypertensive complications over the rate observed for those with no hypertension. Women with diabetic nephropathy have similar rates of preeclampsia. Renal function assessments should be performed in each trimester in women with overt diabetic vascular disease and in those who have had diabetes for more than 10 years. Significant proteinuria, plasma uric acid levels above 6 mg/dL, or evidence of HELLP syndrome (hemolysis, elevated liver enzymes, and low platelets) should prompt a workup for preeclampsia. HEART DISEASE Although coronary heart disease is rarely encountered in preg- nant women with diabetes, a study by Airaksinen and colleagues77 suggests that such women may have preclinical cardiomyopathy and autonomic neuropathy. The diabetic women studied had less than the expected increase in left ventricular size and stroke volume in preg- nancy, lower heart rate increases, and smaller increments in cardiac output. Although uncommon, atherosclerotic heart disease (White class H) may afflict diabetic patients in the later reproductive years. Patients with this complication have a mean age of 34 years and exhibit other evidence of diabetic vascular involvement (White class D or R).78 For diabetic women with cardiac involvement, pregnancy outcome is 0% Percentpreeclampsia No hypertension HypertensionHypertension and proteinuria Class B Class C Class D Class F/R 5% 10% 15% 20% 25% 30% 35% 40% FIGURE 46-9 Likelihood of preeclampsia in diabetic pregnancy by White’s class and preexisting hypertension. The risk of developing preeclampsia is proportional to the duration of diabetes before pregnancy and the existence of nephropathy and hypertension. (From Sibai BM, Caritis S, Hauth J, et al: Risks of preeclampsia and adverse neonatal outcomes among women with pregestational diabetes mellitus. National Institute of Child Health and Human Development Network of Maternal-Fetal Medicine Units. Am J Obstet Gynecol 182:364, 2000.)
  • 10. 962 CHAPTER 46 Diabetes in Pregnancy dismal, with a maternal mortality rate of 50% or higher and perinatal loss rates approaching 30%.79 Recognition of cardiac compromise in pregnant women with diabetes may be difficult because of the decrease in exercise tolerance that occurs during normal pregnancy. Compro- mised cardiac function may also be difficult to detect in patients restricted to bed rest for hypertension or poor fetal growth. It is prudent to obtain a detailed cardiovascular history in all diabetic patients and to consider electrocardiography and maternal echocar- diography in patients who have type 1 diabetes and are older than 30 years or in patients who have had diabetes for 10 years or more. With intensive monitoring, successful pregnancy is possible, albeit hazard- ous for women with significant cardiac disease.80 Diabetic Ketoacidosis Diabetic ketoacidosis (DKA) during pregnancy is a medical emergency for the mother and fetus. Pregnant women with type 1 diabetes are at increased risk for DKA, although the incidence and morbidity of this complication have decreased from 20% or more in the older literature to approximately 2% in later reports.81 The rate of intrauterine fetal death, formerly as high as 35% with DKA during pregnancy, has dropped to 10% or less. Precipitating factors for ketoacidosis include pulmonary, urinary, or soft tissue infections; poor compliance; and unrecognized new onset of diabetes. Because severe DKA threatens the life of the mother and fetus, prompt treatment is essential. Fetal well-being in particular is in jeopardy until maternal metabolic homeostasis is reestablished. High levels of plasma glucose and ketones are readily transported to the fetus, which may be unable to secrete sufficient quantities of insulin to prevent DKA in utero. DKA evolves from inadequate insulin action and functional hypo- glycemia at the target tissue level. This leads to increased hepatic glucose release but decreased or absent tissue disposal of glucose. Glucose-lacking tissues release ketone bodies, and vascular hypergly- cemia promotes osmotic diuresis. Over time, the diuresis causes pro- found vascular volume depletion and loss of electrolytes. The release of stress hormones (i.e., catecholamines, glucagon, growth hormone, and cortisol) further impairs insulin action and contributes to insulin resistance. Left unchecked, this cycle of dehydration, tissue hypoglyce- mia, and electrolyte depletion can lead to multisystem collapse, coma, and death. Early in the illness, hyperglycemia and ketosis are moderate. If hyperglycemia is not corrected, diuresis, dehydration, and hyperosmo- lality follow. Pregnant women in the early stages of ketoacidosis respond quickly to appropriate treatment of the initiating cause (e.g., broad-spectrum antibiotics), additional doses of regular insulin, and volume replacement. Patients with advanced DKA usually present with typical findings, including hyperventilation, normal or obtunded mental state (depend- ing on severity of the acidosis), dehydration, hypotension, and a fruity odor to the breath. Abdominal pain and vomiting may be prominent symptoms. The diagnosis of DKA is confirmed by the presence of hyperglycemia (glucose >200 mg/100 mL) with positive test results for serum ketones at a level of 1:4 or greater. As many as one third of patients in the early or very late stages of DKA may have initial blood glucose levels less than 200 mg/dL.82 A pregnant diabetic patient with a history of poor food intake or vomit- ing for more than 12 to 16 hours should have a thorough workup for DKA, including a complete blood cell count and electrolyte determina- tions. A serum bicarbonate level below 18 mg/dL should prompt per- formance of an arterial blood gas analysis. In all cases of DKA, the diagnosis is confirmed by arterial blood gases demonstrating a meta- bolic acidemia (i.e., base excess of −4 or lower).83 Table 46-4 contains a protocol for treatment of DKA. The impor- tant steps in management should include the following: ᭿ Search for and treat the precipitating cause. Typical initiators include pyelonephritis and pulmonary or gastrointestinal viral infections. ᭿ Perform vigorous and sustained volume resuscitation. The patient will continue to generate vascular volume deficits TABLE 46-4 TREATMENT PROTOCOL FOR DIABETIC KETOACIDOSIS* Measures Initial Phase (6-24 hr) Recovery Phase General Search for initiating cause of ketoacidosis. Insert bladder catheter. If patient is unconscious, establish nasogastric tube. Continue treatment of initiating cause. Remove bladder catheter when vascular volume is replaced. Fluids Administer 0.9% NaCl at 1000 mL/hr × 2 hr and then 500 mL/hr until 5-8 L infused. Continue 0.9% NaCl at 100 mL/hr for at least 48 hours to avoid return of ketoacidosis. Insulin Administer 20 U of insulin by IV bolus and then 5-10 U/hr by IV infusion. When acidosis is resolved and plasma glucose <160 mg/dL, reduce insulin infusion to 0.7-2.0 U/hr. Return to patient’s prior SC insulin dosing after plasma glucose is stable for at least 12 hr. Glucose When plasma glucose is <250 mg/dL, add 5% dextrose to 0.9% NaCl. Potassium If serum K+ level is normal or low, infuse KCl at 20 mEq/hr. If serum K+ level is high, wait until K+ is normal, then KCl at 20 mEq/hr. Measure serum K+ level every 2-4 hr. Use oral potassium supplementation for 1 week. Bicarbonate If pH is <7.1, add one ampule of bicarbonate (50 mEq) to IV; repeat until pH >7.1. *These are general guidelines. Because there may be wide variation in individual patient needs, there is no substitute for careful monitoring of each patient, particularly in the initial phase of therapy. IM, intramuscular; IV, intravenous; KCl, potassium chloride; NaCl, sodium chloride; SC, subcutaneous. Adapted from American College of Obstetricians and Gynecologists (ACOG): Clinical management guidelines for obstetrician-gynecologists. ACOG practice bulletin no. 60, March 2005. Pregestational diabetes mellitus. Obstet Gynecol 105:675-685, 2005.
  • 11. 963CHAPTER 46 Diabetes in Pregnancy until her glucose levels and acidosis are largely resolved. A physiologic fluid such as 0.9% NaCl with 20 mEq/L of potassium should be used and continued until the acidosis is substantially corrected (base excess of −2 or less). This usually requires an infusion at 1 to 2 L/hr for the first 1 to 2 hours, followed by reduced rates (150 to 200 mL/hr) until the base deficit approaches a normal level. ᭿ Place a bladder catheter to monitor urine output. ᭿ Use insulin to correct hyperglycemia. Although intermittent injections can be used, a continuous infusion of regular or short-acting insulin (i.e., lispro or aspart) allows frequent adjustments. When giving insulin as a continuous infusion, 1 to 2 units/hr gradually corrects the patient’s glucose abnormality over 4 to 8 hours. Attempts to normalize plasma glucose levels rapidly (i.e., in less than 2 to 3 hours) may result in hypoglycemia and further physiologic counterregulatory responses. ᭿ Monitor serum bicarbonate levels and arterial blood gas base deficits every 1 to 3 hours to guide management. Even when the plasma glucose level is normalized, acidemia may persist, as evidenced by continuing abnormalities in the patient’s electrolyte concentrations. Unless volume therapy is continued until the patient’s electrolyte stores and plasma concentrations have substantially returned to normal, DKA may reappear, and the cycle of metabolic derangement will be renewed. When DKA occurs after 24 weeks’ gestation, fetal status should be continuously monitored by fetal heart rate monitoring or a biophysical profile, or both. However, even when fetal status is questionable during the phase of therapeutic volume and plasma glucose correction, emer- gency cesarean section should be avoided. Usually, correction of the maternal metabolic disorder is effective in normalizing fetal status. Nevertheless, if a reasonable effort has been expended in correcting the maternal metabolic disorder and the fetal status remains a concern, delivery should not be delayed. Fetal Morbidity and Mortality Perinatal mortality in diabetic pregnancy has decreased 30-fold since the discovery of insulin in 1922 and the institution of intensive obstetric and infant care in the 1970s. Improved techniques of main- taining maternal euglycemia have led to later timing of delivery and reduced iatrogenic respiratory distress syndrome. Nevertheless, the perinatal mortality rates reported for diabetic women remain appro- ximately twice those observed in the nondiabetic population (Table 46-5). Congenital malformations, respiratory distress syndrome, and extreme prematurity account for most perinatal deaths in diabetic pregnancies. Miscarriage Studies of miscarriage rates from a decade ago indicated an increased incidence of spontaneous abortion among women with pregestational diabetes, especially those with poor glucose control during the peri- conceptional period. Given the well-documented association between congenital anomalies and hyperglycemia, such a finding is not surpris- ing. Sutherland and Pritchard84 reported the outcomes of 164 diabetic pregnancies managed with relaxed glycemic control and found a spon- taneous abortion rate of almost double the expected rate. Miodovnik and coworkers85 studied spontaneous abortion in diabetic pregnancy prospectively and found an increasing rate among patients with more advanced classes of diabetes (rates for classes C, D, and F were 25%, 44%, and 22%, respectively). Later studies of populations with better glycemic control report miscarriage rates similar to those in the non- diabetic population,86,87 indicating that diabetic women with excellent glycemic control have a risk of miscarriage equivalent to those without diabetes. These studies can be used to encourage patients who have not yet conceived to achieve excellent glycemic control. Patients presenting in early pregnancy with normal glycohemoglobin values can be reassured that the overall elevation in risk of miscarriage is modest. However, for patients with glycohemoglobin values 2 to 3 standard deviations above the norm, intense early pregnancy surveillance is indicated. Congenital Anomalies Among women with overt diabetes before conception, the risk of a structural anomaly in the fetus is increased fourfold to eightfold,88 compared with the 1% to 2% risk for the general population. In a cohort study of 2359 pregnancies in women with pregestational dia- betes, the major congenital anomaly rate was 4.6% overall, with 4.8% for type 1 diabetes and 4.3% for type 2 diabetes, more than double the expected rate. Neural tube defects were increased 4.2-fold and congeni- tal heart disease by 3.4-fold. Of all anomalies confirmed in the neonate, only 65% were diagnosed antenatally.9 The typical congenital anoma- lies observed in diabetic pregnancies and their frequency of occurrence are listed in Table 46-6. There is no increase in birth defects among offspring of diabetic fathers and nondiabetic women and women who develop gestational diabetes after the first trimester, indicating that glycemic control during embryogenesis is the main factor in the genesis of diabetes-associated birth defects. A classic report by Miller and coauthors89 compared the frequency of congenital anomalies in patients with normal or high first-trimester maternal glycohemoglobin levels and found only a 3.4% rate of anomalies with an Hb A1c value less than 8.5%, whereas the rate TABLE 46-5 PERINATAL MORTALITY RATES IN DIABETIC PREGNANCY* Group Gestational Overt Normal† Fetal mortality rate (%)* 4.7 10.4 5.7 Neonatal mortality rate (%)* 3.3 12.2 4.7 Perinatal mortality rate (%)* 8.0 22.6 10.4 *Mortality rates = deaths per 1000 live births. † Normal was determined from California data from 1986; figures were corrected for birth weight, sex, and race. TABLE 46-6 CONGENITAL MALFORMATIONS IN INFANTS OF INSULIN- DEPENDENT DIABETIC MOTHERS Anomaly Approximate Relative Risk Percent Risk (%) All cardiac defects 18 8.5 All central nervous system anomalies 16 5.3 Anencephaly 13 Spina bifida 20 All congenital anomalies 8 18.4 Adapted from Becerra JE, Khoury MJ, Cordero JF, et al: Diabetes mellitus during pregnancy and the risks for specific birth defects: A population based case-control study. Pediatrics 85:1, 1990.
  • 12. 964 CHAPTER 46 Diabetes in Pregnancy of malformations in patients with poorer glycemic control in the peri- conceptional period (Hb A1c above 8.5) was 22.4%. Lucas and cowork- ers90 reported an overall malformation rate of 13.3% in 105 diabetic patients. However, the risk of delivering a malformed infant was zero with an Hb A1 value less than 7%, 14% with Hb A1 between 7.2% and 9.1%, 23% with Hb A1 between 9.2% and 11.1%, and 25% with Hb A1 greater than 11.2%. PATHOGENESIS The mechanism by which hyperglycemia disturbs embryonic devel- opment is multifactorial. The potential teratologic role of disturbances in the metabolism of inositol, prostaglandins, and reactive oxygen species has been established.91 Embryonic hyperglycemia may promote excessive formation of oxygen radicals in susceptible fetal tissues, which are inhibitors of prostacyclin.92 The resulting overabundance of thromboxanes and other prostaglandins may then disrupt the vascu- larization of developing tissues. In support of this theory, addition of prostaglandin inhibitors to mouse embryos in culture medium pre- vented glucose-induced embryopathy.93 The pathogenic role of free radical species in teratogenesis with diabetes has been underscored by demonstrating the effect of dietary antioxidants experimentally. High doses of vitamins C and E decreased fetal dysmorphogenesis to non- diabetic levels in rat pregnancy and rat embryo culture.94,95 PREVENTION Because the critical time for teratogenesis is during the period 3 to 6 weeks after conception, nutritional and metabolic intervention must be instituted preconceptionally to be effective. Several clinical trials of preconceptional metabolic care have demonstrated that malformation rates equivalent to those in the general population can be achieved with meticulous glycemic control.96 Although studies of dietary folate and vitamin C supplementation have demonstrated success in reduc- ing the incidence of congenital anomalies in experimental diabetes in rats,97 the efficacy of a high-antioxidant diet in preventing diabetes- induced structural anomalies in humans has not been adequately explored. Preconceptional management of pregestational diabetics is discussed in the following sections. Intrauterine Growth Restriction Although the weights of infants of diabetic mothers (IDMs) usually are skewed into the upper range, IUGR occurs with significant fre- quency in diabetic pregnancies, especially in women with underlying vascular disease. Additional factors that increase the risk for IUGR in a diabetic pregnancy include the higher incidence of structural anoma- lies and maternal hypertension. Asymmetrical IUGR is encountered most frequently in diabetic patients with vasculopathy (i.e., retinal, renal, or chronic hyperten- sion).88 This association suggests that uteroplacental vasculopathy may promote restricted fetal growth in these patients.98 Patients with poor glycemic control and frequent episodes of ketosis and hypoglycemia are also prone to preeclampsia and poor fetal growth. Whether fetal growth restriction results from poor maternal-placental blood flow or intrinsically poor placental function is unresolved.99 Fetal Obesity Macrosomia has been defined using various criteria, which include birth weight greater than the 90th percentile, birth weight greater than 4000 g, and estimates of neonatal adiposity based on body composi- tion measures. As early as 1923, research by Moulton100 described vari- ability in weight among various mammalian species that was attributed to the amount of adipose tissue or fat mass rather than lean body mass. Using autopsy data and chemical analysis of 169 stillbirths, Sparks101 described a relatively comparable rate of accretion of lean body mass in fetuses that were small for gestational age (SGA), average for gesta- tional age (AGA), and large for gestational age (LGA), but he found considerable variation in the accretion of fetal fat in utero. The human fetus at term has the greatest percent of body fat (approximately 10% to 12%) compared with other mammals.102 GROWTH DYNAMICS The increased growth of the mother is composed primarily of total body water and adipose tissue in early gestation.26 Relative to the feto- placental unit, the human placenta attains most of its growth by the middle of the second trimester. In contrast, approximately 70% of fetal growth occurs over the last third of gestation (1000 g at 28 weeks to 3500 g at term). Yang and associates6 reported that IDMs with diabetes still have an increased relative risk (RR) of being LGA (RR = 3.59; 95% confidence interval [CI], 1.55 to 5.84) compared with the infants of women with normal glucose tolerance.100 Ogata and colleagues,103 using serial ultrasound measures of the fetus of women with diabetes, described an increase in the rate of abdominal circumference growth after 24 weeks’ gestation. The increase in growth appears to affect pri- marily insulin-sensitive tissues such as the subcutaneous fat included in measures of abdominal circumference.104 Ninety-five percent of the variance in fetal abdominal circumference can be accounted for by subcutaneous fat rather than intra-abdominal measures such as liver size. This is consistent with the inability of the fetal liver to store much glycogen in early third trimester. Reece and coworkers105 showed that fetuses of diabetic mothers have normal growth of lean body mass such as head and skeletal growth, even when there is marked hyperglycemia. In longitudinal ultrasound studies, Bernstein and associates106 reported that fetal fat and lean body mass demonstrate unique growth profiles. These unique ultrasound profiles potentially provide a more sensitive marker of abnormal fetal growth, particularly in infants of women with diabetes based on the increased fat mass rather than lean mass of these neonates.106 At delivery, body composition studies by Catalano and colleagues107 have shown that birth weight alone, even when AGA, may not be a sensitive enough measure of fetal growth in the infant of the diabetic mother. They reported that although there were no sig- nificant differences in birth weight or lean body mass, the infants of women with GDM had increased fat mass and percent body fat com- pared with a normoglycemic control group (Table 46-7). PATHOPHYSIOLOGY OF FETAL OVERGROWTH Maternal Glucose Concentrations. Because glucose is the most easily measured nutrient and marker of diabetes, most studies evaluat- ing the effect of diabetes on fetal growth have used measures of glucose as a reference. Findings from the DIEP indicate that birth weight cor- related best with second- and third-trimester postprandial glucose measures. When 2-hour postmeal glucose measures averaged 120 mg/ dL or less, approximately 20% of infants were macrosomic. In contrast, when 2-hour postprandial glucose measures averaged up to 160 mg/ dL, the rate of macrosomia reached 35%.108 Similarly, Combs and coworkers109 reported that macrosomia was significantly associated with postprandial glucose levels between 29 and 32 weeks’ gestation.109 In contrast, Persson and associates110 showed that fasting glucose concentrations account for 12% of the variance in birth weight and correlated best with estimates of neonatal fat. Uvena and colleagues111 found the strongest correlation was between fasting glucose and neo- natal adiposity, rather than postprandial measures. Fetal Insulin Concentrations. Based on the early work of Ped- ersen,112 fetal insulin has long been considered a principal driving
  • 13. 965CHAPTER 46 Diabetes in Pregnancy factor of in utero fetal growth. Experimental data gathered from non- human primates by Susa and coworkers113 showed that in the rhesus monkey when implanted with an Alzet pump, which delivered con- tinuous, increasing insulin concentrations to the fetus independent of the mother’s metabolic condition, there was evidence of fetal over- growth.111 In contrast, when genetic mutations such as glucokinase deficiencies existed only in the fetus, the inability of the beta cell to respond to increasing glucose concentrations results in fetal growth restriction.25 Many studies have confirmed the correspondence of increased cord insulin concentrations with fetal macrosomia. Schwartz and associates114 found that umbilical cord insulin concentrations at delivery correlated with the degree of macrosomia. Cordocentesis studies in late third trimester showed that the ratio of fetal plasma insulin to glucose and the degree of macrosomia were strongly corre- lated.115 Krew and colleagues116 reported that amniotic fluid C-peptide measures at term had a strong correlation with fetal adiposity but not lean body mass. The relationship between elevated insulin concentrations and fetal macrosomia exists in late pregnancy, and there is evidence of altered metabolic function in early gestation. Carpenter and colleagues117 reported that elevated amniotic fluid insulin concentrations obtained from normoglycemic patients at 14 to 20 weeks’ gestation and adjusted for maternal age and weight correlated with the likelihood of subse- quently diagnosed GDM (OR = 1.9; CI, 1.3 to 2.4). Each increase in amniotic fluid insulin multiple of the median (MOM) was associated with a threefold increase in fetal macrosomia.117 These data support the concept that the underlying pathophysiology of GDM and fetal macrosomia may exist earlier in gestation than is routinely screened for and that it is consistent with subclinical pregravid maternal meta- bolic disturbances. Growth Factors. There has been considerable interest in the role of insulin-like growth factors (IGFs) and fetal growth. Members of the IGF family have been implicated in abnormalities of increased and decreased fetal growth in humans. IGF-1 and the ratio of IGF-2 to the IGF-2 soluble receptor have been positively correlated with the Ponderal index.118 However, there is also direct evidence using rodent knockout models. Baker and coworkers119 reported that null mutations for the IGF1 or IGF2 gene decreases neonatal weight by 40% in mice. The effect of both genes is additive.119 Liu and associates120 previously reported that IGF-1, IGF-2, and IGF-binding protein-3 (IGFBP-3) were significantly elevated in women with type 1 and 2 diabetes com- pared with a control group. These data are consistent with the findings of other investigators, including data for women with type 1 and 2 diabetes.121,122 Roth and colleagues123 reported that cord levels of IGF-1 were significantly greater in macrosomic IDMs than in nonmacroso- mic infants of glucose-tolerant or diabetic mothers. Radaelli and coworkers124 showed that there was a strong negative correlation between maternal circulating IGFBP-1 and lean body mass in the infants. The study authors speculated that IGFBP-1 might influence fetal growth by affecting IGF mediated placental nutrient transport, particularly of glucose or amino acids rather than lipids. Decreased IGFBP-1 levels are in keeping with a potential negative transcriptional regulation of the IGFBP1 gene by insulin.124 Maternal Obesity. Obesity is an epidemic in developed countries and the developing world.125 In the United States, the prevalence of obesity, defined as a body mass index (BMI = weight/height2 ) greater than 30 rose to 30.5% in 2000, compared with 22.9% from 1994 through 1998. The proportion of the population meeting the defini- tion of overweight (BMI > 25) increased from 55.9% to 64.5% during the same period.18 The risk of obesity is disproportionate among the races, increasing most among African Americans and Hispanics, the same populations at risk for type 2 diabetes. Several studies suggest that maternal obesity before conception has an independent effect on fetal macrosomia. Vohr and associates126 analyzed various risk factors for neonatal macrosomia in women with overt and GDM compared with obese and normal weight controls.126 Multiple regression analyses revealed the pre-pregnancy weight and weight gain were significant predictors for infants of GDM and control mothers. In an effort to better understand the potential independent effect of maternal obesity on growth of infants of GDM and normoglycemic women, Catalano and colleagues127 performed a stepwise logistic regression analysis on data for 220 infants of mothers with normal glucose tolerance and 195 infants of GDM (Table 46-8). Gestational age at term had the strongest correlation with birth weight and lean body mass. In contrast, maternal pregravid BMI had the strongest correlation (approximately 7%) with fat mass and percent body fat. Although almost 50% of the subjects had GDM, only 2% fraction of the variance was correlated to fat mass.127 These data support an independent effect of maternal pre- gravid obesity on fetal growth, particularly fat mass, independent of GDM. Other Fuels. Many factors are related to fetal overgrowth of the infant of a woman with diabetes. The significant decreases in insulin sensitivity in late gestation affect glucose and lipid and amino acid metabolism. Although we clinically concentrate on glucose, other nutrients most probably contribute to fetal overgrowth. This concept is consistent with the hypothesis of fuel-mediated teratogenesis first proposed by Freinkel in 1980.128 Circulating amino acid concentrations reflect the balance between protein breakdown and synthesis. Dug- gleby and Jackson129 estimated that there is a 15% increase in protein synthesis during the second trimester and a further 25% increase in the third trimester compared with levels in nonpregnant women. These differences appear to have a strong relationship to fetal growth, particularly lean body mass. Butte and coworkers130 and Metzger and associates131 independently reported higher amino acid concentrations in women with GDM compared with a normoglycemic control group. Zimmer and colleagues132 reported no significant difference in amino acid turnover in women with GDM and a control group. However, the TABLE 46-7 NEONATAL ANTHROPOMETRICS OF NEWBORNS OF WOMEN WITH GESTATIONAL DIABETES MELLITUS AND NORMAL GLUCOSE TOLERANCE Feature Measured* GDM (n = 195) NGT (n = 220) P Value Weight (g) 3398 ± 550 3337 ± 549 .26 Fat free mass (g) 2962 ± 405 2975 ± 408 .74 Fat mass (g) 436 ± 206 362 ± 198 .0002 Body fat (%) 2.4 ± 4.6 10.4 ± 4.6 .0001 Skinfold Triceps 4.7 ± 1.1 4.2 ± 1.0 .0001 Subscapular 5.4 ± 1.4 4.6 ± 1.2 .0001 Flank 4.2 ± 1.2 3.8 ± 1.0 .0001 Thigh 6.0 ± 1.4 5.4 ± 1.5 .0001 Abdominal wall 3.5 ± 0.9 3.0 ± 0.8 .0001 *Data are presented as the mean ± SD. GDM, gestational diabetes mellitus; NGT, normal glucose tolerance. Adapted from Catalano PM, Thomas A, Huston-Presley L, Amini SB: Increased fetal adiposity: A very sensitive marker of abnormal in utero development. Am J Obstet Gynecol 189:1698-1704, 2003.
  • 14. 966 CHAPTER 46 Diabetes in Pregnancy investigators found that hyperinsulinemia was required to maintain normal amino acid turnover in the GDM women.132 Kalhan and coworkers133 reported that leucine turnover and oxidation were greater in the obese woman with GDM compared with less obese control subjects. The increased insulin concentrations required to maintain appropriate amino acid levels in the woman with diabetes may be another manifestation of the increased insulin resistance in pregnant women with GDM. Knopp and associates134 found that there is a twofold to fourfold increase in triglyceride concentrations and a 25% to 50% increase in cholesterol during gestation. This group also reported a further increase in triglyceride and high-density lipoprotein cholesterol concentrations in type 2 and GDM patients.135 Similarly, Xiang and colleagues43 described increased basal free fatty acid concentrations in Hispanic women with GDM in the third trimester compared with a matched control group.136 Knopp and coworkers137 also reported that mid-tri- mester triglyceride concentrations were a better predictor of macroso- mia than glucose values during the glucose tolerance test. Similarly, Kitajima and colleagues138 examined lipid profiles in women with an abnormal glucose challenge test in pregnancy and reported that the triglycerides had a significant correlation with birth weight, even after adjusting for significant covariables. Although lipid transport from the mother to fetus is not well understood, maternal lipid metabolism may play a significant role in fetal growth, particularly in accrual of adipose tissue. Birth Injury Birth injury is more common among the offspring of diabetic mothers, and macrosomic fetuses are at the highest risk.139 The most common birth injuries associated with diabetes are brachial plexus palsy, facial nerve injury, humerus or clavicle fracture, and cephalhematoma. Athu- korala and associates140 studied women with gestational diabetes and found a positive relationship between the severity of maternal fasting hyperglycemia and the incidence of shoulder dystocia, with a doubling of risk with each 1-mmol increase in the fasting plasma glucose value on the OGTT. Shoulder dystocia occurred more often in diabetic deliv- eries requiring operative vaginal assistance (RR = 9.58; CI, 3.70 to 24.81: P < .001) and in fetuses above the 90th percentile of birth weight for age (RR = 4.57; CI, 1.74 to 12.01; P < .005) (Fig. 46-10). Most of the birth injuries occurring in infants of diabetic pregnancy are associated with difficult vaginal delivery and shoulder dystocia. Although shoulder dystocia occurs in 0.3% to 0.5% of vaginal deliver- ies among normal pregnant women, the incidence is twofold to four- fold higher for women with diabetes because the excessive fetal fat deposition associated with hyperglycemia in poorly controlled diabetic pregnancy causes the fetal shoulder and abdominal widths to become massive.140 Although one half of shoulder dystocias occur in infants of normal birth weight (2500 to 4000 g), the incidence of shoulder dys- TABLE 46-8 STEPWISE REGRESSION ANALYSIS OF FACTORS RELATING TO FETAL GROWTH AND BODY COMPOSITION IN INFANTS OF WOMEN WITH GESTATIONAL DIABETES MELLITUS (n = 195) AND NORMAL GLUCOSE TOLERANCE (n = 220) Factor r 2 Dr 2 P value Birth Weight Estimated gestational age 0.114 — Pregravid weight 0.162 0.048 Weight gain 0.210 0.048 Smoking (−) 0.227 0.017 Parity 0.239 0.012 .0001 Lean Body Mass Estimated gestational age 0.122 — Smoking (−) 0.153 0.031 Pregravid weight 0.179 0.026 Weight gain 0.212 0.033 Parity 0.225 0.013 Maternal height 0.241 0.016 Paternal weight 0.250 0.009 .0001 Fat Mass* Pregravid BMI 0.066 — Estimated gestational age 0.136 0.070 Weight gain 0.171 0.035 Group (GDM) 0.187 0.016 .0001 Percent Body Fat* Pregravid BMI 0.072 — Estimated gestational age 0.116 0.044 Weight gain 0.147 0.031 Group (GDM) 0.166 0.019 .0001 *Pregravid maternal obesity has the strongest correlation with neonatal measures of fat mass/% body fat in contrast to lean body mass. BMI, body mass index; GDM, gestational diabetes mellitus. Adapted from Catalano PM, Ehrenberg HM: The short and long term implications of maternal obesity on the mother and her offspring. BJOG 113:1126-1133, 2006. Assisted, DM Unassisted, DM Assisted, no DM Unassisted, no DM 3750–4000 3500–3750 4250–4500 Birth weight (grams) 0 50 100 150 200 250 Shoulderdystociaincidenceper1000 300 350 400 4000–4250 4750–5000 4500–4750 FIGURE 46-10 Risk of shoulder dystocia by diabetes status and instrumental delivery. Shoulder dystocia occurred more often in diabetic deliveries requiring operative vaginal assistance and in fetuses above the 90th percentile of birth weight for age. DM, diabetes mellitus. (From Nesbitt TS, Gilbert WM, Herrchen B: Shoulder dystocia and associated risk factors with macrosomic infants born in California. Am J Obstet Gynecol 179:476, 1998.)
  • 15. 967CHAPTER 46 Diabetes in Pregnancy tocia rises 10-fold to 5% to 7% among infants weighing 4000 g or more. However, if maternal diabetes is present, the risk at each birth- weight class is increased fivefold.141 These risks are further magnified if a forceps or vacuum delivery is performed.142 The level of glycemic control is strongly correlated with the risk of shoulder dystocia and birth injury, presumably because increasing levels of hyperglycemia are associated with greater fetal fat deposition. Athukorola and colleagues140 reported a positive correlation between the severity of maternal fasting hyperglycemia and the risk of shoulder dystocia, with each 1-mmol increase in the fasting value in the OGTT associated with an increasing relative risk of 2.09 (CI, 1.03 to 4.25). Although it would be desirable to predict shoulder dystocia on the basis of warning signs during labor such as labor protraction, a suspected macrosomic infant, or the need for midpelvic forceps delivery, less than 30% of these events can be predicted from clinical factors.143 Neonatal Morbidity and Mortality Polycythemia and Hyperviscosity Polycythemia (i.e., central venous hemoglobin concentration >20 g/dL or hematocrit >65%) occurs in 5% to 10% of IDMs and is apparently related to glycemic control. Hyperglycemia is a powerful stimulus for fetal erythropoietin production, which is probably mediated by decreased fetal oxygen tension.144 Untreated, neonatal polycythemia may promote vascular sludging, ischemia, and infarction of vital tissues, including the kidneys and central nervous system. Neonatal Hypoglycemia Approximately 15% to 25% of neonates delivered from women with diabetes during gestation develop hypoglycemia during the immediate newborn period.145 Neonatal hypoglycemia is less common when tight glycemic control is maintained during pregnancy146 and in labor. A detailed study by Taylor and associates147 found no correlation between the likelihood of neonatal hypoglycemia and Hb A1c, whereas mean maternal glucose levels during labor were strongly predictive. Because unrecognized postnatal hypoglycemia may lead to neonatal seizures, coma, and brain damage, it is imperative that the neonatal team caring for the neonate follow a protocol of frequent postnatal glucose monitoring until metabolic stability is ensured. Neonatal Hypocalcemia and Hyperbilirubinemia Low levels of serum calcium (<7 mg/100 mL) have been reported in up to 50% of IDMs during the first 3 days of life, although later series record an incidence of 5% or less with better-managed pregnancies.148 Neonatal hyperbilirubinemia occurs in approximately 25% of IDMs, a rate approximately double that for normal infants, with prematurity and polycythemia being the primary contributing factors. Close moni- toring of the newborn of diabetic pregnancy is necessary to avoid the further morbidity of kernicterus, seizures, and neurologic damage. Hypertrophic and Congestive Cardiomyopathy In some macrosomic, plethoric infants of mothers with poorly con- trolled diabetes, a thickened myocardium and significant asymmetrical septal hypertrophy has been described.149 The prevalence of clinical and subclinical asymmetrical septal hypertrophy in IDMs has been estimated to be as high as 30% at birth, with resolution by 1 year of age.150 Kjos and colleagues151 found that cardiac dysfunction associated with this entity often leads to respiratory distress, which may be mis- taken for hyaline membrane disease. IDMs who manifest cardiac dysfunction in the neonatal period may have congestive or hypertrophic cardiomyopathy. This condition is often asymptomatic and unrecognized. Echocardiograms show a hypercontractile, thickened myocardium, often with septal hypertro- phy disproportionate to the ventricular free walls.152 The ventricular chambers are often smaller than normal, and there may be anterior systolic motion of the mitral valve, producing left ventricular outflow tract obstruction. Neonatal septal hypertrophy may be a response to chronic hyper- glycemia. The maternal level of IGF-1, which is elevated in subopti- mallycontrolleddiabeticpregnancy,issignificantlyelevatedinneonates with asymmetrical septal hypertrophy. Because IGF-1 does not cross the placenta, it may exert its action through binding to the IGF-1 receptor on the placenta.153 Halse and coworkers154 found that the level of B-type natriuretic protein (BNP), a marker for congestive cardiac failure, is elevated in neonates whose mothers had poor glycemic control during the third trimester. Septal hypertrophy can be identified with sonography in the pre- natal period. Cooper and coworkers155 performed serial fetal echocar- diography on 61 pregnant, diabetic women, demonstrating excessive ventricular septal thickness in the fetuses that were diagnosed postna- tally with asymmetrical septal hypertrophy. When the newborns with asymmetrical septal hypertrophy were compared with normal infants, birth weights (4009 versus 3457 g; P < .01) and maternal glycosylated hemoglobin levels (6.7% versus 5.7%) were higher in infants with cardiomyopathy. Respiratory Distress Syndrome Until recently, respiratory distress syndrome was the most common and most serious disease in IDMs. In the 1970s, improved prenatal maternal management for diabetes and new techniques in obstetrics for timing and mode of delivery resulted in a dramatic decline in its incidence, from 31% to 3%.156 However, even when matched by gesta- tional week of pregnancy, IDMs are more than 20 times as likely as infants from normal pregnancies to develop respiratory distress syndrome.157 The increased susceptibility to respiratory distress may result from altered production of alveolar surfactant or abnormal pulmonary function. Kulovich and Gluck158 reported delayed timing of phospho- lipid production in diabetic pregnancy, as indicated by a delay in the appearance of phosphatidylglycerol in the amniotic fluid. In their study, maturational delay occurred only in gestational diabetes (White class A patients); fetuses of women with other forms of diabetes showed normal or accelerated maturation of pulmonary phospholipid profiles. Although some investigators have failed to demonstrate a delay in lung maturation in diabetic pregnancy,159,160 most reports in the litera- ture indicate a significant biochemical and physiologic delay in IDMs. Tyden and colleagues161 and Landon and coworkers162 reported that fetal lung maturity occurred later in pregnancies with poor glycemic control (mean plasma glucose level >110 mg/dL), regardless of class of diabetes, when the infants were stratified by maternal plasma glucose levels. These findings were confirmed by Moore,163 who demonstrated no differences in the rate of rise of the amniotic fluid lecithin-to- sphingomyelin ratio among types of diabetes or degree of glucose control but found that amniotic fluid phosphatidylglycerol was delayed approximately 1.5 weeks in women with pregestational or GDM dia- betes compared with controls (Fig. 46-11). The delay in phosphatidyl- glycerol was associated with an earlier and higher peak in the level of phosphatidyl inositol, suggesting that elevated maternal plasma levels of myoinositol in diabetic women may inhibit or delay the production of phosphatidylglycerol in the fetus.
  • 16. 968 CHAPTER 46 Diabetes in Pregnancy It is possible that poor neonatal respiratory performance in the IDM may have a histologic basis in addition to a biochemical cause. Kjos and coauthors151 identified respiratory distress in 3.4% of infants delivered of diabetic women, but surfactant-deficient airway disease accounted for less than one third of cases, with transient tachy- pnea, hypertrophic cardiomyopathy, and pneumonia responsible for most. The near-term infant of a mother with poorly controlled diabetes is more likely to have neonatal respiratory dysfunction than is the infant of a nondiabetic mother. The observations of Moore163 indicate that the average nondiabetic fetus achieves pulmonary maturity at 34 to 35 weeks’ gestation, with more than 99% of normal newborns having a mature phospholipid profile by 37 weeks. In diabetic preg- nancy, however, it cannot be assumed that lung maturity exists until approximately 10 days after the nondiabetic time (38.5 gestational weeks). Any delivery contemplated before 38.5 weeks’ gestation for other than the most urgent fetal and maternal indications should be preceded by documentation of pulmonary maturity by amniocentesis. The neonatal complications of the offspring of diabetic pregnancy is discussed further in Chapter 58. Long-Term Risks for the Fetus of the Obese Mother Although much has been written about the increased risk of the meta- bolic syndrome (i.e., obesity, hypertension, insulin resistance, and dys- lipidemia) in infants born SGA, evidence points toward an increase in adolescent and adult obesity in infants born LGA or macrosomic. There has been abundant evidence linking higher birth weights to increased obesity of adolescents and adults for at least 25 years.164 Large cohort studies such as the Nurses Health Study165 and the Health Pro- fessional Follow-up Study166 report a J-shaped curve (i.e., a slightly greater BMI among subjects born small but a much greater prevalence of overweight and obesity in those born large).167 The increased preva- lence of adolescent obesity is related to an increased risk of the meta- bolic syndrome. The increased incidence of obesity accounts for much of the 33% increase in type 2 diabetes, particularly among the young. Between 50% and 90% of adolescents with type 2 diabetes have a BMI greater than 27,168 and 25% of obese children between 4 and 10 years old have impaired glucose tolerance.169 The epidemic of obesity and subsequent risk for diabetes and components of the metabolic syn- drome may begin in utero with fetal overgrowth and adiposity, rather than undergrowth. A retrospective cohort study by Whitaker170 enrolling more than 8400 children in the United States in the early 1990s reported that children who were born to obese mothers (based on BMI in the first trimester) were twice as likely to be obese when they were 2 years old. If a woman had a BMI of 30 or more in the first trimester, the preva- lences of childhood obesity (BMI > 95th percentile based on criteria of the Centers for Disease Control and Prevention [CDC]) at ages 2, 3, and 4 years were 15.1%, 20.6%, and 24.1%, respectively. This was between 2.4 and 2.7 times the prevalence of obesity observed in children of mothers whose BMI values were in the normal range (18.5 to 24.9). This effect was only slightly modified by birth weight. There is an independent effect of maternal pregravid weight and diabetes on birth weight and on the adolescent risk of obesity. Langer and colleagues171 reported that in obese women with GDM whose glucose was well controlled on diet alone, the odds of fetal macrosomia (birth weight >4000 g) were significantly increased (OR = 2.12) com- pared with women with well-controlled (diet only) GDM and normal BMIs. Similar results were reported for women with GDM who were poorly controlled with diet or with insulin. In well-controlled, insulin- requiring women with GDM, there was no significant increased risk of macrosomia with increasing pregravid BMI. Dabelea and associ- ates172 reported that the mean adolescent BMI was 2.6 kg/m2 greater in sibling offspring of diabetic pregnancies compared with the index siblings born when the mothers previously had normal glucose toler- ance. Both maternal pregravid obesity and the presence of maternal diabetes may independently affect the risk of adolescent obesity in the offspring. This risk of developing the metabolic syndrome in adolescents was addressed by Boney and colleagues173 in longitudinal cohort study of AGA and LGA infants of women with normal glucose tolerance and GDM. The metabolic syndrome was defined as the presence of two or more of the following components: obesity, hypertension, glucose intolerance, and dyslipidemia. Maternal obesity was defined as a pre- gravid BMI higher than 27.3. Children who were LGA at birth had an increased hazard ratio (HR) for metabolic syndrome (HR = 2.19; CI, 1.25 to 3.82; P = .01) by age 11 years, as did children of obese women (HR = 1.81; CI, 1.03 to 3.19; P = .04). The presence of maternal GDM was not independently significant, but the risk for developing meta- bolic syndrome was significantly different between LGA and AGA off- spring of GDM by age 11 years (RR = 3.6). Childhood Neurologic Abnormalities Several reports have suggested childhood neurodevelopmental abnor- malities in offspring of diabetic mothers. Rizzo and colleagues174 com- pared the offspring of 201 mothers with diabetes with 83 children of normal mothers and correlated subsequent childhood obesity in the offspring of diabetic mothers with internalizing behavior problems, 29 0 Cumulative%PGՆ3% 20 40 60 80 100 31 33 35 Gestational week at amniocentesis 37 39 41 43 Controls Overt DM GDM FIGURE 46-11 Delay in fetal pulmonary phosphatidyl glycerol. The delay in fetal pulmonary phosphatidyl glycerol was associated with a sustained peak in phosphatidyl inositol in diabetic pregnancy, suggesting that elevated maternal plasma levels of myoinositol in a diabetic woman may inhibit or delay the production of phosphatidyl glycerol in the fetus. DM, diabetes mellitus; GDM, gestational diabetes mellitus; PG, phosphatidyl glycerol. (From Moore TR: A comparison of amniotic fluid fetal pulmonary phospholipids in normal and diabetic pregnancy. Am J Obstet Gynecol 186:641, 2002.)
  • 17. 969CHAPTER 46 Diabetes in Pregnancy somatic complaints, anxiety or depression, and social problems. Ornoy and associates175 assessed IQ scores on the Wechsler Intelligence Scale for Children–Revised (WISC-R) and Bender tests of the children born to diabetic mothers. No differences were found between the study groups in various sensorimotor functions compared with controls, but the children of diabetic mothers performed less well than controls in fine and gross motor functions, and they scored lower on the Pollack taper test, which is designed to detect inattention and hyperactivity. These investigators also found a negative correlation between the severity of maternal hyperglycemia, as assessed by glycosylated hemo- globin levels in the third trimester, and performance on neurodevel- opmental and behavioral tests. Preconceptional Management of Women with Pregestational Diabetes Although widely underused,176 preconceptional care programs have consistently been associated with decreased morbidity and mortality.177 Patients enrolled in preconceptional diabetes-management programs obtain earlier prenatal care and have lower Hb A1c values in the first trimester.178 A comparison of outcomes among women participating in a intensive preconceptional program with outcomes among women receiving standard care demonstrated lower perinatal mortality (0% versus 7%) and reduced congenital anomalies (2% versus 14%). When the preconceptional program was discontinued because of a lack of funds, the congenital anomaly rate increased by more than 50%.7 Risk Assessment Several factors should be considered in preconceptional diabetes risk assessment (Table 46-9): ᭿ Glycemic control should be assessed directly from glucose logs and by glycosylated hemoglobin levels. ᭿ For patients who have had diabetes for 10 years or longer, an electrocardiogram, an echocardiogram, and microalbuminuria and serum creatinine studies should be performed. ᭿ Because retinopathy can progress during pregnancy, the patient should establish a relationship with a qualified ophthalmologic provider. A baseline retinal evaluation should be completed within the year before conception, with laser photocoagulation performed if needed. Previous laser treatment is not a contraindication to pregnancy and may avoid significant hemorrhage during pregnancy. ᭿ Thyroid function (i.e., thyroid-stimulating hormone and free thyroxine) should be evaluated and corrected as necessary in all patients with pregestational diabetes because of the frequent coincidence of autoimmune thyroid disease and diabetes. ᭿ A daily prenatal vitamin that provides 1 mg of folic acid should be prescribed for a minimum of 3 months before conception, because folate supplementation significantly reduces the risk of congenital neural tube defects. ᭿ The patient’s occupational, financial, and personal situation should be reviewed, because job and family pressures can become barriers to achieving and maintaining excellent glycemic control. In patients with pre-pregnancy hypertension or proteinuria, particular emphasis should be given to defining support systems that permit extended bed rest in the third trimester, if it becomes necessary. ᭿ The patient’s preconception medications should be reviewed and altered to avoid teratogenicity and potential embryonic toxicity. Statins are pregnancy category X drugs and should be discontinued before conception. Angiotensin-converting enzyme (ACE) inhibitors and angiotensin receptor blockers (ARBs) should be discontinued before conception because of first trimester teratogenicity and fetal renal toxicity in the second half of pregnancy. Among oral antidiabetic agents used by reproductive-aged women, metformin and acarbose are classified as pregnancy category B drugs, although systematic data on safety are lacking. All other agents are category C drugs, and unless the potential risks and benefits of oral antidiabetic agents in the preconception period have been TABLE 46-9 PRECONCEPTIONAL EVALUATION OF THE DIABETIC PATIENT Procedure Tests Recommendations Medical history, family history, review of symptoms Selected patients: fasting and postprandial C-peptide determinations to clarify type of diabetes Avoid pregnancy until Hb A1c value is in the normal, nonpregnant range Physical examination findings Hypertension ECG, cardiac, renal evaluation Antihypertensive medications Retinopathy Retinal evaluation Ophthalmology consultation Goiter T4, thyroid-stimulating hormones, antibodies Neuropathy Vascular, podiatric evaluations Obesity Exercise, weight loss Proteinuria 24-hr urine for protein, creatinine Nephrology consultation if renal function abnormal Diabetes assessment Hb A1c Glycemic control Home glucose monitoring Stable glycemic profile Nutrition Dietitian consultation Occupational and family life assessment Help prepare patient for lifestyle commitments necessary for tight glycemic control ECG, electrocardiogram; Hb, hemoglobin; T4, thyroxine.