
Recommended
More Related Content
Viewers also liked
Viewers also liked (14)
Similar to Consumer prices Sint Maarten August 2012
Similar to Consumer prices Sint Maarten August 2012 (20)
More from PearlRadio Station
More from PearlRadio Station (20)
Recently uploaded
Recently uploaded (20)
Consumer prices Sint Maarten August 2012
- 1. DEPARTMENT OF STATISTICS (STAT) For more information: 549-0235 or 2151 – fax 542-3022 Address: Juancho Yrausquin Boulevard 6 (units 7/8) Email: statinfo@sintmaartengov.org Press release Philipsburg, September 14th 2012 Consumer prices Sint Maarten August 2012 Prices have decreased compared to June 2012 The consumer price index for Sint Maarten has decreased in the month of August 2012 by 0.3 percent compared to that of June 2012. When comparing average consumer prices over a twelve month period (Aug. 2011 to Aug. 2012), an increase of 4.7 percent was recorded compared to the same period one year earlier. The rate of inflation has shown steady growth since April 2011; reaching an all-time high of 5.5 percent in April of this year. However as of June contraction in the rate of inflation was observed; recorded rates of 5.2 and 4.7 for June and August respectively. Nevertheless, price inflation of the food expenditure category continued to climb at an alarming rate of 14 percent in August 2012. This is evident from the data that has been released by the Department of Statistics (STAT) today. 1
- 2. Price changes between June & August 2012 The consumer price index for Sint Maarten has decreased in the month of August 2012 by 0.3 percent compared to that of June 2012. The price index recorded in August 2012 is 120.4. INDEX INDEX % Expenditure Category WEIGHT JUNE 2012 AUGUST CHANGE 2012 Food 10% 157.7 159 0.8 Beverages and tobacco 1% 138.8 139.6 0.6 Clothing & footwear 7% 113 113.7 0.6 Housing 39% 122.1 120.7 -1.1 Household furnishing & appliances 6% 121.1 122 0.7 Medical care 3% 105.7 105.3 -0.4 Transport & communication 20% 109.9 109.4 -0.5 Recreation & education 6% 106.7 106.8 0.1 Misc. 8% 114.1 113.6 -0.4 TOTAL 100% 120.8 120.4 -0.3 Expenditure Categories Note that in August 2012, five of the nine expenditure categories have become more expensive, whilst four became cheaper. Amongst the more expensive were the categories; Food (+0.8%), Beverages and Tobacco (+0.6%) Clothing and Footwear (+0.6%), Household Furnishing & Appliances (+0.7%) and Recreation & Education (+0.1%) Whereas, Housing (-1.1%), Medical Care (-0.4%), Transport & Communication (-0.5%), and Miscellaneous (-0.4%) became cheaper. A Closer Look The categories with the largest influence in the basket are Housing (39%), Transport & Communication (20%) and Food (10%); In August 2012 the expenditure category Housing impacted the overall index the most with a decrease (-1.1%) in consumer prices of this category. The expenditure category Food recorded the largest price increase (+0.8%) in August 2012 relative to June 2012. 2
- 3. Food FOOD EXPENDITURE CATEGORY 10% of CPI Grain Other food +1.1% resources 1.0% Eating-out -0.4% Meat and Fish +1.5% Pre-cooked dishes +1.5% Sugar & Chocolate -0.9% Fats & Oils Potatoes, +1.4% Vegetables & Fruits Dairy Products +0.5% +0.1% 1 Within the expenditure category Food it can be noted that seven of the nine food groups became more expensive whilst two became cheaper. The following increases were recorded in each food group; Grain (+1.1%), Meat and Fish (+1.5%), Fats & Oils (+1.4%), Dairy Products (+0.1%), Potatoes, Vegetables & Fruit (+0.5%), Pre-cooked dishes (+1.5%), and other food resources (+1.0%). The food groups Sugar & Chocolate (-0.9%) and Eating-out (-0.4%) became slightly cheaper. More specifically the following products largely influenced the total price change within the food group: Grains largely influenced by; White Bread (+4.6%) and Brown rice (-3.6 %). The food group Meat & Fish was largely influenced by; Beef (-5.2%), oxtail (-9.7%), pork loin (+16.7%), Spareribs (+26.6%) and other pork meat (+3.8%). The food group Dairy Products was largely influenced by; Canned milk (+3.6%) and Eggs (-3.6%). The food group Potatoes, Vegetables & Fruit was largely influenced by; Cabbage (+9.6%), Carrots and Potatoes (+4.4%), Onions & Garlic (-3.7%), Tomatoes (+7.3%), dried beans and peas (+11.5%), Apples and Pears (+5.7%), Raisins and prunes (-3.1%), Peanut Butter (+8.1%), other nuts (+12.8%) and spices (+3.3%) 1 Please note that the pie chart above depicts the share (weight) each food group carries toward the entire Food expenditure category, whilst the percentages indicate the price change within that food group. 3
- 4. Sint Maarten Food Market in the Spotlight Sint Maarten’s Food commodity prices have shown considerable increases over the past twelve months (Aug. 2011 to Aug. 2012). The bar graph below depicts the upward trend in monthly developments for the expenditure category Food. Note that as of February this year, Food prices have been inflated by double-digit percentages, reaching a peak inflation of 14 percent in August 2012. It should be noted that though the Food category accounts for 10 percent of the consumer basket, the relative effect that the inflation recorded in this category has on the total consumer inflation rate is approximately 32 percent2. Monthly Index Developments for the Expenditure Category Food (Oct 2006 - Aug 2012) *Oct 2006 = 100 180.0 160.0 140.0 120.0 Inflation Rate 100.0 80.0 60.0 40.0 20.0 0.0 APRIL APRIL APRIL APRIL APRIL APRIL FEBRUARY FEBRUARY FEBRUARY FEBRUARY OCTOBER FEBRUARY FEBRUARY OCTOBER DECEMBER OCTOBER DECEMBER OCTOBER DECEMBER OCTOBER DECEMBER DECEMBER OCTOBER DECEMBER JUNE AUGUST JUNE AUGUST JUNE AUGUST JUNE AUGUST JUNE AUGUST JUNE AUGUST 2006 2007 2008 2009 2010 2011 2012 2 Relative Influence Factor = 28 percent = (10% Weight Factor x 14 % Food inflation) / (Consumer Inflation) 4
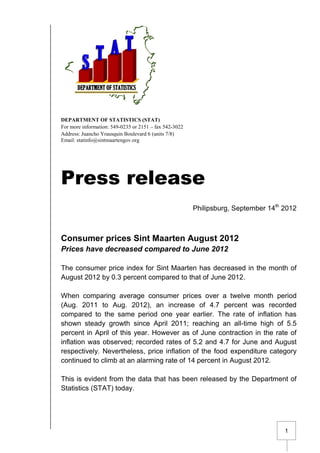
- 5. Bi-monthly Inflation Developments for the Expenditure Category Food (August 2010 - August 2012) 16.0% 14.0% 14.0% 12.0% Inflation Rate 10.0% 8.0% 6.0% 4.2% 4.7% 4.0% 2.0% 0.0% FEBRUARY APRIL FEBRUARY APRIL JUNE JUNE AUGUST AUGUST AUGUST OCTOBER DECEMBER OCTOBER DECEMBER 2010 2011 2012 5
- 6. Housing HOUSING EXPENDITURE CATEGORY 39% of CPI Energy expenses -7.0% Maintenance of dwelling +1.0% Garden maintenance +1.4% Dwelling costs Water +0.4% +0.0% 3 Within the expenditure category Housing it can be noted that three of the five product groups became more expensive whilst one remain unchanged and one became cheaper. The product groups Energy expenses decreased with 7.0 percent, whilst House maintenance (+1.0%) and Garden maintenance (+1.4%) and Dwelling costs (+0.4%) recorded increases. It must be emphasized that the overall decrease recorded in this expenditure category is primarily attributable to the decrease in Energy Expenses. More specifically it must be noted that the product Electricity (-8.4%) largely influenced the total price percentage change recorded in the product group Energy Expenses. The increased prices observed in roof material (+4.6%) and other material (+3.2%) largely influenced the total price percentage change recorded in the product group House maintenance. Whilst the product group Garden maintenance was largely influenced by the product fertilizer (+3.8%). 3 Please note that the pie chart above depicts the share (weight) each food group carries toward the entire Housing expenditure category, whilst the percentages indicate the price change within that product group. 6
- 7. Transport & Communication TRANSPORTATION AND COMMUNICATION EXPENDITURE CATEGORY 20% of CPI Vehicle Purchase Communication +1.1% +0.0% Vehicle Expenses Transport services -2.5% +0.0% 4 Within the expenditure category Transport & Communication one of the four product groups became more expensive and one became cheaper, whilst two remained unchanged. The consumer prices within the product group Vehicle Expenses decreased by 2.5 percent; whilst consumer prices for Vehicle Purchase increased by 1.1 percent. The consumer prices for the product groups Communication and Transport Services remained stable. Noteworthy is that the product group Vehicle Expenses was largely influenced by the following products; Gasoline (-6.0%) and Diesel (-1.9%). The increased consumer prices of 1.2 percent for a new vehicle largely influenced the product group Vehicle Purchase. 4 Please note that the pie chart above depicts the share (weight) each food group carries toward the entire Transport & Communication expenditure category, whilst the percentages indicate the price change within that product group. 7
- 8. Long-term inflation Inflation Sint Maarten June 2012 The 12-month average of consumer prices was 4.7 percent higher in August 2012 than in August 2011. This represents an increase in the inflation rate of 46.5 percent within this period mentioned. Inflation per Expenditure Category All nine expenditure categories recorded inflation in August 2012. Housing at a rate of 2.8 percent, which is the category with the largest influence (39%), Transportation and Communication at a rate of 2.4 percent, which is the second largest category (20%) and Food prices inflated at a rate of 14 percent, which is the third largest category (10%). Noteworthy is that though Food is the third largest category it has the largest contributing influence to the overall inflation rate; this is directly resulting from the soaring inflation recorded in this category. Inflation per Sector on Sint Maarten 14.0 % 11.1% 2.8 % 6.6 % 6.2 % 3.7 % 3.2% 2.4 % 2.4 % Food Beverages and Clothing & Housing Household Medical care Transport & Recreation & Misc. tobacco footwear furnishing & Communication Education appliances 12 Month Ave. AUG 2011 12 Month Ave. AUG 2012 8
- 9. 2-year Overview The trend line depicted on the bar chart below indicates that inflation on Sint Maarten over the prior 2-year period has been climbing. The rate of inflation has shown steady growth since April 2011; reaching an all-time high of 5.5 percent in April of this year. However as of June this year; a contraction in the rate of inflation was observed. Inflation of 4.7 percent for August 2012 is comparable to that of December 2011 (4.6%); it the lowest recorded inflation rate for this year to date. Sint Maarten Inflation during the period August 2010 - August 2012 6.0% 5.5% 5.2% (% change of the 12-month average C 4.7% 5.0% 4.0% 3.6% Inflation 3.0% 2.7% 2.0% 1.0% 0.0% DECEMBER DECEMBER FEBRUARY APRIL FEBRUARY APRIL AUGUST AUGUST JUNE JUNE AUGUST OCTOBER OCTOBER 2010 2010 2010 2011 2011 2011 2011 2011 2011 2012 2012 2012 2012 9